


Related

Trading Strategies
There is a long-running link between investor sentiment, like the AAII Sentiment Survey, reaching unusual levels and the market changing direction.

Charles Rotblut leads a class in AAII's new Essential Investing Video Course. Go to https://www.aaii.com/ves for more information and to subscribe.
Among the enhancements we made to AAII.com earlier this year was a redesign of the AAII Sentiment Survey page. New charts were added in response to member feedback as well as a map showing how members have voted across the country. Given these changes, we thought now would be a good time to discuss how to incorporate investor sentiment into your portfolio decisions.
The AAII Sentiment Survey is one of the oldest continuously running surveys of investor sentiment. Whereas other surveys track the attitudes of newsletter writers (e.g., the Investors Intelligence U.S. Advisors Sentiment Report) or institutional investors, the AAII Sentiment Survey reflects the view of individual investors. Only AAII members can take the survey.
The AAII Sentiment Survey started in July 1987. It was initially conducted by mailing out postcards to a random group of AAII members. The survey moved online in early 2000. We receive approximately 330 responses on an average week.
The question has never changed. The survey simply asks respondents to complete the statement “I feel that the direction of the stock market over the next six months will be …” by choosing one of three options:
Surveys and other measures of investor sentiment (e.g., put-call ratios) reveal the current attitudes of investors. They shed light on whether investors are feeling optimistic, pessimistic or somewhere in between. What they don’t tell you is where the stock market is headed. Sentiment indicators do not have a causal relationship with market direction.
We’ve seen this when comparing the results of the AAII Sentiment Survey to the AAII Asset Allocation Survey. AAII members, as a group, have smartly tended to adjust their portfolio allocations at a slower rate than their market expectations. Sentiment reflects how an investor feels currently, while portfolio allocations should reflect what an investor is doing to achieve their long-term goals. It’s normal to be emotional; it’s not good to act on those emotions.
What sentiment readings can do is prompt you to take a step back and assess the broader market environment. Ask where valuations are, what the economic trends are and what is occurring with earnings.
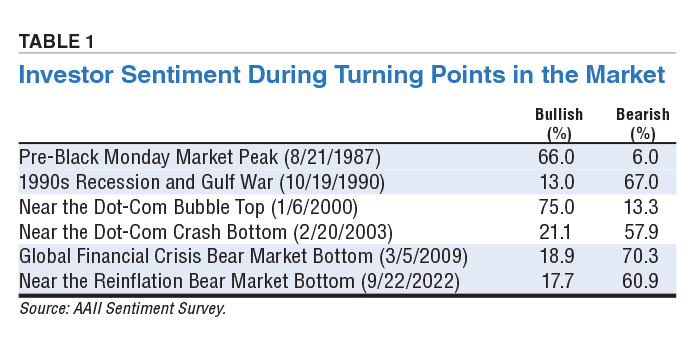
Throughout the history of the AAII Sentiment Survey, we’ve observed examples of this. Table 1 shows some of the highest and lowest bullish and bearish sentiment readings in our survey. Bullish sentiment set a record high of 75.0% just two months prior to the peak of the dot-com bubble in 2000. Bearish sentiment set a record high of 70.3% just a few days prior to when the global financial crisis bear market finally reached its bottom in 2009. More recently, the fourth-highest level of pessimism ever recorded by our survey occurred in September 2022, just before the S&P 500 index reached the bottom of the reinflation bear market.
In every single case, there were events influencing investor sentiment. In early 2000, stocks associated with the internet were continuing to soar, aided by very optimistic analyst forecasts. The economy was also very strong. In February 2009, stocks were continuing to plunge, the global economy was shrinking and attempts to stabilize the financial sector had yet to instill confidence that they would work. The AAII Sentiment Survey readings reflected individual investors’ attitudes in reaction to those periods and other market and economic headlines.
Though not causal, there is a long-running link between sentiment reaching unusual levels and the market changing direction. This is something we and others have observed by analyzing our survey data. A small amount of statistical analysis will help you understand what to look for and why.
The majority of weekly readings fall within a normal range of distributions. Mathematically, this is the range that 68.2% of the observations within a given set of data fall into. In our survey, the normal distribution range for bullish sentiment is currently 27.4% to 47.7%. Neutral sentiment’s typical range is 23.2% to 39.6%. Bearish sentiment typically falls between 21.3% and 40.9%.
Readings outside of these ranges are unusual, meaning they are more than one standard deviation from the mean (outside of the normal distribution). Such readings from the AAII Sentiment Survey imply that bullish, neutral or bearish attitudes among individual investors are at an unusually high or low level.
The long history of the AAII Sentiment Survey has provided plenty of data to examine what happens following a certain type of reading. Our internal analysis has shown that contrarian investors should take interest in readings that are unusually high or low.
While the financier Baron Rothschild has been credited as saying “The time to buy is when there’s blood on the streets,” we’ve found that it makes more sense to buy when optimism is low as opposed to when fear is high. The large-cap S&P 500 has tended to realize stronger returns after bullish sentiment is unusually low than when pessimism is unusually high, as Table 2 shows.
Between July 1987 and December 2022, the S&P 500 has realized an average six-month gain of 6.6% following an unusually low bullish reading in the AAII Sentiment Survey. The median gain over the same period is 6.7%. When bearish sentiment has been unusually high, the S&P 500 has realized average and median six-month gains of 5.3% and 6.0%, respectively. The S&P 500 has an average gain of 4.5% and median gain of 5.3% over all rolling six-month periods.
The link between sentiment and market performance exists at 12 months too. The S&P 500 has realized average and median 12-month returns of 14.3% and 16.2%, respectively, following an unusually low bullish sentiment reading. Following an unusually high bearish sentiment reading, the average and median 12-month returns for the index have been 10.6% and 14.3%, respectively. The S&P 500 has an average gain of 9.6% and a median gain of 11.1% over all rolling 12-month periods.
One potential explanation is a lack of buyers. When investors are not optimistic about the prospects for stocks, they are less likely to buy them. This, in turn, causes valuations to drop and makes stocks more attractively priced. The opposite occurs when optimism is high: buyers are abundant and drive up valuations. The S&P 500 has historically underperformed when bullish sentiment is unusually high.
The combination suggests using unusual levels of bullish sentiment to determine if rebalancing is needed, whether opportunities to invest at bargain prices exist or if stocks you currently hold are meeting any valuation-based sell rules.
AAII members, like yourself, can vote in the survey each week (if logged in) either directly on the AAII home page or on the AAII Sentiment Survey page.
The latest survey results are updated every Thursday morning. Insights about the latest results, plus a downloadable spreadsheet with the complete history, are posted to the Sentiment Survey page later the same day. You can also receive the commentary by subscribing to the weekly AAII Investor Update newsletter, a free benefit to members.
Trading Strategies


No comments have been added yet. Add your thoughts to the discussion!
You need to log in as a registered AAII user before commenting.
Log InCreate an account