

Related

Investor Professor
Online Exclusive: Market Breadth's Meaning for Individual Investors


Stock Strategies
As of the end of August 2023, the S&P 500 index was trading with a price-earnings ratio of 25.7.

Charles Rotblut leads a class in AAII's new Essential Investing Video Course. Go to https://www.aaii.com/ves for more information and to subscribe.
As of the end of August 2023, the S&P 500 index was trading with a price-earnings (P/E) ratio of 25.7.
Valuations can be looked at both on an absolute and a relative basis. Absolute numbers state an investment’s intrinsic value at a given point in time. The advantage of absolute valuations is that they can be used to draw hard lines between what is priced cheaply, fairly or expensively. A price-earnings ratio above a certain level—say 30—could be considered expensive, for instance. The downside is that judging absolute valuations can be subjective, depending on where the dividing lines between the three tiers are drawn.
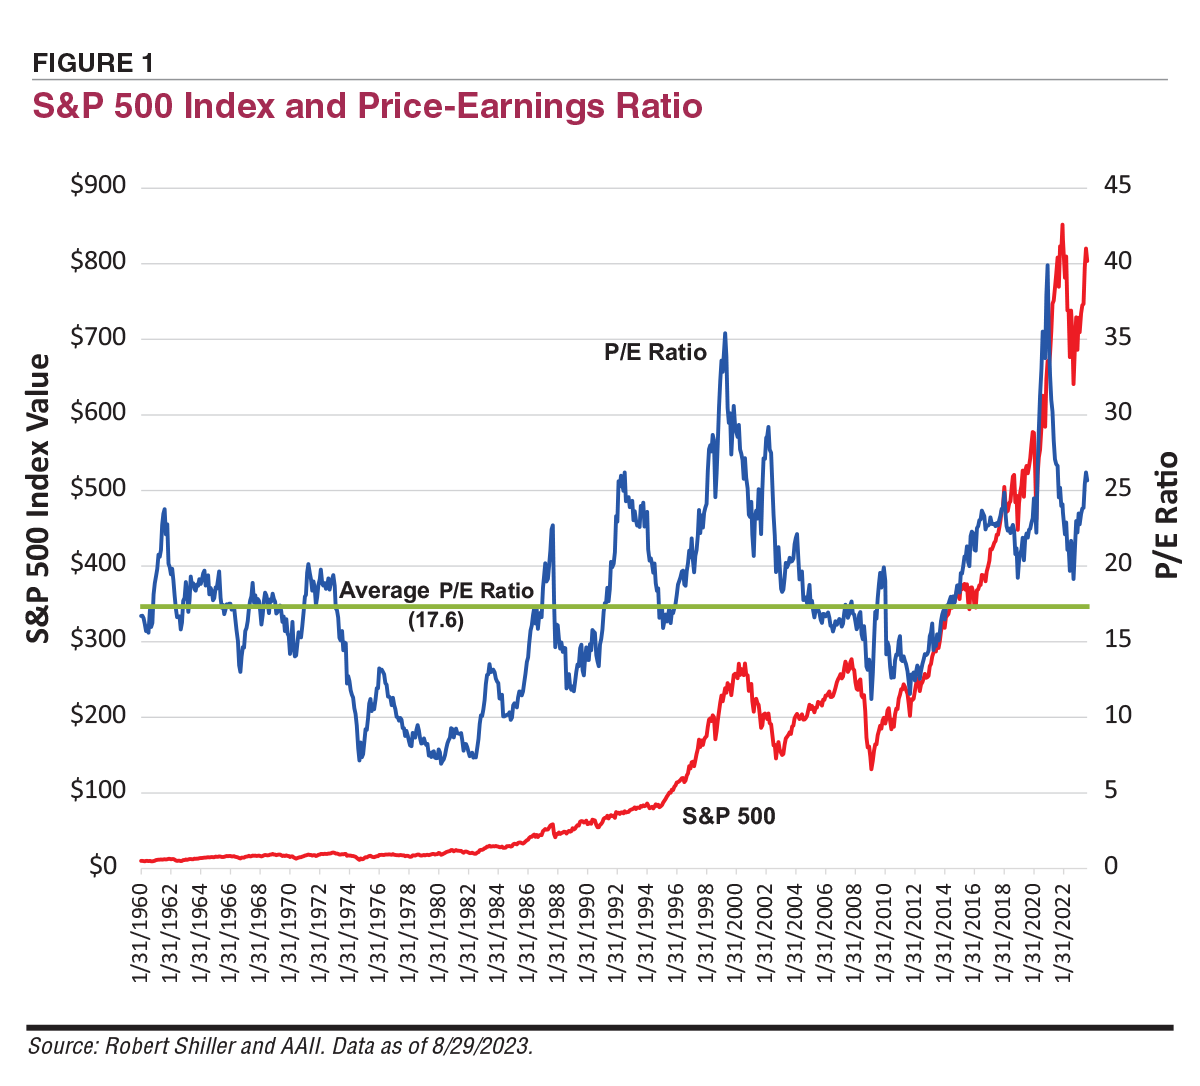
Relative valuations compare an asset’s current valuation to a metric or benchmark. An investor can seek price-earnings ratios ranking in the cheapest 20% or 40% of all stocks. Alternatively, an investor may compare current valuations to historical valuations. Figure 1 below does the latter. It shows how the S&P 500’s current month-end price-earnings ratio compares to its month-end price-earnings ratios over the past 60 years (blue line).
The S&P 500’s valuation at the end of August ranked in the highest 6% of all its price-earnings ratios over the last six decades. The only periods when the current valuation was exceeded were 1992, 1999, 2002 and the start of the 2020s.
Above-historical-average valuations have been a trend for the S&P 500 since 2014. During this time, the large-cap index consistently traded with a price-earnings ratio above its historical average of 17.6 Notably, there hasn’t been a specific valuation level where the S&P 500 has fallen to after having reached a high.
This still does not change the fact that the S&P 500’s current price-earnings level is high on a historical basis. Whether it can sustain its current level will depend on investors’ expectations for future earnings and if those expectations are met.
While historical valuations provide a gauge, other measures should be considered. The greater weighting within the index toward “asset-light” companies (e.g., technology companies) with lower depreciation expenses influences valuations, for example. Economic trends, the interest rate environment and investor sentiment are among the many other factors influencing whether valuations are high or low on a historical basis.
Investor Professor
Stock Strategies

RANDALL L from CA posted over 3 years ago:
JOHN L from NJ posted over 3 years ago:
You need to log in as a registered AAII user before commenting.
Log InCreate an account