

Related

Portfolio Strategies
The 4% rule doesn’t guarantee safety, but combined with some judgment and adaptation based on market conditions, it gives a very high likelihood of success.

The 4% safe portfolio withdrawal rate is practically gospel in personal finance, and for good reason. It claims to answer one of life’s most pressing questions: How much money does one need to be able to retire?
If the 4% rule is correct, the answer is simple. One needs 25 times their annual living expenses invested in a reasonably diversified portfolio of stocks and bonds that is annually rebalanced.
According to the research, even someone who retired at the worst possible time in the past 95+ years would have been able to take enough money out of their portfolio to pay their annual living expenses in the first year of retirement, then take out an inflation-adjusted amount in every successive year for 30 years and not run out of money. Like many rules of thumb, the 4% rule is as powerfully simple as it is incomplete.
Here are eight questions that have puzzled me over the years as I’ve validated and applied the rule in my own retirement.
1. How safe is safe enough? If the safe withdrawal rate is set by the worst sequence of returns in recent history, what’s to say a longer history wouldn’t have had an even worse sequence?
2. How realistic is it to assume that retirees will follow the rule strictly, adjusting for inflation every year but not adjusting for market conditions?
3. What is so magical about account balances on the day someone retires? If the market drops by 30% the month before they retire, does that mean they should live on 30% less throughout retirement?
4. Why is there no room for midcourse adjustment? If the market performs well for the first five years of retirement, and a retiree finds their account is now worth twice what it was at retirement (even after adjusting for inflation), shouldn’t they be able to increase their withdrawals accordingly?
5. Shouldn’t older retirees use a higher withdrawal rate since they have fewer years to live?
6. Why not use a truly safe approach and take out a percentage of the portfolio annually? Yes, the inflation-adjusted value of the withdrawals would fluctuate, but there’s no way to drive a portfolio to zero when only taking out a percentage of it.
7. How much do portfolio allocations to stocks and bonds, as well as allocations to small-cap and value stocks, impact what can safely be withdrawn?
8. Which portfolio withdrawal strategies have historically delivered the highest retirement income and legacy balances?
William Bengen first devised the 4% safe withdrawal rate by analyzing diversified stock and bond portfolio returns for every start year between 1926 and 1976. The worst scenario in those 50 years set the number. Since the analysis only included 50 starting dates, we could conclude that the worst case represents a 1-in-50 chance, or 2% risk, of failing. A longer history might have shown an even lower safe withdrawal rate. Interestingly, we haven’t seen anything worse in the years since Bengen’s original research. In fact, the worst safe withdrawal rate for a 60% stock/40% bond portfolio of S&P 500 index stocks and short-term U.S. government bonds between 1977 and 1993 is over 6%. Maybe the 50 years Bengen analyzed were particularly unlucky? Or maybe the years since have been unusually lucky? There’s no way to know.
Future returns are unpredictable. They could be better or worse than the past 100 years. Does that mean the 4% guideline isn’t safe? If by safe, one means guaranteed to work, then we’d have to say it isn’t. Life is uncertain, and investing, by nature, involves some risk. If by safe, one means very likely to work and a prudent starting point, then yes, it’s safe. The 4% guideline is not guaranteed, but it’s very conservative and has been independently validated many times over 95+ years of history.
The 4% fixed safe withdrawal rate assumes that the annual withdrawal amount is set at retirement and then adjusted for inflation in succeeding years, so that withdrawal purchasing power remains constant throughout retirement. It sounds reassuring, but would anyone actually do it?
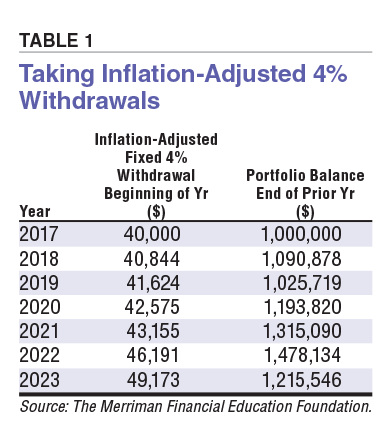
Take, for example, someone who retired in January 2017 with $1 million invested in a 60%/40% portfolio. The 4% guideline suggests they could take out $40,000 to live on in year one. The following January, they need to know the reported inflation for most of 2017 to calculate their next withdrawal. They calculate that they should take out $40,844 in 2018. In subsequent years, they’d do the same calculation and get the sequence of withdrawals as shown in Table 1.
As skeptical as I am that many people would run the numbers, I’m even more skeptical that they would ignore the world around them as well as their account balance while blindly following the strategy, diligently rebalancing every year. Would they have ignored the global pandemic in 2020 and stuck to the plan? We know that individual savings rates spiked to over 30% in April 2020, and I suspect many retirees were among those who their curtailed spending.
Investors who rely on the 4% safe withdrawal rate will likely apply judgment to adjust up or down in any given year. Retirees who see their nest eggs grow substantially may wonder if they can’t reset their 4% withdrawals to a higher amount based on their bigger nest eggs.
If the market drops by 30% the month before someone retires, does that mean they should live on 30% less throughout retirement?
Imagine financial “twin” sisters who are the same age and have the same-sized nest eggs invested in the same portfolios. One retires right before the market crashes and takes her first 4% withdrawal while the other retires right after the crash with a 30% smaller nest egg. If it’s “safe” for the early sister to withdraw 4% of the larger amount, isn’t it equally “safe” for the later retiring sister to withdraw the same amount even though it’s 5.7% of her reduced portfolio value? The only difference between them is that the early retiree’s portfolio is 1% larger since she converted 4% to cash before the market dropped and didn’t experience the 30% loss on that 4%. Even adjusting for that, it seems like the late-retiring sister could withdraw 4% of 99% of the early-retiring sister’s withdrawal amount.
Practically speaking, both sisters would be equally safe withdrawing the same dollar amount since they have the same portfolio asset allocations, the same-sized nest eggs (within 1%) and will experience the same sequence of returns. The important thing to remember is that neither is guaranteed to not run out of money because we don’t know what future returns will be.
Both sisters may want to consider the market drop as they decide how much to withdraw. The first sister might consider withdrawing a little less than 4% to offset her lucky timing, while the second might consider withdrawing a little more than 4% to compensate for her unlucky timing.
If the market performs well for the first five years of retirement and a retiree finds their account is now worth twice what it was at retirement, even after adjusting for inflation, shouldn’t they be able to increase their withdrawals accordingly?
The methodology used to develop the 4% rule suggests that ratcheting withdrawals up as a portfolio grows would be fine. If the portfolio has doubled in value, adjusting the withdrawals to the new balance seems justified by the backtesting. The retiree now has fewer years to live than they did when they retired, and they would have set their initial withdrawal rate based on the higher balance had they retired later.
The tricky part is that none of us knows how long we’ll live. The 4% safe withdrawal guideline was based on a 30-year retirement. What if we live longer and need our money to last 35 or 40 years?
Since the safe withdrawal rate was chosen to be safe for 30 years, ratcheting withdrawals up based on increased balances always worked within 30 years in the backtests. However, it increased the likelihood of running out of money within 40 years. At that longer time horizon, a fixed 4% withdrawal rate without ratcheting ran out of money 5% of the time while a fixed 4% withdrawal rate with ratcheting ran out of money 17% of the time. The lesson is simple. In the face of uncertain returns (the 10 years not included in the 30-year safe withdrawal backtests), taking out more money means taking more risk.
A prudent alternative might be to switch to a 5% flexible withdrawal strategy, which we’ll discuss in question 6.
A friend once complained that “all of your suggested investing approaches have me die with too much money.” I replied by saying, “We can fix that if you tell me when you’re going to die.”
Older retirees should be able to withdraw a higher percentage per year since they are likely to live fewer years. In Bengen’s original research, he found that almost 5% was a safe withdrawal rate for a 20-year retirement. The challenge is knowing what duration to use. Does an 85-year-old retiree assume they will only live five years, 10 years, 20 years? We could look at actuarial tables to estimate remaining life expectancy, but it’s just an estimate, and our remaining life expectancy increases every year we live up to a certain point.
The U.S. government has dealt with this challenge in its required minimum distribution (RMD) tables. These prescribe a variable withdrawal percentage that increases with age. They are designed to leave smaller end balances while never running out of money. The problem most investors would have in using the RMD tables for their retirement withdrawals is that they would take their largest withdrawals in the final years. Barring extreme end-of-life medical expenses, this is unlikely to be when most retirees need or want to spend the most.
So, yes, older retirees can prudently withdraw more. However, a flexible withdrawal strategy may be better if the motive is primarily to spend and/or gift more while alive than dead. We’ll cover that next.
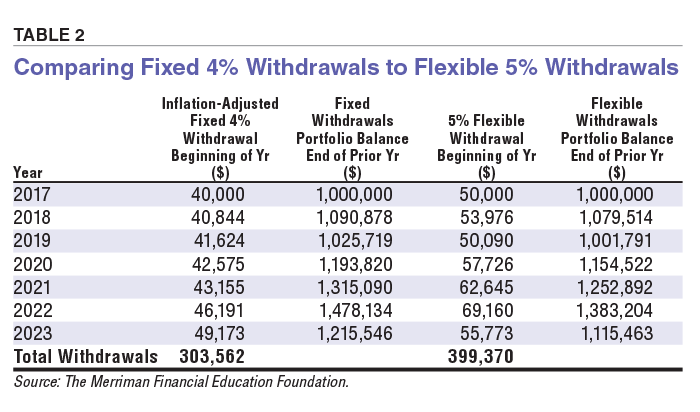
The only truly safe way to never run out of money is to take flexible withdrawals. Flexible withdrawals are made by withdrawing a percentage of the portfolio every year. There is no withdrawal amount set at retirement and no need to figure out how much inflation there’s been. Instead, we just multiply the balance of our portfolio by the flexible withdrawal percentage and withdraw that amount. Since the remaining balance is a percentage of the starting balance, it can never go to zero. Let’s assume a 5% flexible withdrawal and add it to the table we generated previously. The results are shown in Table 2.
There are some obvious advantages and disadvantages to this approach. On the plus side, backtesting suggests retirees can take a larger flexible percentage (e.g., 5% flexible versus 4% fixed) every year while maintaining their average real spending power over time. On the minus side, annual withdrawal amounts fluctuate with the portfolio’s value. In February 2009, the 60%/40% portfolio was down 28% from its peak. That was a substantial pay cut for someone who retired at the market peak in 2007. It suggests investors should over-save by 40% or more to comfortably use a flexible withdrawal approach.
Although flexible withdrawals have uncertain purchasing power throughout retirement, for a 60%/40% portfolio using 5% withdrawals, the probability of the balance being below the initial balance decreases over time. You can see this in Table 2. Even though 2022 was a difficult year for the 60%/40% portfolio, the 2023 flexible withdrawal is still higher than the initial $50,000 withdrawal. And, if we adjust for inflation, the 2023 withdrawal of $55,773 is worth $40,855 in 2017 dollars, which is still more than the inflation-adjusted 4% withdrawal. Investors who use a flexible withdrawal approach need to be comfortable with fluctuations in withdrawal purchasing power.
I’ve focused on the 60%/40% portfolio because backtesting shows that safe withdrawal rates have been highest for portfolios with between 50% and 75% equities. Portfolios with less allocated to equities haven’t grown fast enough to support higher safe withdrawal rates. Meanwhile, portfolios with more allocated to equities have gone through long down-market periods, causing them to be exhausted at higher withdrawal rates.
What’s less well known is that the highest safe withdrawal rates have come from even more diversified portfolios that include an allocation to small-cap value stocks. For example, a 60%/40% portfolio in which the 60% equities are split half and half between U.S. small-cap value stocks and the S&P 500 had a safe withdrawal rate of 4.4%.
Why would adding small-cap value increase safe withdrawal rates? The reason is that small and value stocks tend to do well under different market conditions than large growth stocks or U.S. government bonds. They also have higher expected returns. This produces better performance over a broader range of market conditions, greater resilience to challenging sequences of returns and higher safe withdrawal rates.
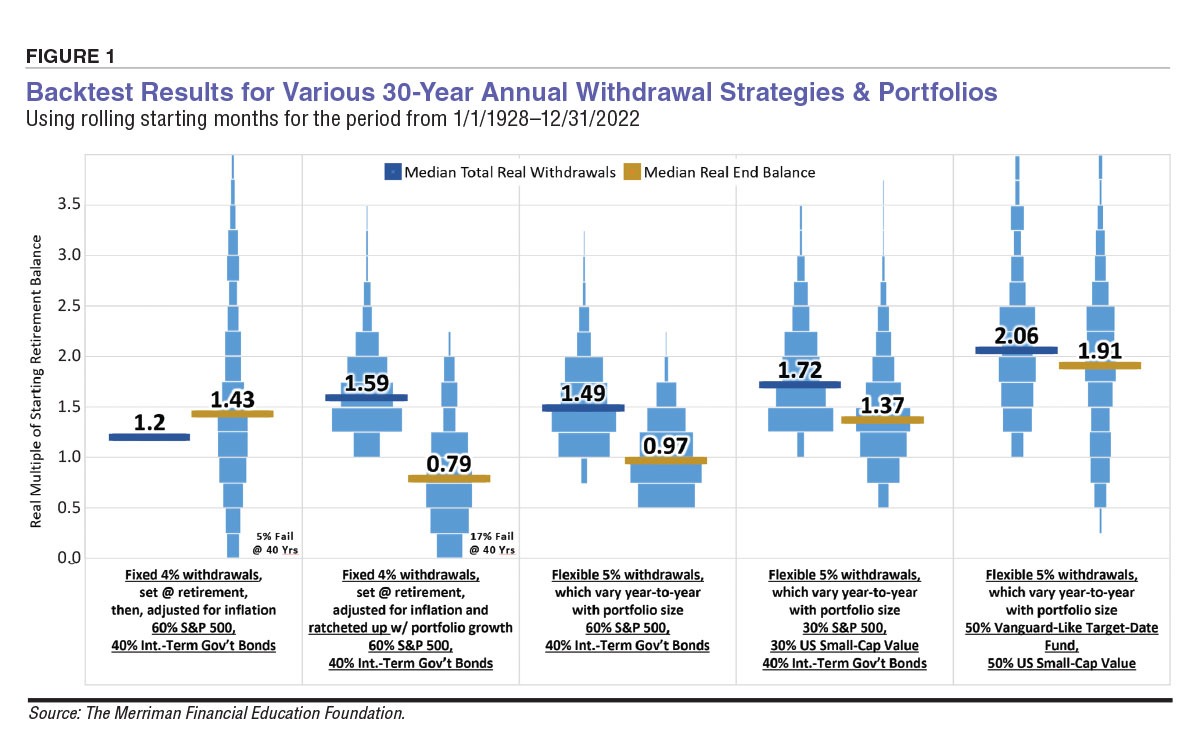
So far, we’ve focused on not running out of money. Withdrawal strategies and portfolio asset allocations also profoundly affect how much we can spend in retirement and how much we will pass on when we die. Figure 1 summarizes 30-year retirement withdrawal backtests for every starting month since 1928. It also includes the percentages of scenarios that failed (ran out of money) at 40 years. The vertical axis expresses performance as a real (inflation-adjusted) multiple of the starting retirement balance. The blue bars represent the distribution of results for all 1,140 periods tested.
The left-most scenario is a fixed 4% withdrawal rate using a traditional 60%/40% S&P 500 and intermediate-term U.S. government bond portfolio. Since real withdrawals are 4% times 30 years and inflation-adjusted, they always equaled 1.2 times the starting balance. Ending balances, in contrast, ranged widely from practically zero to more than 3.5 times the starting balance. The median ending balance was 1.43 times the starting balance. This shows how the fixed maximum safe withdrawal approach sacrifices the predictability of the end balance for the predictability of the 30-year withdrawals. Perhaps surprisingly, this approach only ran out of money 5% of the time at 40 years.
The second scenario from the left is the same as the first, except it ratchets up the withdrawal amount when the portfolio increases in value. This increased the median real withdrawals to 1.59 times the starting balance, or a 33% increase over the non-ratcheted approach. It also reduced the real end balance to 79% of the starting balance and increased the 40-year failure rate to 17%.
The next three scenarios use 5% flexible withdrawal approaches and never fail.
The middle scenario uses the same 60%/40% S&P 500 stocks and intermediate-term U.S. government bonds portfolio of the first two. Although the total of the median real withdrawals and end balance is not as great as the prior two scenarios, the range of outcomes is more controlled. Median withdrawals and end balance came in at 1.49 and 0.97 times the starting portfolio balance, respectively, which fits many retirees’ desires to enjoy more of their wealth while alive.
The fourth scenario from the left uses a 5% flexible withdrawal strategy with a 60%/40% portfolio in which the equity portion is split equally between S&P 500 stocks and U.S. small-cap value stocks. Even though the portfolio still has 40% in bonds, it produced median total real withdrawals of 1.72 times the starting balance while delivering a respectable real median end balance 37% greater than the start.
The fifth and final scenario is a 50%/50% combination of a Vanguard-like target-date fund and a U.S. small-cap value stock fund. The target-date fund has a bond allocation that increases from 50% to 70% in the first seven years of retirement. When combined half and half with U.S. small-cap value, the bond allocation averages 34% over the 30-year retirement. That’s the lowest bond allocation of all scenarios and helps explain why this had the highest median real withdrawal multiple (2.06) and end-balance multiple (1.91). Adding equities and small-cap value increased returns, but it also increased the range of results. This is something retirees with higher equity exposures should be aware of. Although expected returns are higher, the range of possible outcomes is greater too.
The biggest challenge in determining safe withdrawal rates is that we don’t know the scenario we’re optimizing. We don’t know how long we’ll live or the sequence of returns our portfolio will experience. In the face of those uncertainties, the best we can do is look at what’s worked in the past. The 4% fixed safe withdrawal rate comes from that analysis and is a conservative and prudent starting point.
Following the 4% fixed safe withdrawal rate doesn’t guarantee safety, but it puts us on a path with a very high likelihood of success. Combined with some judgment and adaptation based on market conditions, it will serve most investors extremely well.
For investors who have over-saved, a flexible distribution strategy provides a way to guarantee that their withdrawals won’t exhaust their accounts in exchange for some year-to-year spending-power uncertainty. Investors willing to diversify further can improve their safe withdrawal rate by allocating a portion of their portfolio to small-cap value. Doing so will likely also increase the amount they can spend in retirement and the amount they can leave to heirs or charities.
We have more information on distribution rates at https://paulmerriman.com (click on Best Advice and then select Distributions from the drop-down menu). You’ll see a collection of distribution tables showing how fixed-distribution and flexible-distribution approaches of varying amounts have worked in the past with different asset allocations.
Portfolio Strategies

Portfolio Strategies

Portfolio Strategies

MICHAEL S from WA posted over 2 years ago:
JOHN W from NC posted over 2 years ago:
ROBERT A from NC posted over 2 years ago:
JOHN L from NJ posted over 2 years ago:
BARRY J from TX posted over 2 years ago:
DAVID H from NV posted over 2 years ago:
Chris P from CA posted over 2 years ago:
KENNETH D from SC posted over 2 years ago:
BARRY J from TX posted over 2 years ago:
ERIC B from MN posted over 2 years ago:
JAMES M from MT posted over 2 years ago:
Don P from USA posted over 2 years ago:
J M from NJ posted over 2 years ago:
David E from MD posted over 2 years ago:
You need to log in as a registered AAII user before commenting.
Log InCreate an account