

Related

Computerized Investing
by Walter H. Weil | June 2017

I am a contrarian investor and risk-averse.
To me, the hedge fund concept has appeal because it is intended to outperform a benchmark, usually the S&P 500 index, with less risk than a straightforward investment in that index. Hedge funds can borrow and short [sell a borrowed security in anticipation of buying it back at a lower price]. I started in the hedge fund business in 1968 and did mostly hedged investing until I retired in 1995.
There are two major approaches to managing a hedge fund: the micro or bottom-up style and the macro or top-down one. The first involves looking for undervalued individual stocks and lowering the overall stock exposure when there are only a few attractive stocks around. The second starts with the decision as to whether to be in stocks at all compared to bonds or cash equivalents. My approach has been top-down.
Since retiring, I have managed my family’s money with the same top-down method, but with several important differences: 1) I don’t borrow; 2) I don’t short; and 3) I no longer pick individual stocks. Rather, I now rely on low-cost, no-load mutual funds or exchange-traded funds (ETFs) that track the movement of the S&P 500.
The transition from active hedge fund manager to more passive individual investor has its advantages. I no longer have to worry about short-term performance. (I’m a lousy trader!) My preferred investment horizon is five to 10 years, not five to 10 months. Now I can bide my time and wait for “the fat pitch across the center of the plate.”
As you might expect, given my hedge fund experience, I am not limited to the traditional 60% stock/40% bond asset allocation model that most investment management firms espouse. Rather than being restricted to investing in just stocks and bonds, I consider cash to be a third asset category. There have been many consecutive years when I have had all of my financial assets in fixed income, and, recently, years when I have had no bonds and all assets in equity and cash. Anticipated relative value among these three financial asset classes determines the percentage I hold in each.
So now I manage money in a way that AAII members could. AAII asked me to discuss how I go about it. One caveat: Successful contrarian investing requires discipline, extreme patience and a contrarian streak. It can be very lonely, even scary. Contrarian investing is not for everyone.
Also, note that this discussion is more relevant for tax-free accounts such as retirement and endowment funds, where transactions are not taxable events.
My observations gleaned from a half-century of contrarian investing start with demographics.
In August 2011, the Federal Reserve Board of San Francisco published a letter entitled “Boomer Retirement: Headwinds for U. S. Equity Markets?” written by Zheng Liu and Mark M. Spiegel. The authors showed how the movement of the baby boomers through their life cycles would impact the S&P 500’s price-earnings (P/E) ratio. They measured the relationship over time between two population groups: the middle-aged 40–49 year olds (“M”) and the old-aged 60–69 year olds (“O”). Their hypothesis was that, as the boomers phased out of their work lives into retirement, equity values would be negatively affected—that as the M/O ratio declined, so would the P/E ratio.
Their study spanned from 1954 to 2010. The results were significant. As Liu and Spiegel put it, “In our model, we obtain a statistically and economically significant estimate of the relationship between the P/E and M/O ratios. We estimate that the M/O ratio explains about 61% of the movements in the P/E ratio during the sample period. In other words, the M/O ratio predicts long-run trends in the P/E ratio well.”
From 1993 to the early 2000s, when P/E ratios rose to all-time highs, the M/O ratio was rising sharply as well. Since then, the M/O has fallen and will do so until 2025. So demographics won’t provide a tailwind for price-earnings ratios during this period, but rather a significant headwind.
Interest rates affect price-earnings ratios, the cost of capital and the interest expense that appears in income statements. The Federal Reserve Board determines short-term interest rates (the federal funds rate)—and recently even long-term rates through quantitative easing.
There was an “echo recession” in the late 1930s following the Great Depression. To avoid repeating that episode and knowing that demographics would be a negative, Federal Reserve Board Chair Ben Bernanke and later Fed Chair Janet Yellen realized that a heavy dose of monetary policy was needed. They adopted a zero-percent fed funds rate policy (ZIRP) and kept it in place for seven years. ZIRP is largely responsible for the ensuing bull markets in stocks and bonds. That’s the good news. The bad news is that I view both stocks and bonds as being overvalued now as I write this in April 2017.
Average (mean) price-earnings ratios and interest rates, over long periods of time, are important in evaluating whether stocks and bonds are at fair value, overvalued or undervalued.
The S&P 500 price-earnings ratio that I use is Yale professor Robert Shiller’s CAPE ratio, which stands for “cyclically adjusted price-earnings” ratio. Shiller recognizes that there is a profit margin cycle that accompanies a business cycle, causing earnings to fluctuate often dramatically around a long-term earnings trendline. By averaging earnings over a 10-year period, he smooths out the impact of this cyclicality. Using his CAPE ratio, the investor avoids applying an average price-earnings ratio to peak earnings and thus buying at the high.
Shiller’s average CAPE ratio over the last approximately 145 years is 16.8. I prefer to use the average CAPE ratio over the last 50 years, which is 19.8—reflective of a more advanced economy. Many years can pass when this ratio remains higher than the average and vice versa.
Many investors denigrate the CAPE ratio because, had they waited until the CAPE ratio reverted to its mean before buying the S&P 500, they would have missed the entire bull market from 2002 to 2007. To me, these critics don’t understand CAPE’s real usefulness. It provides a measure of how overvalued or undervalued the index is, which is necessary in determining what percentage of financial assets should be invested there.
Since reversion to the mean doesn’t happen that often, an important consideration is how long before it will next happen. The last time the CAPE ratio reverted to its average was during the 2007–2009 recession. The next time will probably be during the next recession, though it’s hard to predict when that will occur. Please note that the bull market high in late 2007 occurred at the same time that the Great Recession began. Few on Wall Street had predicted a recession was then at hand.
Over the last 50 years, the nominal yield on the 10-year U.S. Treasury note averaged 6.4%. ZIRP has resulted in the note yield falling to roughly 1.3% in 2012. It is 2.3% now (as of April 2017). A reversion to the mean will ultimately occur, but, again, it’s hard to predict when.
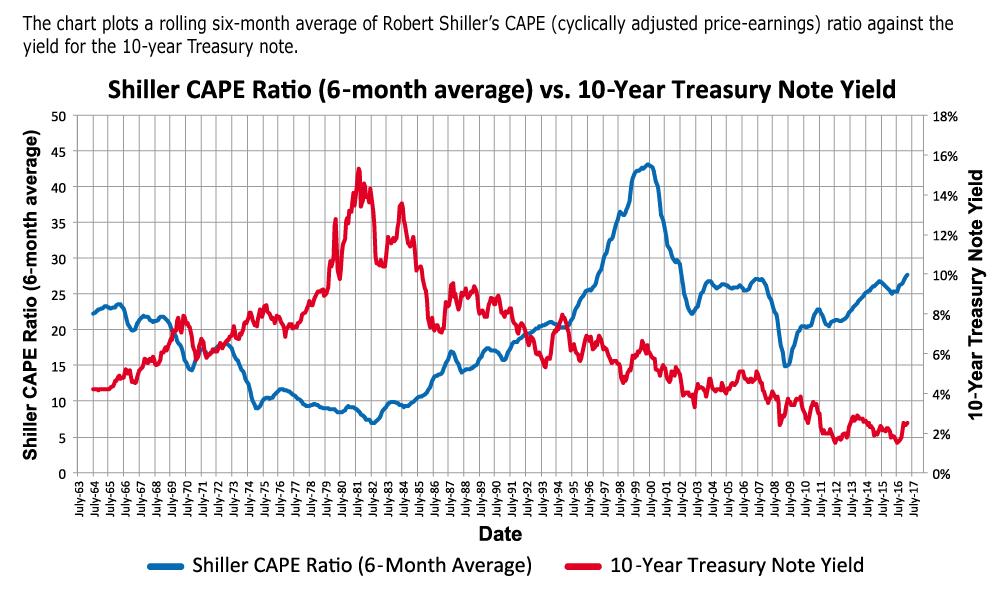
One theory of investment valuation, the dividend discount model, asserts that fair value for a stock is the sum of future dividends discounted to the present. The discount rate used is a function of current interest rates. The higher the interest rate, the lower the present value. [The present value of a $100 dividend paid a year from now is $95.24 with a discount rate of 5%; with a discount rate of 10%, the present value is $90.91. The present value is the dollar amount you would have to invest today at a given rate of return to realize a certain amount of wealth in the future—also known as the future value. Put another way, investing $95.24 at a 5% rate of return for one year will give you $100.] According to this model, the level of interest rates should be an important determinant of the S&P 500’s CAPE ratio. Higher interest rates should be accompanied by lower CAPE ratios, and vice versa. There should be a significant negative correlation between interest rates and CAPE ratios.
To test the effect of interest rates on the CAPE ratio, I have superimposed a chart of the 10-year note yield onto the chart of the CAPE ratio over more than 50 years in Figure 1.
Table 1 shows the correlations between the CAPE ratio and bond yields. A perfect negative correlation (coefficient) is minus 1.00, meaning they move in completely opposite directions. (As the yields rise, the CAPE ratio falls, and vice versa.) Over the entire period tested, the correlation is –0.64, a relationship considered to be significantly, but not fully, inverse by statisticians. From 1964 to 1993, the correlation is –0.81—a highly significant number. From 1993 to the present, the correlation is 0.36—not significant. What happened?
In the early 1990s, baby boomers realized that they were underinvested for their retirements. Equities were considered the preferred asset class. Inflows into equity mutual funds mushroomed, driving the CAPE ratio to its all-time high of 44 in 2000. From that level CAPE declined while interest rates continued downward—hence the positive correlation.
Table 1. Correlation between the CAPE Ratio and 10-Year Treasury Yields
| Date | Correlation |
|---|---|
| 7/1/1964 – 3/1/2017 | –0.64 |
| 7/1/1964 – 7/1/1993 | –0.81 |
| 7/1/1993 – 3/1/2017 | 0.36 |
As a contrarian, I tend to sell when there is an extreme of bullishness and buy when there is an extreme of bearishness. I have found the most reliable sentiment indicator over many decades to be the U.S. Advisors Sentiment Report published by Investors Intelligence. (An annual subscription to the report costs $335; an alternative, but different, indicator is AAII’s Sentiment Survey).
For over 50 years, Investors Intelligence has analyzed weekly over a hundred independent financial market newsletters and categorized each writer’s outlook for the stock market as bullish, bearish or expecting a correction. Rarely do these numbers have predictive value—they’re just noise. At extreme levels, however, they do have significance. Since we are now in a bull market and want to know when to reduce our equity exposure, we should be looking for an extremely high percentage of bulls and an extremely low percentage of bears. To me, the combination of 60% or higher bulls and 20% or lower bears defines “extreme.”
Over more than a quarter of a century there have been only a half-dozen instances of this extreme. And following these incidents, the average appreciation of the S&P 500 a year later has been subpar. However, this performance is dominated by one observation—in December 2007, this indicator nailed a bull market top. A year later the S&P 500 was down 39%. Of late, there have been false positives. One false positive at the end of 2013 prompted me to rebalance my portfolio, which turned out to be a big mistake. I now consider this sentiment indicator to be a necessary condition for action, but not a sufficient one.
Rebalancing results in “buying low and selling high.” Shiller’s CAPE ratio provides a reliable methodology for valuing the S&P 500. So rather than rebalancing periodically, like once a year, I rebalance as the S&P 500 gets more overvalued. I have arbitrarily decided to do so with every 10 percentage points more of overvaluation.
When the S&P 500 briefly reached 2400 in early March, it was 80% overvalued according to Shiller (50% overvalued using my adjusted average CAPE ratio). I rebalanced, and the proceeds went into cash since bonds are also significantly overvalued. Next stop: 90% overvalued, if it happens.
Wall Streeters, in aggregate, are far more highly compensated during bull markets than bear markets. As a result, the industry has a bullish bias. It tends to inflate earnings estimates with the result that the market appears undervalued almost all of the time. (I can’t recall when the consensus estimate for the following year was for an earnings decline.)
Furthermore, Wall Street has a substantial bias against cash. Once I heard a guru say that a large cash position was a sin. Why?
When the S&P 500 is selling at its average CAPE ratio, its expected compound annual return is 8% to 9%: 6% to 7% from earnings growth and 2% from dividend yield. The 10-year U.S. Treasury note yield has averaged 6.4%, albeit with less risk than the index. Treasury bills yield even less, but with almost no risk. Almost always, the S&P 500 outperforms U.S. Treasury fixed income.
However, in late December 1999, a rarity occurred. The S&P 500 was more than 100% overvalued; in addition, zero-coupon Treasury securities, from five- to 25-year maturities, were yielding 6% to 7%. According to my analysis at that time, if the index’s price-earnings ratio reverted to its mean at any time before each of those five-year intervals, the Treasury notes and bonds would outperform the S&P 500! At that time, the S&P 500 was 1435. Table 2 shows the results of my study.
Table 2. Analysis of Future Returns Based on 1999 Valuations
| The below analysis, conducted in 1999, shows the potential returns the S&P 500 would realize should its valuation revert back to average levels at any time before each of the five-year intervals. The S&P 500 returns include reinvested dividends. Zero-coupon Treasuries with maturities ranging between five- to 25-year maturities were used. | ||
| S&P 500 Reverts to Average Valuation | Expected Annualized Return (%) | Yield to Maturity for Zero-Coupon Treasuries (%) |
|---|---|---|
| 2004 | -3.3 | 6.2 |
| 2009 | 2.5 | 6.5 |
| 2014 | 4.4 | 6.7 |
| 2019 | 5.4 | 6.5 |
| 2024 | 5.9 | 6.4 |
In March 2017, the S&P 500 reached 2400. Since my study 17 years ago, the index has appreciated at a compound 3.1% rate. Add two percentage points for reinvested dividends and the total compound annual return has been a mere 5.1%—in line with my expectation shown in the table. The bond with that maturity yielded 6.6% at the time of my study—a 29% higher return with less risk.
Fortunately, I “ate my own cooking” and invested in Treasury notes and bills from 2000 until I bought an outsized position in the S&P 500 toward the end of the 2007–2009 bear market. (Although I was early, the results have been good.) Since then, I have been reducing my outsized equity exposure down to my benchmark allocation of 30%. (I am 77 years old.) I was too early in this rebalancing effort but have since maintained my 30% equity exposure. As the S&P 500 becomes more overvalued, I have rebalanced back to 30%. The proceeds go into Treasury bills since my outlook for bonds is negative. I await much higher interest rates before shifting to longer-duration Treasury notes.
Given this, some of you may wonder how I, as a contrarian, view the market now. The following observations are intended to show you what I look at, rather than give a forecast of what will happen.
Given this, there are four choices an investor can make:
Whenever stock valuations revert to their historical average (using my adjusted mean CAPE ratio), I would significantly add to my index position.
Computerized Investing

Trading Strategies

Stock Strategies

James C from SD posted over 8 years ago:
Vance Swanson from MN posted over 8 years ago:
Steve Peters from CA posted over 8 years ago:
Cliff Breslow from NV posted over 8 years ago:
Mike from VA posted over 8 years ago:
You need to log in as a registered AAII user before commenting.
Log InCreate an account