

Related

First Cut Stocks

Imagine that you could rewind time to age 20. What investing lessons do you wish the 20-year old version of yourself knew at the time?
This is an important question to ask as a new generation starts their investing careers. For younger investors, learning the key points of a successful investing plan can mean the difference between a comfortable retirement and an exemplary one.
We tend to leave high school and college woefully undereducated on the topics of money and investing, but I think that convincing young people of three key lessons early on is a great place to start. Young investors can achieve impressive results if they learn to:
This article will explore each of these three lessons, with an emphasis on building a unique portfolio using AAII’s Stock Investor Pro fundamental stock screening and research database program.
As I write this, I am 29 years old. My age cohort—the millennial generation born between 1980 and 2000—faces obstacles that did not threaten our parents or grandparents. The main problem is that as a country we are getting older while at the same time taking on more debt. An aging global population—and the commensurate burden on governments to support that population—means that millennials may have to be more financially self-reliant than their parents.
Here are some concerning trends that should make millennials take notice. The personal savings rate has fallen over the decades, from 12.2% in 1967 to 5.4% in 2014. At the same time, the American government has spent a larger and larger percentage of its total budget supporting its citizens in retirement, primarily through Social Security and Medicare. These two programs accounted for 16% of the budget in 1967, but represented 35% in 2012. We are saving less and less while the government supports us more and more.
The problem for millennials is that the costs of these support programs is directly tied to our country’s demographic trends. An older population is much more expensive to support, and we are getting much older. In a few decades, the median age in the United States will be similar to the median age in Florida today. Compounding this problem is the fact that we will have far fewer working-age people (i.e., those paying income taxes) to support each retiree. In 1960, there were six workers per retiree. Today there are about four. When millennials reach their prime earnings years, there will only be two workers per retiree. All of this means that we may not enjoy the same support in our retirement as current retirees do. To soften that potential blow, we should build up our own portfolios as soon as we can.
While these obstacles are important and significant, millennials also have formidable advantages. My generation can access global markets at very low cost and with very little effort. If we were to simply buy index funds, we could build a global portfolio for virtually zero cost. And as we will see, there are even better options than global index funds.
We also still have the most impressive investing advantage of all: youth itself. This edge is bestowed on every new generation, but the sad paradox is that while we should care the most about investing when we are young (that is, when our dollars have the most potential), we tend not to care until much later in life, when retirement is visible on the horizon. This is often because of a lack of basic education about markets and investing, a void that I am trying to fill for young investors with my book “Millennial Money: How Young Investors Can Build a Fortune” (Palgrave Macmillan, 2014).
If millennials can be convinced to start investing in the global stock market early and often, the next question is: where should they invest? The trend for millennial investors has been into index funds. In a survey of millennial investors published by brokerage firm UBS in the first quarter of 2014, only 17% of respondents chose the goal of outperforming the market as best describing their investment approach. Like many other investors, many millennials seem resigned to the fact they cannot outperform the market after fees and costs. But while beating the market is difficult, it can be done.
To beat the market, one thing in particular is important: You must build a portfolio that is very different from the overall market. Many mutual fund managers today have built portfolios that look too similar to the index. This means that they probably have returns similar to the market—not winning or losing by much. This helps them keep their jobs, but prevents them from achieving exemplary results. On average, because these managers’ costs and fees are higher than index funds, they tend to lose over time. The key to success is to instead build a portfolio that looks nothing like the benchmark. As the great investor Howard Marks (Oaktree Capital Management) says, we must “dare to be great.”
A study by Yale professor Martijn Cremers and BlackRock portfolio manager Antti Petajisto showed that being different is the way to win. They concluded that the best way to predict how a fund manager would perform is to look at how unique their portfolio is versus the index; the more unique, the higher the average excess returns. The authors coined the term “active share” to measure a portfolio’s uniqueness. Active share is a score between 0 and 100: A score of 100 means that the portfolio is entirely different than the index (no overlap in holdings), whereas a score of 0 indicates an index fund, meaning the fund has perfect holdings overlap with the market. The authors found that even though the average manager loses to the index, those with the highest active share (top 20%) have historically outperformed by 2.4% before fees and 1.13% after fees. The message is clear: If you want to beat an index, you have to be very different than the index.
One of the benefits of index funds is that they are very consistent: They own stocks based on their size and never deviate from the strategy. The discipline inherent in the index strategy is formidable, but the strategy itself (“buy big stocks”) is subpar.
The good news for individual investors is that they can have the best of both worlds: the discipline of an index with a much smarter, proven strategy. In “Millennial Money,” I explore the best rules for stock selection and combine them into a cohesive strategy. The best factors fall in the following five categories. The calculations for each factor can be replicated in Stock Investor Pro (see the box at the end of the article).
If you could only take one lesson away from all of stock market history, it would be this: The less you pay for an asset, the more you will earn from it. This works for individual stocks, countries, sectors, and entire markets. Buying cheap assets forces you to buy what others are selling—to be greedy as others are fearful. It’s psychologically hard to do, but it works.
There are many ways to measure a stock’s cheapness, but one of the best is to compare a company’s free cash flow to its stock price. Cash flows are a cleaner and more reliable measure than the traditionally used earnings, because they are hard to manipulate. Free cash flow subtracts out all of the spending required to keep the business going (capital expenditures); it is the cash leftover after all operating and business expenditures have been accounted for. [Editor’s note: In Stock Investor Pro, free cash flow also subtracts out dividends, since there is a penalty for ending these regular payments.]
Lots of free cash flow is a good sign of a solid business. Buying free cash flow for a good price is a formidable way to select stocks.
Investors (and Wall Street in general) are always focused on the bottom line: earnings. But earnings are often an imperfect measure of success. Cash flows are much harder to manipulate or fake.
A company’s cash flow from operations should exceed reported earnings, otherwise it spells trouble. When earnings are higher than cash flows, it often means that earnings are coming from growing accounts receivables or other cashless balance sheet accounts like inventories or accounts payable. Companies with lots of cashless earnings have historically underperformed the market.
The best way to measure earnings quality is to subtract earnings from operating cash flows and divide by total market capitalization. The higher the ratio, the stronger the company’s cash flows (and therefore the stronger their earnings).
Chief executive officers (CEOs) become famous by building and selling revolutionary products and services. Think Steve Jobs, Bill Gates, or Elon Musk. But that is only half of any CEO’s job. The other half is allocating all the capital that they accumulate. Capital allocation is a neglected and underappreciated skill, but one that can create tremendous shareholder value.
Companies whose CEOs pay back stakeholders (through dividends, share buybacks and paying down debt) have historically crushed stocks of companies whose CEOs dilute their shareholders’ stakes (no dividends, take on more debt and issue more shares of stock). Too often executives spend money on acquisitions and high-risk projects when they should instead be disciplined with their cash. Paying down debt and sending cash back to shareholders suggests discipline on the part of CEOs.
Shareholder orientation can be gauged by looking at cash from financing in relation to market capitalization. A lower value indicates that the company is shareholder-friendly.
A portfolio manager is judged exclusively on the returns that he or she generates. Corporate managers should also be judged in this fashion. Companies that earn higher returns on their capital have historically outperformed the market.
The best measure to use is return on invested capital, which is a company’s operating earnings divided by all the capital that they have invested (book value of equity plus book value of debt minus any cash). Better return on invested capital usually means a higher-quality business, and high-quality stocks have done well throughout history.
While all of the above factors are important, price momentum is a great final check. Stocks in freefall, the proverbial “falling knives” out there, have been dangerous investments. Companies with the worst recent price trends have, on average, continued to do poorly over the following year. Conversely, stocks with strong recent trends (e.g., relative strength) have tended to continue to outperform. As the saying goes, don’t fight the tape.
Momentum can be measured by the stock’s relative price strength rank. A higher number indicates better relative price performance.
First, they are very diverse. They measure very different attributes of a company’s internal success (return on capital), accounting choices (earnings quality) and policies (shareholder orientation). They also measure market sentiment (value and momentum).
Using these factors in combination leads you to companies that are solid operating businesses for which the market has lower (value) but growing (momentum) expectations. This has been a good combination across market history.
To test how these factors worked together, I first set up a simple strategy that ranked each company in the universe by each of our five factors and then bought the 25 stocks with the best average ranking. The strategy was rebalanced on a rolling annual basis, meaning a small piece of the portfolio is traded monthly, but the average holding period is a year or longer. You could think of this as maintaining 12 different portfolios (one per month) with each being rebalanced annually. You could also rebalance the entire portfolio just once per year, or a portion of the portfolio once per quarter. The more frequent the rebalancing, the smoother the results.
Testing was done using data from S&P Compustat, which includes “dead” companies that went out of business—an essential feature for an accurate backtest because it helps avoid always choosing companies that end up as the winners. I also required that a company have a market capitalization of at least $200 million (adjusted for inflation) to ensure adequate liquidity. For smaller individual investors, this limit could be reduced to $50 million, which would produce even better results. The universe included any stock trading on a U.S. exchange, which now includes hundreds of foreign companies.
The results: Between January of 1973 and June of 2013, the 25-stock version of this strategy had an annualized return of 20.2% and an annual volatility (standard deviation) of 18.7%. The best benchmark against which to compare these results is an equal-weighted version of the entire stock universe—the full opportunity set from which the strategy can select. Over the same time period, this universe had an annual return of 11.7% and an annual volatility of 19.4%.
While the strategy does very well in the long term, it is also a fairly consistent performer through time. It has outperformed its equal-weighted market benchmark 80% of the time in rolling one-year periods. Like any strategy, there will be times when this approach underperforms, sometimes by a wide margin. For the 12 months ending January 2000, the strategy would have underperformed the market by 29% as value investing was out of favor and the strategy suffered. More recently, for the 12-month period ending January 2010, the strategy would have underperformed the equal-weighted market by 20%. Being different from the market means that periods like this are inevitable.
But in the longer term, the strategy has provided strong excess return. Over all rolling 60-month (five-year) periods, the strategy has outperformed 96% of the time, and over all rolling 120-month (10-year) periods the strategy has outperformed 100% of the time. Over 10-year periods, the worst-case scenario was outperformance of 121%. Just like investing in the overall stock market, the key with this strategy is having a long time horizon and sticking with it when the times are tough.
This impressive amount of annual excess return shows how powerful active management can be with the right strategy. To be fair, none of these numbers include costs of any kinds (fees if you hired a manger to run a similar strategy, market impact for larger accounts, taxes or commissions), so the real world results will likely be somewhat lower over time. Still, these results show that by daring to be great and building a unique portfolio, you can earn impressive returns.
[Editor’s Note: A list of stocks identified by the strategy at the time of publication can be seen in this issue’s First Cut article, “Patrick O’Shaughnessy’s Millennial Investor Strategy."]
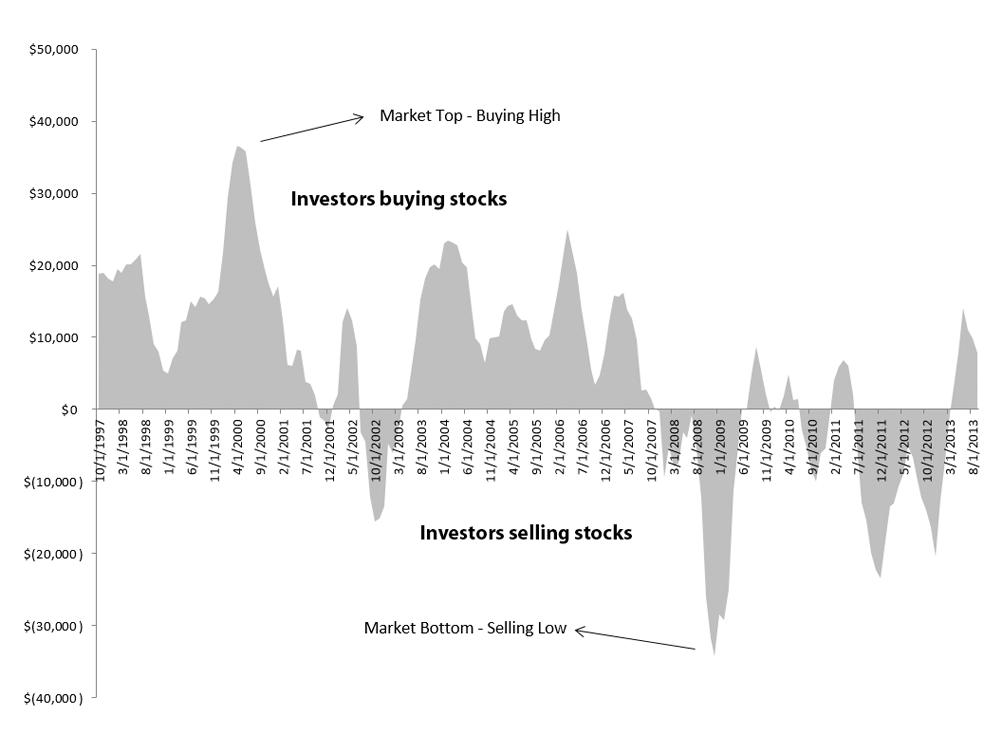
These results all sound good on paper, looked at in the midst of calm market conditions. But to make a strategy like this work in the real world, you will have to contend with the biggest investing obstacle out there: human nature. We tend to be our own worst enemy when it comes to investing: Too often we do exactly the wrong thing at the wrong time. Figure 1 is a broad market example that shows total investor inflows and outflows from equity mutual funds over time. The old adage is “buy low, sell high,” but investors consistently do the opposite. Inflows into equity funds peaked in 2000, right before the tech crash. Outflows peaked in February 2009, at the exact market bottom.
Human nature acts like a tax on our portfolios. To remove this tax, the best solution is to make our investing plans automatic. The less we have to do, the fewer chances we will have to make an emotional mistake. First, young investors should contribute automatically to their retirement and brokerage accounts
directly from their paychecks and/or from their checking accounts. This forces us to steadily put money to work through all kinds of markets, good and bad. Figure 1 shows what we tend to do when left to our own devices: We buy high and we sell low. Making contributions automatic short-circuits this problem.
Another way to make investing automatic is to use a stock selection screen like the one in this article or one of the other great screens available to AAII members. The advantage of using a screen is that screens are emotionless. They don’t fall in love with some stocks or fear others. They simply look for stocks with certain proven attributes and stick to that strategy at all times. The key will be to stick with your approach over the years—especially when the strategy is suffering through one of its inevitable periods of underperformance.
If millennials start investing young, build a unique portfolio, and stay out of their own way, they can succeed in the market. Outperforming the market is notoriously hard, but with the right strategy and the right discipline, it is possible.
The O’Shaughnessy Millennial Money strategy looks at five factors to determine a stock’s attractiveness. These factors are value, earnings quality, shareholder orientation, return on invested capital (ROIC) and momentum. The data for analyzing each of these five factors is available in AAII’s Stock Investor Pro fundamental stock screening and research database program. [See this issue’s First Cut article, “Patrick O’Shaughnessy’s Millennial Investor Strategy" for a downloadable spreadsheet with specific instructions on setting up the screen.]
Value is defined as current share price divided by free cash flow (operating cash flow less capital expenditures and dividend payments) per share for the trailing 12 months. It is the inverse of the free cash flow yield, or how much free cash flow is being generated relative to the share price. The criterion in SI Pro that calculates this factor is:
% Rank-Price/FCFPS
Lower values are better because they imply cheaper valuations.
Earnings quality is defined as cash from operations minus net income for the trailing 12 months divided by market capitalization. This makes it possible to compare earnings quality across companies of various sizes. The factor can be calculated in Stock Investor Pro by creating a custom field using the formula:
([Cash from operations 12m]-[Net income 12m])/[Market Cap Q1]
Higher values are better because they signify stronger cash flows and thereby stronger earnings.
Cash from financing reveals whether a company is sharing its wealth with shareholders via dividends and stock repurchases, or if it is raising capital via issuing debt or additional shares of stock. By comparing cash from financing to market capitalization, companies of various sizes can be compared. The factor can be calculated in SI Pro by creating a custom field using the formula:
[Cash from financing 12m]/[Market Cap Q1]
Lower values are better because they imply a company is undertaking more shareholder-friendly actions (e.g., paying down debt and buying back stock).
Return on invested capital (ROIC) measures how much profit is being realized from capital invested by a company. It measures net operating profits after taxes (NOPAT) relative to shareholder equity and debt. The criterion in SI Pro that calculates this factor is:
Return on inv cap Y1
Higher values are better because they signal that a company is more profitable relative to every dollar of its total capital.
Relative price strength calculates how well a stock has performed against a benchmark, such as the S&P 500 index. Relative price strength rank compares the relative price strength for a stock to all other stocks, with higher values implying better relative price performance. The criterion in SI Pro that calculates this factor is:
% Rank-Rel Strength 26 week
Higher values are better because stocks with better relative price performance tend to continue outperforming.
First Cut Stocks

Portfolio Strategies

Portfolio Strategies

Susie Jacobsen from WA posted over 11 years ago:
Paul from TX posted over 11 years ago:
Charles Rotblut from IL posted over 11 years ago:
Susie Jacobsen from WA posted over 11 years ago:
Arobindo Dutt from Arizona posted over 11 years ago:
Carl Brady from Nebraska posted over 11 years ago:
Bob Marlin from Illinois posted over 11 years ago:
Charles Rotblut from IL posted over 11 years ago:
Paul from TX posted over 11 years ago:
Charles Rotblut from IL posted over 11 years ago:
Dave Gilmer from WA posted over 11 years ago:
Arnold from VA posted over 11 years ago:
David Levine from NC posted over 11 years ago:
Daniel from NY posted over 11 years ago:
Charles Rotblut from IL posted over 11 years ago:
Charles Rotblut from IL posted over 11 years ago:
Paul Koehler from NE posted over 11 years ago:
Chris from VA posted over 11 years ago:
Dave from Canada posted over 10 years ago:
Henry from OK posted over 10 years ago:
Kenny from NM posted over 10 years ago:
You need to log in as a registered AAII user before commenting.
Log InCreate an account