


John Zhong, CEO and founder of portfolio service MyPlanIQ, describes how his website uses model portfolios to help investors build and maintain diversified portfolios for their retirement plan based on their risk tolerance and allocation desires.
MyPlanIQ is an online portfolio suggestion platform for retirement investing. Established in 2008, it provides asset allocation model portfolios for retirement plans including 401(k), defined-contribution, IRA/taxable brokerage and variable annuity plans. MyPlanIQ is designed to help investors manage risk within their portfolios through two main factors: portfolio diversification and tactical risk reduction.
Users can customize a plan-specific model portfolio that is tailored to their risk level by answering a few questions. The platform monitors the model portfolios daily and sends rebalancing instructions monthly. MyPlanIQ has over tens of thousands of public retirement plans [401(k), 403(b), etc.] and can construct model portfolios using the candidate funds in a plan. In addition, it has constructed exchange-traded funds (ETFs) and no-load and no-transaction-fee mutual fund investment plans for major brokerages. Users can use these plans for their IRAs and taxable investments.
The platform provides detailed backtesting, historical transactions and holdings as well as many portfolio performance metrics. It also provides a composite portfolio feature that allows users to test and monitor a portfolio of their model portfolios and funds. Investors will have to implement the buy, sell and rebalancing strategies on their own within their own investment accounts.
In addition, MyPlanIQ monitors and provides a group of fixed-income model portfolios that are customized for major brokerages. These portfolios invest in no-load and no-transaction-fee total return bond funds.
For ongoing support to users, MyPlanIQ provides free weekly newsletters that discuss both prevalent market conditions and portfolios studies. The newsletter archive contains almost all of these newsletters from the past five years.
Quick Guide
There are four steps that summarize how to set up and use your MyPlanIQ account.
1. Tell us about yourself: Enroll online and answer a brief questionnaire that determines your risk profile.
2. Tell us about your plan: We have the largest database for company retirement plans. However, if we don’t have your fund list on file, send us an email listing the funds available through your retirement plan.
3. Get immediate suggestions: You’ll immediately get the fund suggestion for your account if we have your company’s fund list on file. We’ll also show you the backtesting performance for your reference. You can then make the appropriate changes in your investment account based on the suggestion.
4. Receive periodic rebalance reminder emails: We’ll monitor the market and your funds. You’ll receive monthly rebalance reminder emails reminding you to reallocate your account to make sure you’re on track with your most optimal allocation.
The gist of MyPlanIQ usage lies in the collection of portfolios on a user’s dashboard. After creating an account and/or subscribing to a subscription plan (more on pricing later), users manage their portfolios on a dashboard. The portfolios are classified into four categories: Basic Portfolios, Static Portfolios, Advanced Portfolios and Advanced Static Portfolios.
- Basic Portfolios use MyPlanIQ basic Strategic Asset Allocation (SAA) and Tactical Asset Allocation (TAA) strategies.
- Static Portfolios are a collection of funds or portfolios that have target allocations.
- Advanced Portfolios use investment strategies other than the basic two asset allocation strategies.
- Advanced Static Portfolios are portfolio templates based on a target fund or asset class allocation.
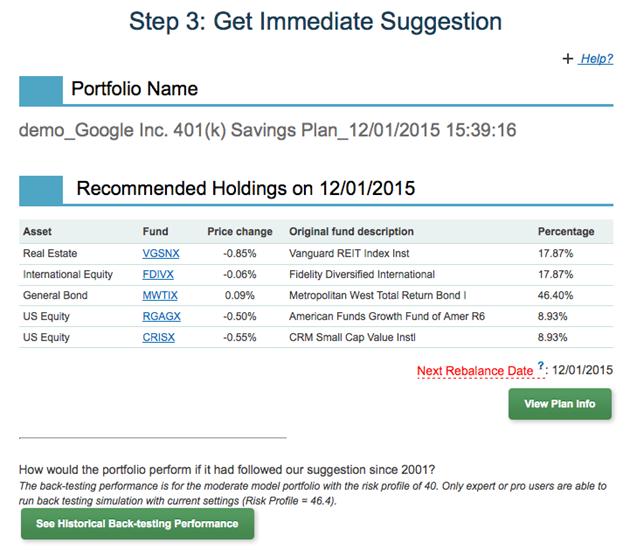
Once a user follows an existing model portfolio or customizes a new portfolio, the portfolio is added to his or her dashboard. These portfolios are updated daily and the user receives rebalance or transaction emails regularly. The user can then rebalance or make transactions in his or her actual brokerage account in order to mimic the changes made within the MyPlanIQ model portfolios.
MyPlanIQ provides easy-to-follow ‘Get Started’ steps for users to construct a customized basic portfolio. Figure 1 shows a sample portfolio that might result.
The funds in Figure 1 are chosen from the list of 29 investment options (candidate funds) in Google Inc. 401(k) Savings Plan based on a fund’s performance (past several years’ Sharpe ratio, return and volatility) and its expense ratio.
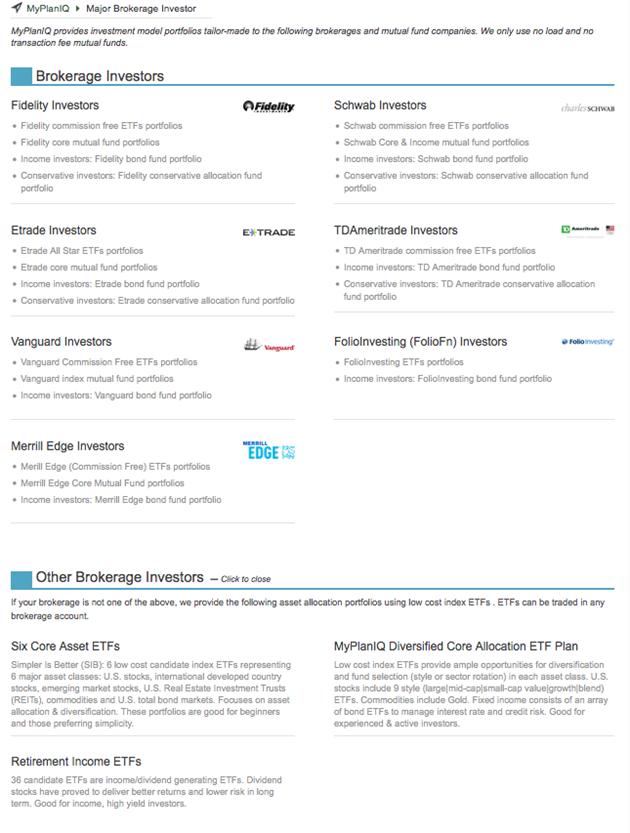
Users can also choose from portfolios composed of ETFs, no-load no-transaction-fee mutual funds, or fixed-income offered by the major brokerages listed on our Brokerage Investor page, as shown in Figure 2.
Advanced portfolios can be found on the Advanced Strategies page and are grouped into different strategies that include asset allocation, portfolio rebalancing, equity/stock, fixed income/bond and commodities/currencies strategies. Users have the ability to customize advanced portfolios. Examples of customization include using users’ own funds (ETFs or mutual funds) and frequency of rebalance.
Main Features
Portfolio Construction, Backtesting and Ongoing Monitoring
MyPlanIQ enables users to backtest and monitor a portfolio that uses our existing strategies. These include Strategic Asset Allocation (SAA)- Equal Weight (free for any registered users), Strategic Asset Allocation (SAA) - Optimal (basic subscription) and Tactical Asset Allocation (TAA) (basic subscription). These strategies work on a group of preselected candidate funds (called a plan, similar to a 401(k) or 403(b) plan) and make monthly, quarterly, semiannual or annual (user choice) rebalances by deciding on asset weights and fund choices. Historical backtesting can be dated back to 2000 or even earlier, depending on the funds’ history.
To explain more, for each brokerage MyPlanIQ preselects a list of funds for its strategies to act upon. For example, in TDAmeritrade, MyPlanIQ constructs a “pool” of commission-free ETFs for a plan that consists of a majority of TD Ameritrade’s commissions-free ETFs (not all of them), and then picks funds out of the pool. The list of funds that are chosen from the pool is called a “plan,” just like a 401(k) plan that has a preselected limited subset of funds.
The SAA strategies adhere to preselected asset class target allocations and periodically select candidate funds within an asset class in the plan in order to rebalance to target allocations. The TAA strategy is based on trend following or a relative momentum algorithm. It periodically selects the top-performing asset classes and funds to invest in. When market conditions worsen, it can partially or completely reduce riskier asset exposure (stocks, REITs and/or commodities) to mitigate the possibility of large losses.
MyPlanIQ has tens of thousands of 401(k), 403(b), 529 and variable life insurance and annuity plans in its database. The basic asset allocation strategies obey minimum holding periods and/or round-trip restrictions for a mutual fund. If a public plan is not found, users can submit their list of funds to us and we will construct the plan. Expert or pro subscribers can also construct a private plan that consists of a list of funds of their own choices. MyPlanIQ automatically creates and monitors three moderate-risk model portfolios for SAA equal weight, SAA Optimal and TAA.
In addition, as shown in Figure 2, MyPlanIQ selects a list of no-load and no-transaction-fee mutual funds or ETFs to construct brokerage-specific model portfolios.
Users can construct static portfolios composed of funds of their choice (mutual funds or ETFs) and their target allocation percentages. Backtesting and ongoing monitoring is provided. Users can also alter the funds and/or their target allocation percentages at any time while still maintaining the previous history. This feature is free to any registered user.
The advanced static portfolio feature allows expert users to specify target allocations for asset classes, not just funds. MyPlanIQ’s algorithm will then perform fund selection as well as allocation rebalancing (based on a user-selected rebalance time frame).
A portfolio can be treated as a ‘fund’ symbol. Thus, users can construct a portfolio of portfolios and funds, also known as composite portfolios. Composite portfolios enable backtesting and ongoing monitoring of multiple strategy portfolios. For example, users can construct a core satellite portfolio that consists of a ‘core’ 60% strategic asset allocation portfolio and a ‘satellite’ 40% tactical asset allocation portfolio.
Users can construct a custom portfolio by changing parameters (such as rebalance frequencies, number of funds chosen etc.).
Portfolios are updated daily using daily closing prices. Dividends are automatically reinvested.
Historical Transactions and Holdings
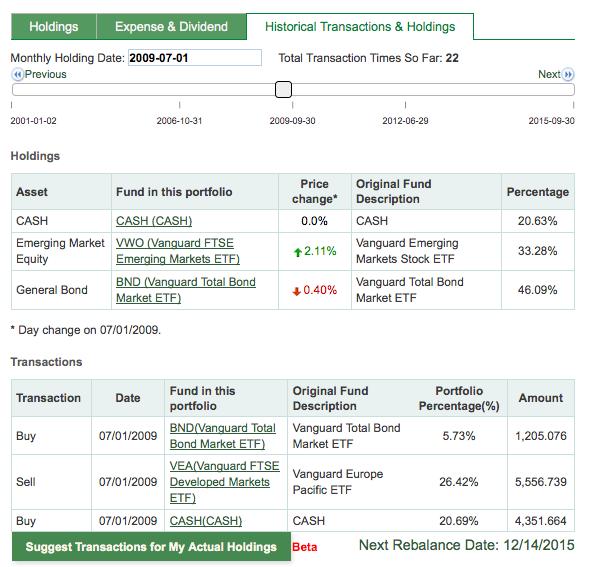
MyPlanIQ maintains historical transactions and a holdings history for each portfolio. They can be viewed visually through charts or exported to Excel and displayed as a table. Figure 3 shows historical holdings and transaction browsing through a sliding bar.
Portfolio Performance Metrics
Important portfolio performance metrics are derived in backtesting and updated on an ongoing basis, as shown in Figure 4.
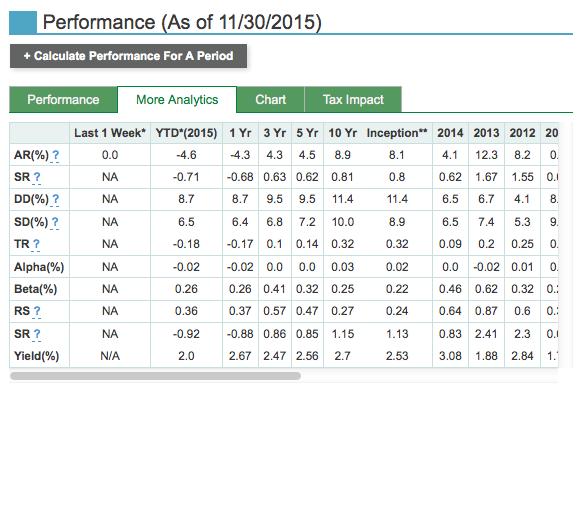
Metrics explanations:
- AR: Annual return, or geometric average of annual return. Also known as annual CAGR (compound aggregate growth rate).
- SR: Sharpe ratio. It is the ratio of the excessive portfolio returns above cash over standard deviation of the portfolio.
- DD: Maximum drawdown in a period: It is the maximum percentage loss from a previous high to a trough in the portfolio value.
- SD: Standard deviation, which measures the volatility of the portfolio.
- TR: Treynor ratio. Like the Sharpe ratio, is used to measure how much excess return with respect to cash could be earned per unit of beta.
- Alpha: The constant when decomposing a portfolio return series in a linear regression with respect to S&P 500 returns. It measures the extra gain/loss of a portfolio after subtracting the benchmark related returns.
- Beta: Coefficient of the S&P 500 benchmark when decomposing a portfolio return series in a linear regression with respect to S&P 500 returns. It measures how correlated a portfolio is with respect to a benchmark such as the S&P 500 index.
- RS: R-squared. It is used to predict how meaningful the other parameters such as alpha, beta and standard deviation are with respect to the benchmark used. The closer R-squared is to 1, the more meaningful the parameters are.
- SR: Sortino ratio: Unlike the Sharpe ratio, it measures the excessive portfolio returns above cash over downside volatility only.
- Yield: Historical portfolio yield in a period.
Charts
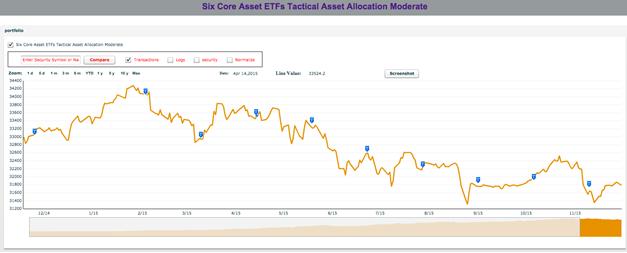
A portfolio and fund’s total return (which includes dividends reinvested, not just price return) snap charts and interactive charts are provided. Figure 5 shows a flash chart that is annotated with historical transactions:
Other Portfolio Tools
MyPlanIQ provides a popular portfolio and fund performance comparison tool. It compares a set of portfolios and/or funds. Metrics data such as annual returns and maximum drawdown are provided in table and chart format based on year-to-date, one-, three-, five- and 10 -year return and return since inception. For any portfolio and fund, users can calculate annualized return, Sharpe ratio and standard deviation for a custom period.
A tax impact tool allows users to measure how much aftertax return a portfolio has based on user inputs of long-term and short-term tax rates as well as transaction commissions.
Plan ratings derive an overall rating for a particular plan based on the funds’ quality, expenses, asset coverage and portfolio construction ability, including diversification.
Market, Asset Class and Fund Analytics Tools
MyPlanIQ provides a breadth of market indicators, asset trends and fund analysis information, as shown in Figure 6.
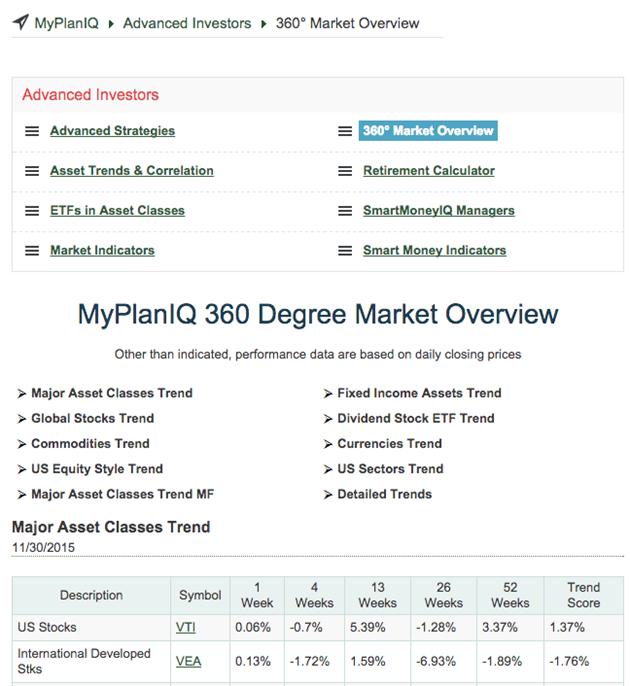
The 360 Degree Market Overview shows daily trend scores for major asset classes, country stocks, U.S. styles (such as U.S. large-cap blend, large-cap value, large-cap growth, mid-cap and small-cap growth, value or blend) and sectors. The Asset Trends & Correlation page shows asset class returns and their correlations with one another. The SmartMoney Indicators page shows the aggregate asset allocations from a set of asset allocation mutual funds weekly. The asset allocations of these funds are derived using MyPlanIQ’s proprietary fund allocation analytical program. The Market Indicators page shows long-term stock market valuation metrics (such as Shiller CAPE 10 ratio or Warren Buffett GNP to total stock market capitalization ratio) weekly.
Weekly Newsletters
Over the years, MyPlanIQ has communicated with subscribers through weekly newsletters that cover a wide range of topics that include investment strategies, portfolio management, investor behavior, fund review and financial planning and retirement. It also discusses current market conditions.
We also maintain a newsletter collection (archive) that subscribers can access at any time.
Pricing
Registered users can access to our Strategic Asset Allocation equal-weight-based portfolios and static portfolios for free. A basic subscription costs $19.95 per month or $199.95 per year. Basic membership allows users to follow and create up to five basic portfolios and/or static portfolios. The expert subscription costs $29.95 per month or $299.95 per year and allows users to create their own private plans as well as customize and follow up to 10 basic and advanced portfolios. The pro subscription costs $49.95 per month or $499.95 per year. It allows users to manage up to 20 portfolios.
The Pricing page compares the subscription levels.
Conclusion
MyPlanIQ provides easy-to-use comprehensive tools and information for retirement investing. Unlike most other tools and services, it emphasizes asset allocations and risk management through various investment strategies, portfolio construction and analytical features as well as ongoing education and timely communication.
Discussion
FREE REPORT

Fred Meyer from MD posted over 8 years ago:
You need to log in as a registered AAII user before commenting.
Log InCreate an account