



Related

Technical Analysis
Part three of a series on the relative strength index takes a look at six specific and direct applications for using this popular technical indicator.

Raymond Rondeau leads a class in AAII's new Essential Investing Video Course. Go to https://www.aaii.com/ves for more information and to subscribe.
In the third part of this series on the relative strength index (RSI) indicator, I look deeper into some intermediate-level methodologies and applications utilizing RSI. To begin, I look at some of the indicator’s strengths, weaknesses, cautions and misconceptions in an effort to gain a better overview and feel for the indicator. After the conclusion of that section and the final theory of the indicator, I then break down in detail six specific and direct applications with RSI. Included are discussions on intermediate chart interpretations for direct security analysis and some alternate methodologies of using RSI to potentially benefit investors.
For all articles in this series, please click here.
RSI can be a very simple indicator to interpret and it does generate a number of well-defined easily identifiable signals. Because of this, it is very popular and utilized by investors of all levels or experience. Additionally, it is widely distributed and readily available free of charge on the web or within any technical investing platform.
In this daily chart of Walmart Inc. (WMT), we can see a basic chart with RSI and its classic crossover overbought/oversold signals. These signals are highlighted by the red and green arrows. When one evaluates RSI’s cost, ease of access and setup, simple interpretations and its measured historical effectiveness, it is obvious to see why RSI is so popular with today’s investors.
Some may argue that the reason for RSI’s popularity has less to do with its performance and more to do with its timing and creator’s reputation and associations with other popular indicators. Supporting this reasoning is the fact that RSI was one of the first oscillators (along with stochastics) to be made readily available to the individual investor in the 1970s.
As illustrated, RSI is calculated using only the closing prices on the base security over a predetermined time period, leaving out many other potentially beneficial readings. Additionally, like the vast majority of the classic technical indicators, RSI simply calculates and plots its values from a constant static algorithm. Because of these factors, it is reasonable to question whether applying RSI (with the same parameters) to a variety of dynamic indexes and asset classes that all have different influences and subsequent price movement characteristics is a realistic approach.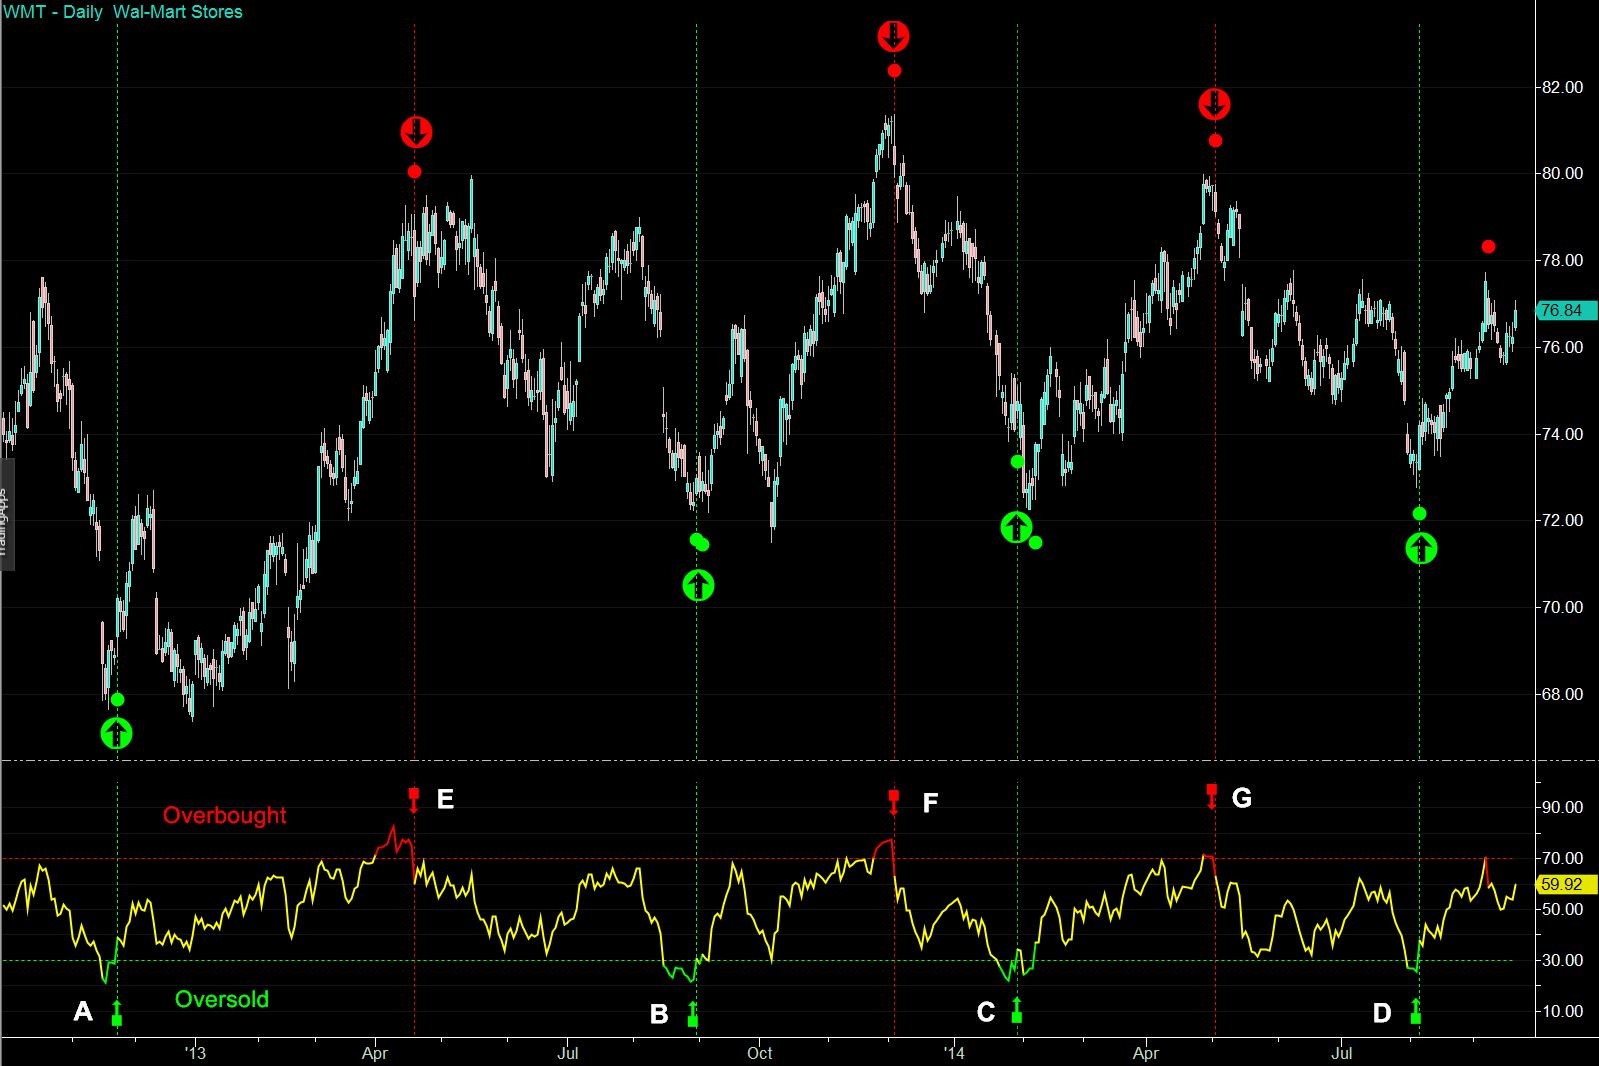
More importantly, it is critical for users of RSI to understand that overbought and oversold levels are descriptive and not to be taken literally. Investors must realize that securities can remain in these zones for a prolonged period of time before “normalizing.” For instance, when RSI moves into an overbought or oversold level, very often, price will simply translate into a price consolidation. When these price consolidations occur, price will often “range” or form minor continuation patterns (flags, pennants) before resuming its currently established trend. This is why experienced technicians always factor in other chart reading observations into their analysis before attempting to make a “call” on the probable future price movement’s direction and intensity.
The example in Figure 2 shows one of the major shortcomings of utilizing RSI (and all oscillators) in isolation and as a single determinate. Here we see that when Welltower Inc. (HCN) was in a prolonged uptrend, our RSI indicator was constantly signaling false overbought readings. These areas are highlighted by the red ShowMe dots. Notice here how the trend continued upward and that the price kept rising despite RSI’s overbought readings of having a value greater than 70.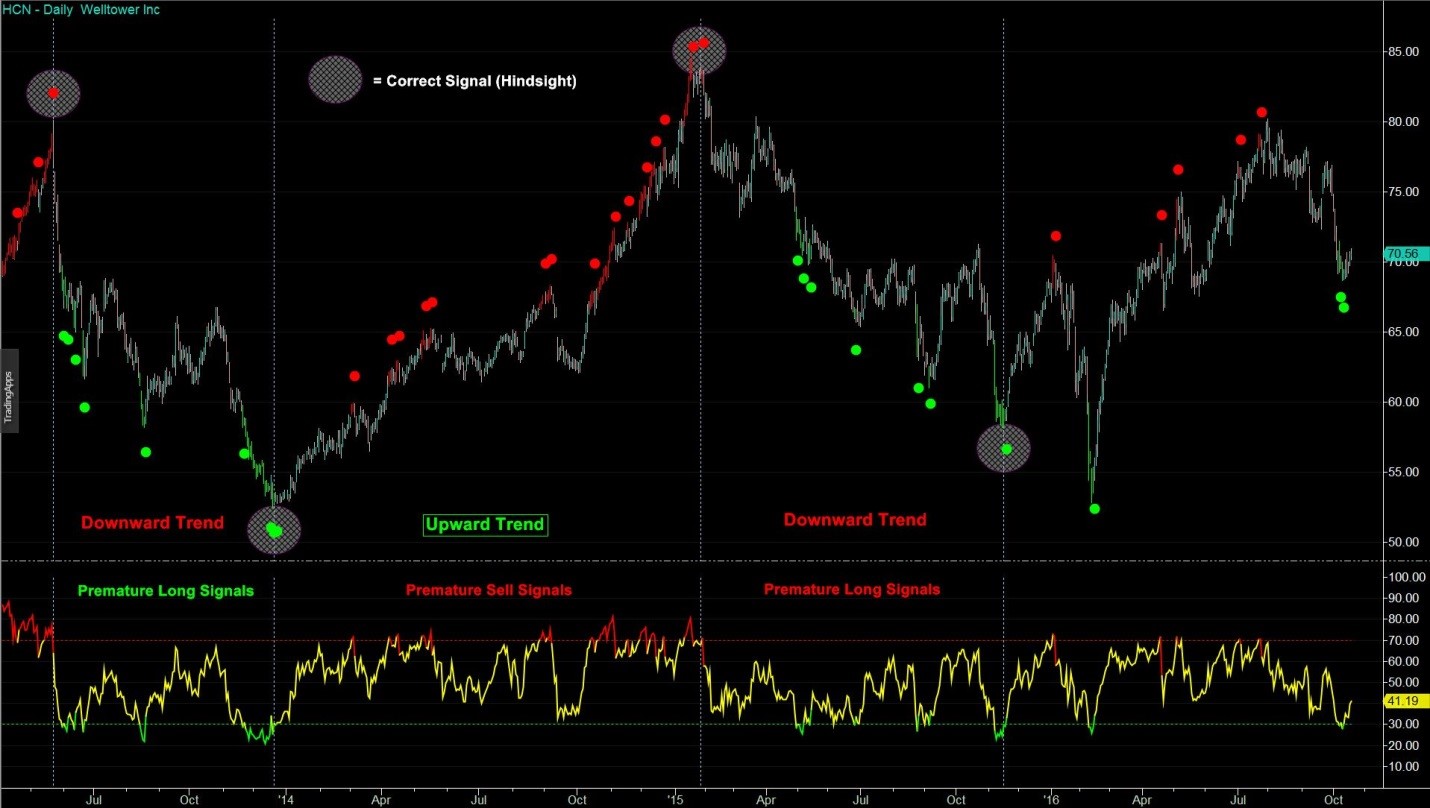
Similarly, when Welltower was in prolonged downtrends, our RSI indicator was constantly signaling numerous premature false oversold readings. These areas can be identified by the green ShowMe dots. Notice here how prices kept falling despite RSI signaling successive, consecutive oversold levels with an RSI value below 30.
In the same chart, the grey etched circles highlight when RSI was correct in identifying the true trend reversal. Unfortunately, these signals would only be known to be correct to the user in hindsight.
Most technicians would agree that RSI is a useful and clarifying indicator but unfortunately the same can’t be stated for its name. The term relative strength index is in itself misleading as to what it does. Additionally, because of this and its close phrasing to the term relative strength, which measures pure relative strength in a conventional way, these two measurements are often confused. Because both of these tools are so widely used and referenced, an understanding of the differences between the two is important.
Relative strength measures the performance over a selected period of time of a financial instrument relative to the performance of another financial instrument (often an index). Additional information is given in the Relative Strength section below.
The relative strength index measures gains and losses over a selected period of time of a financial instrument relative to its own performance.
Figure 3 shows two non-scaled plots of Apple Inc. (AAPL) and SPDR S&P 500 ETF (SPY) displaying the relative strength and the relative strength index indicator. In the first lower pane A, TradeStation’s relative strength indicator plots the percentage differences (subtracts) over a user-supplied number of bars (14), between the two symbols. In the middle lower pane B, a straight security relative strength price ratio (AAPL/SPY) is plotted. The lowest pane C shows the relative strength index indicator. Note: The first two relative strength measurements (panes A and B) utilize and compare the prices of both AAPL and SPY, while in the lowest pane RSI only uses AAPL’s prices for its calculations and readings.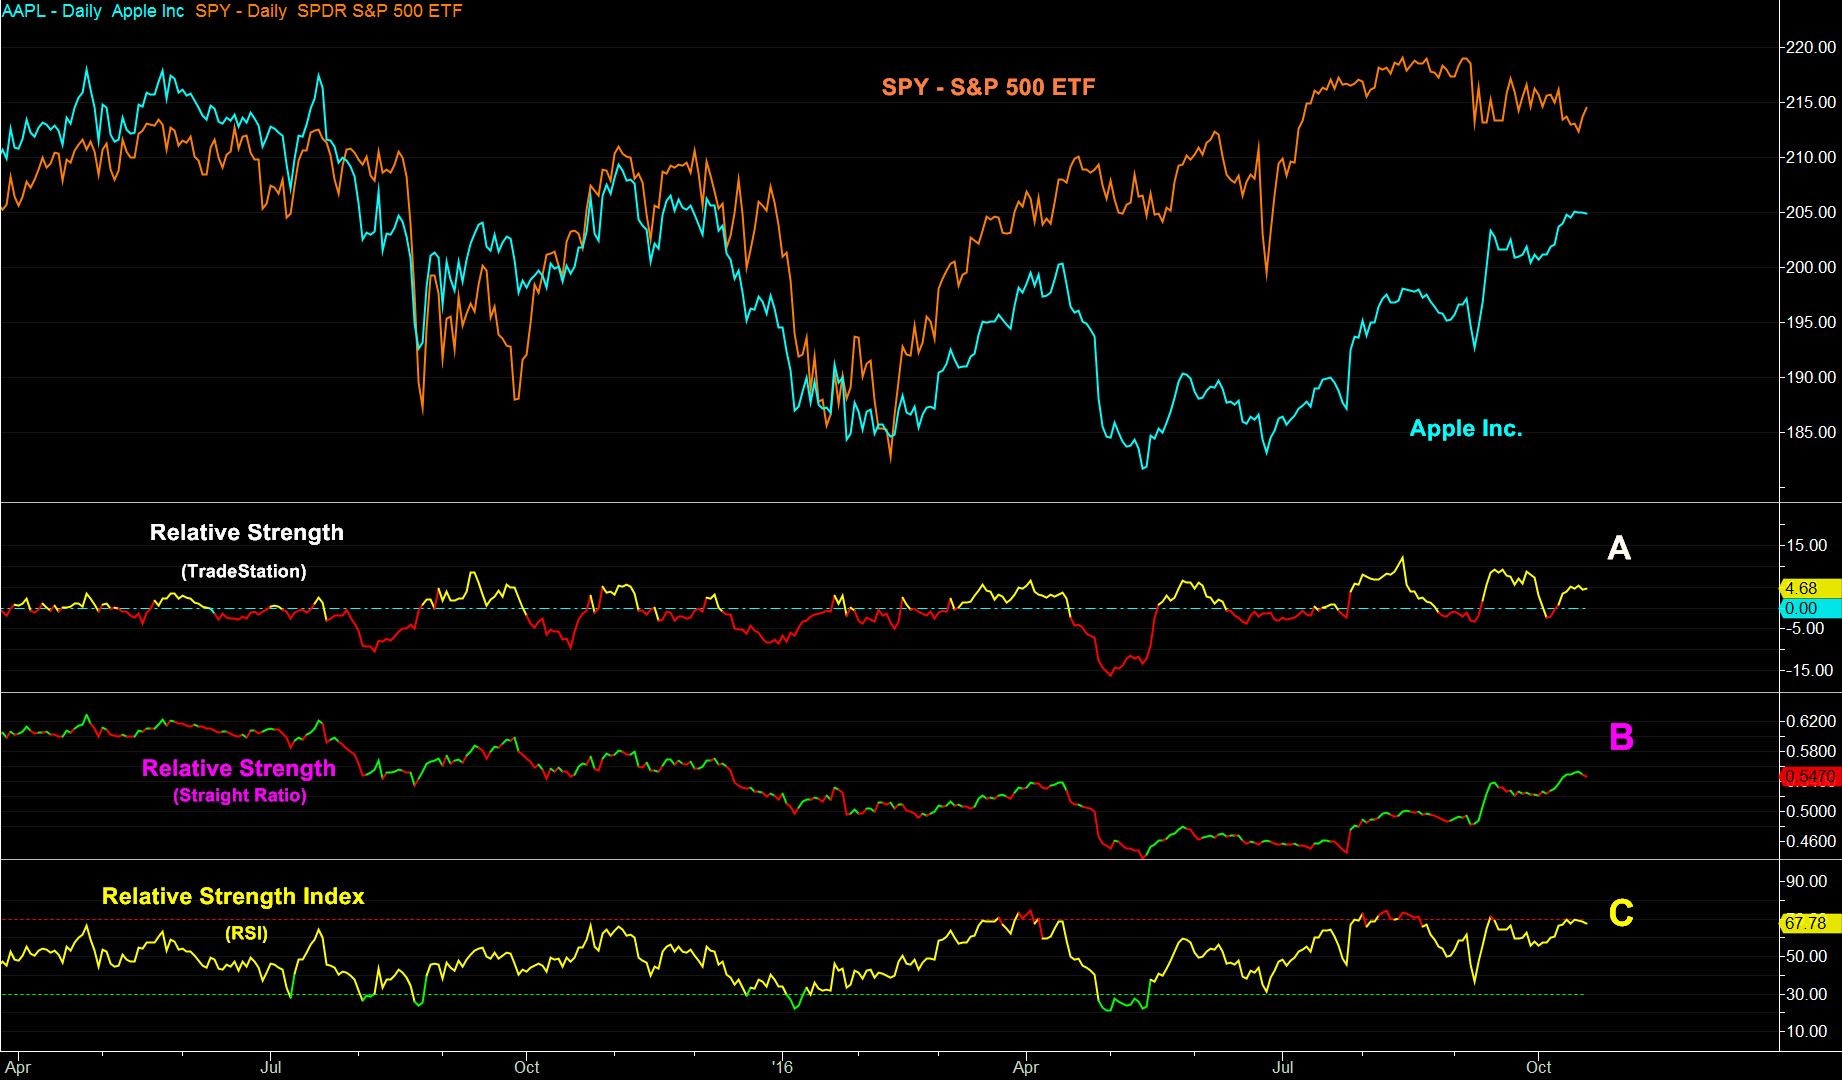
The measuring of relative strength can be an important reading for many areas in financial- and market-related analysis. Momentum, changes and divergences in this reading, when paired correctly to an appropriate “entity” can be an early warning sign of a bigger upcoming move. Often these (sometimes subtle) relative strength changes will occur even before the related news or the reason for the upcoming larger future price moves becomes widely known to the general public.
Relative strength (RS) can be calculated and displayed in a variety of ways. One method is:
RS = base security (close price) ÷ benchmark (close price)
= price of stock ABC ÷ price of major index
= $130 ÷ $100
= 1.3
With this classic RS calculation method, the absolute individual RS number in itself is meaningless. In fact, often this value will be “normalized” to a level of 0 or 1 to a strategic point in the past. This allows correct analysis of evaluating over/under performance and spotting divergences from an important past reference point in time. For instance, from an important company event or for/or from a certain time period such as a one-year period or YTD (year-to-date).
An alternate method to calculate RS is:
RS = base security (% change*) ÷ benchmark security (% change*)
= 20% (return over 1 year) ÷ 10% (return over 1 year)
= 2
*measured over N periods
As previously covered, it is highly doubtful that any single technical indicator is ever the best choice for every application. With that being noted, there is something to be said for an investor who prefers to continually use the same sets of indicators. By doing so, an investor will develop a deeper familiarity and understanding of the readings due to share repetition and experience. Fortunately, the RSI indicator does offer considerable flexibility. Because of this, six different RSI interpretations are discussed: failure swings, RSI moving average crosses, divergences, positive and negative reversals, support/resistance patterns and RSI scanning.
Building on our previously covered classic interpretation of RSI, and the generation of signals from crosses from the overbought (70)/oversold (30) levels, a more detailed and refined signal from these levels can be sued that Wilder labeled as failure swings.
Failure swing bottoms occur when the RSI is below the oversold level at point A in Figure 4 below and then retraces, forming a pivot high at point C. From here, RSI declines again to point B but fails to drop to the previous RSI low at point A. The failure swing is then confirmed when the price breaks above the previously formed pivot high at point C and preferably up above the oversold level at point D.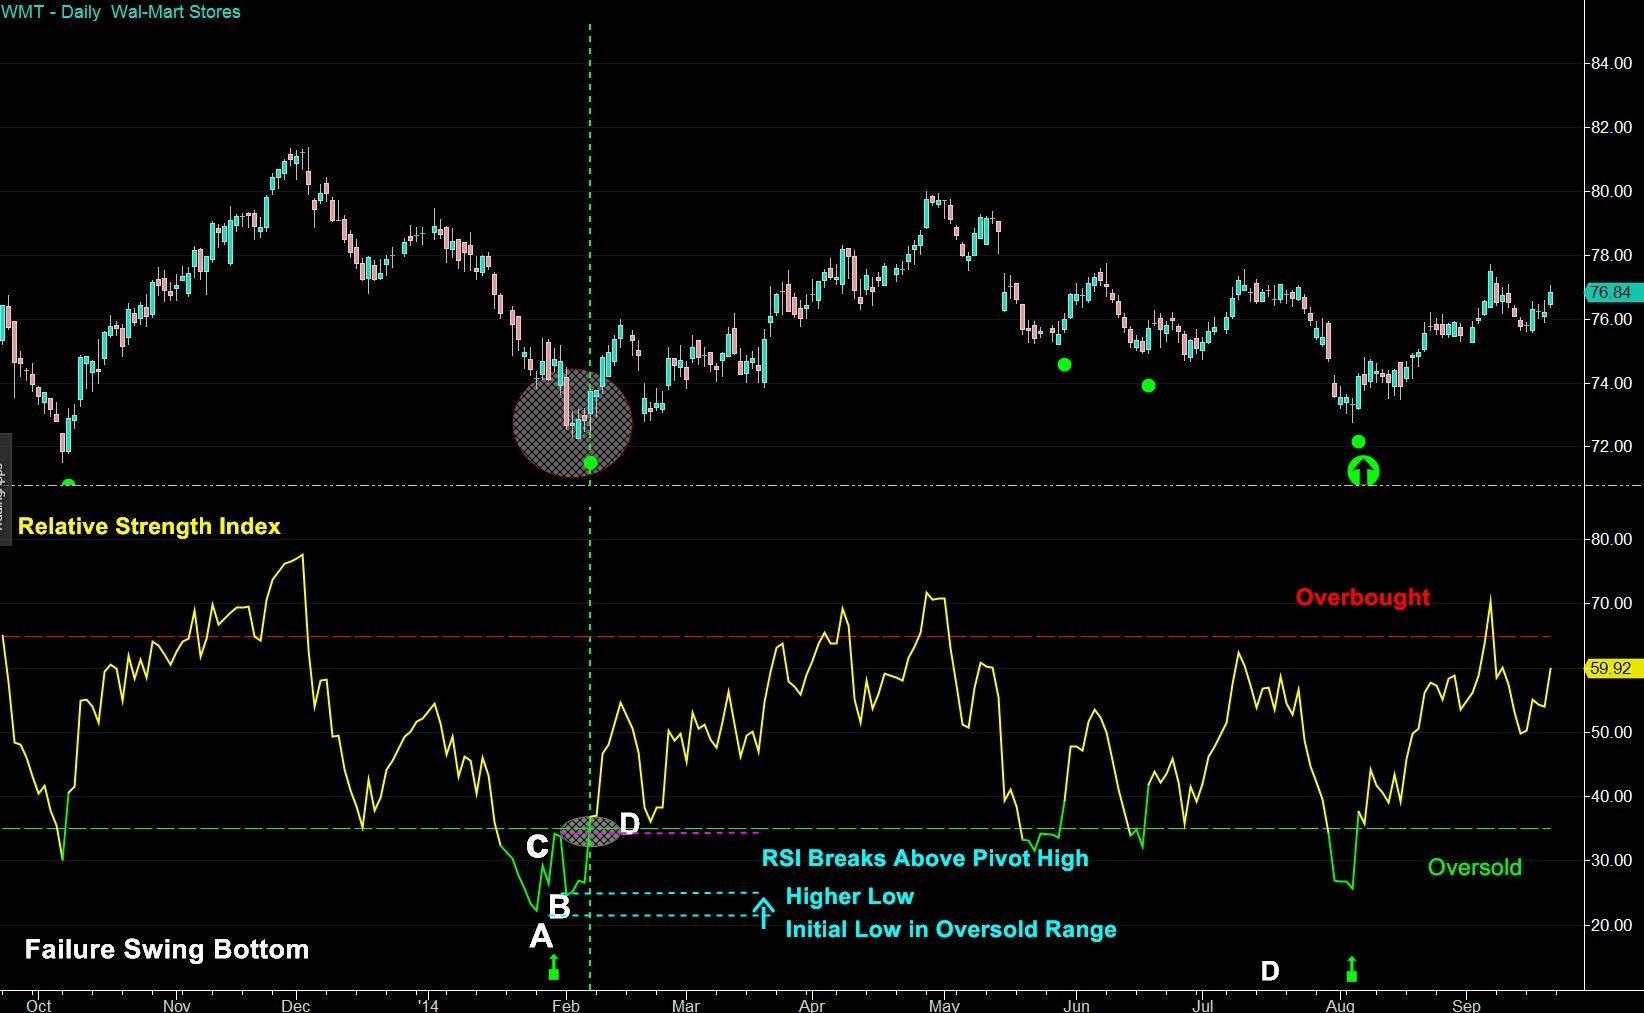
Failure swing tops occur when the RSI is above the overbought level of 70 at point A in Figure 5 below and then falls, forming a pivot low at point C. From here RSI rises again to point B but fails to reach the previous RSI high at point A. The failure swing is then confirmed when price breaks below the previously formed pivot low at point C and preferably down under the overbought level at point D.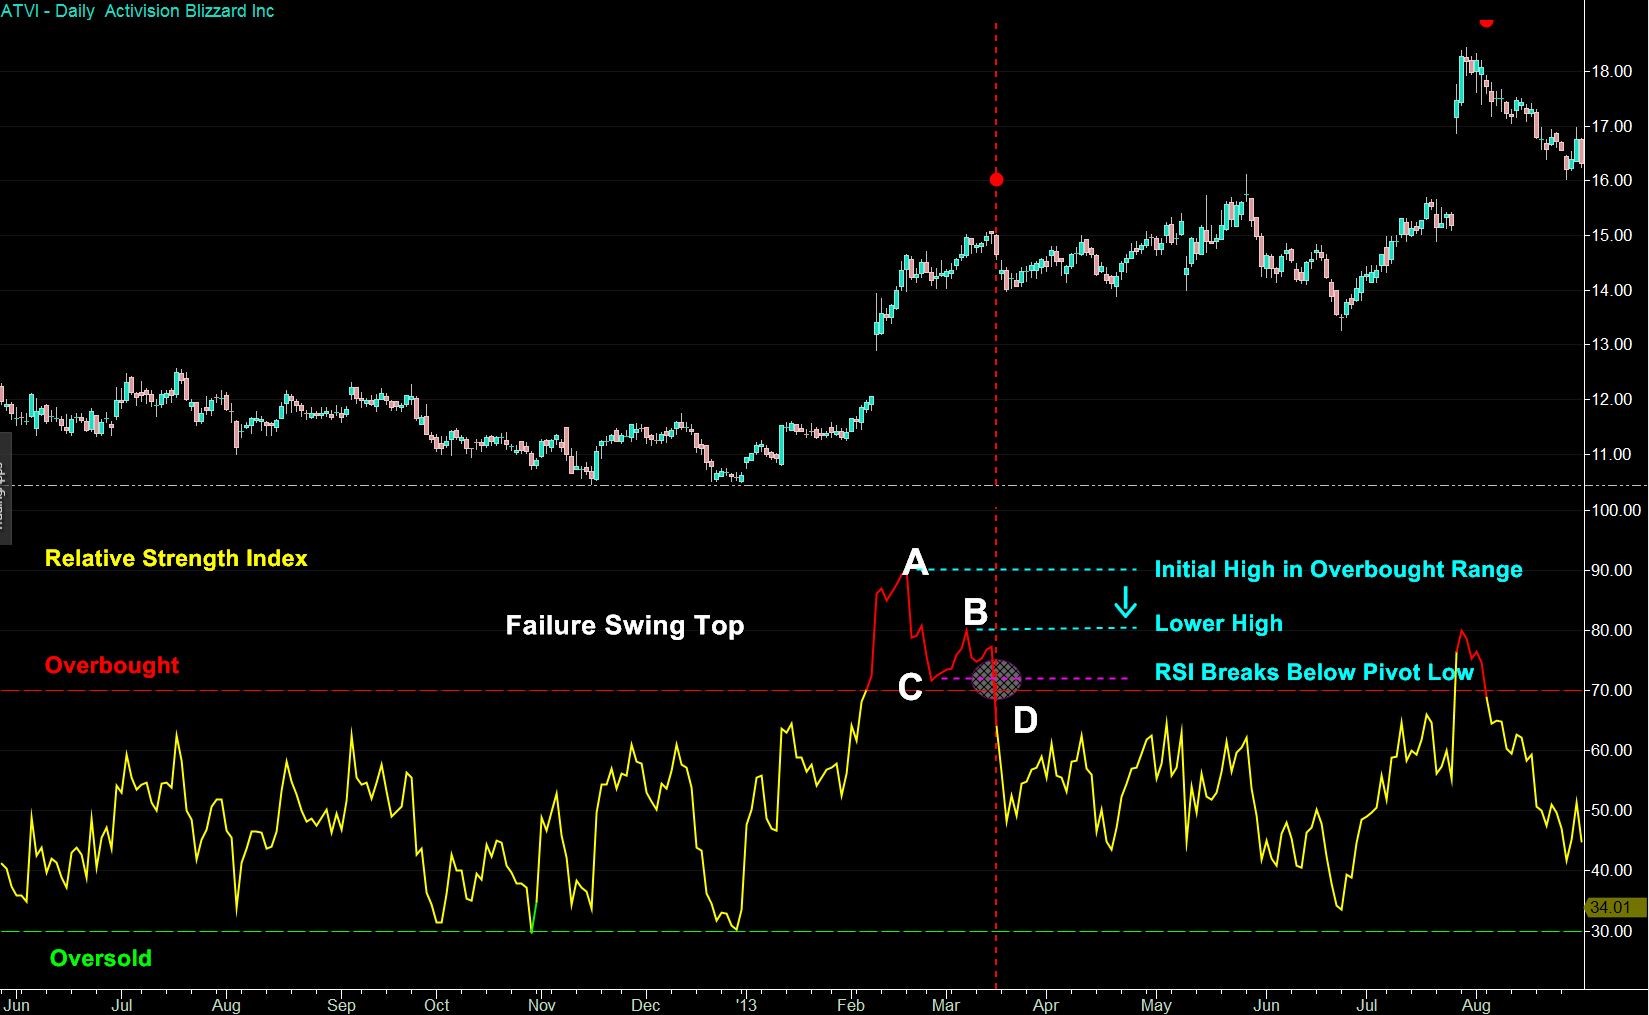
Although debatable, failure swings from extreme levels are looked upon as one of RSI’s strongest and most useful signals. Failure swings are interpreted just like basic trend reversal price analysis, where you are looking for a change of higher lows (bottoms) or lower highs (tops), but in this case on the RSI indicator itself. These RSI failure swing formations are considered more relevant when they occur at deeper RSI levels above the overbought (tops) or below the oversold (bottoms) designated levels.
Figure 6 shows that in early June 2012 Martin Marietta Materials Inc. (MLM) flashed a bullish RSI number at point A. The price then followed with a classic bottoming pattern and a strong breakout (B), leading to a +100% move over the next two years (C).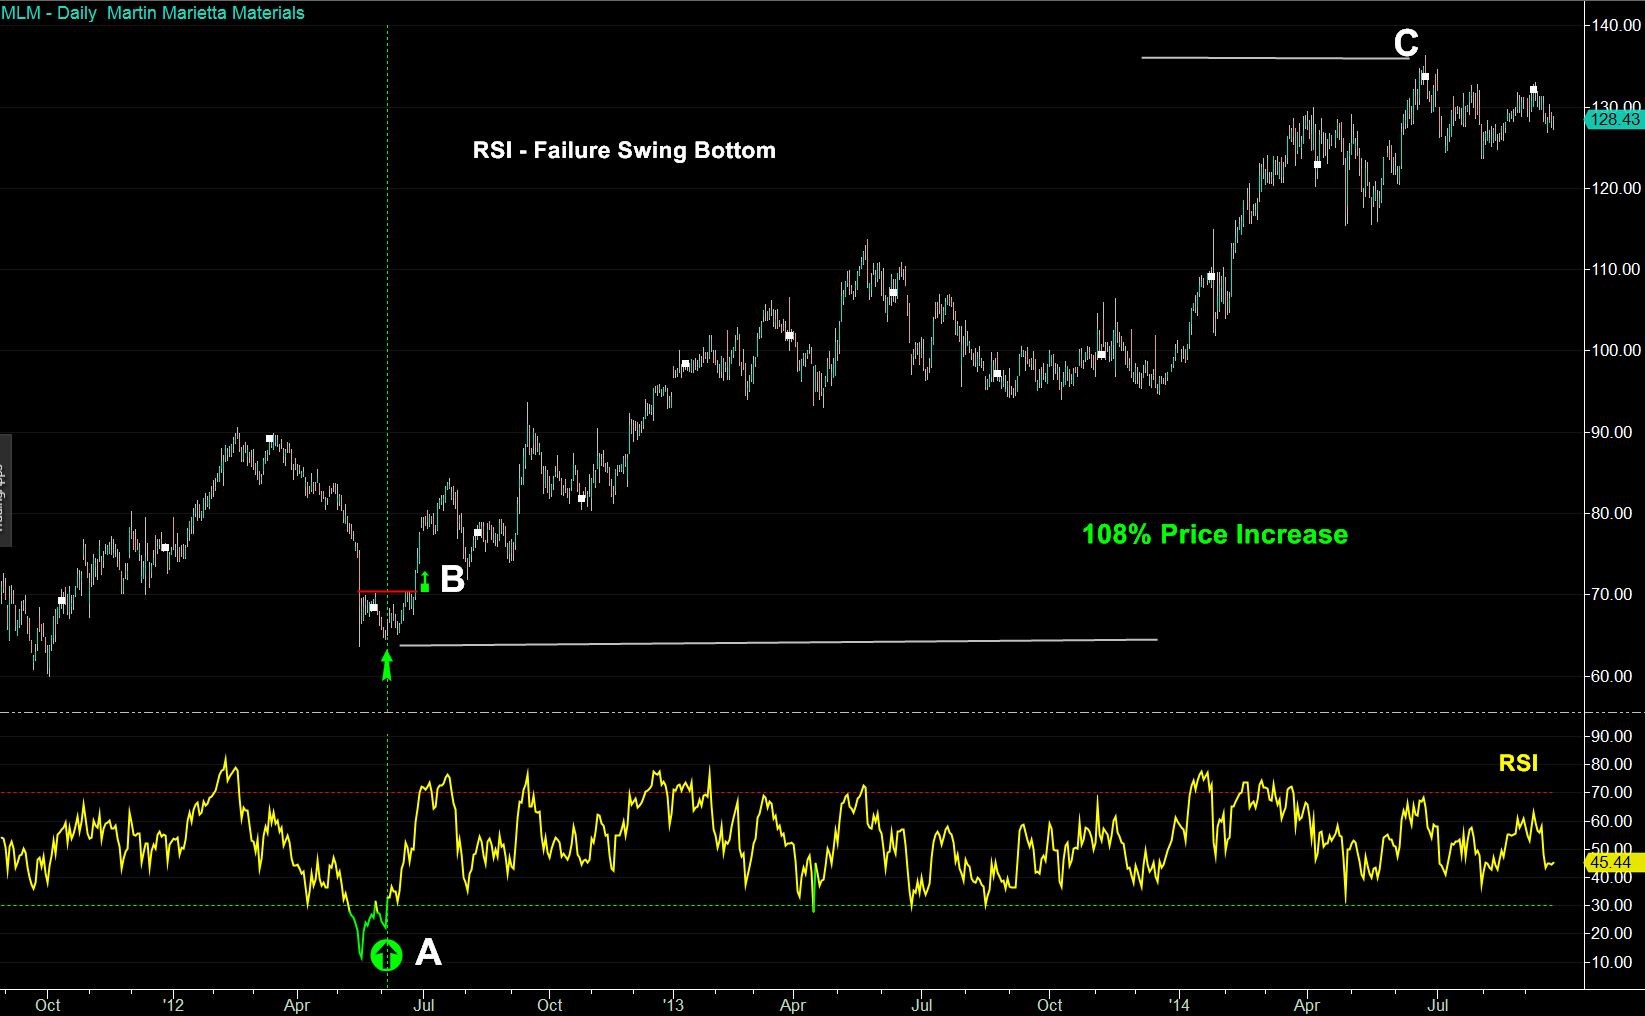
Figure 7 shows that in October 2006 Starbucks Corp. (SBUX) flashed a bearish RSI Failure Swing warning at point A. The price then reversed off a “bullish whipsaw” and started to weaken. Confirmation of the downtrend would occur when the upward trend at point (B) is breached. This led to a 75% loss is SBUX over the next two years (C).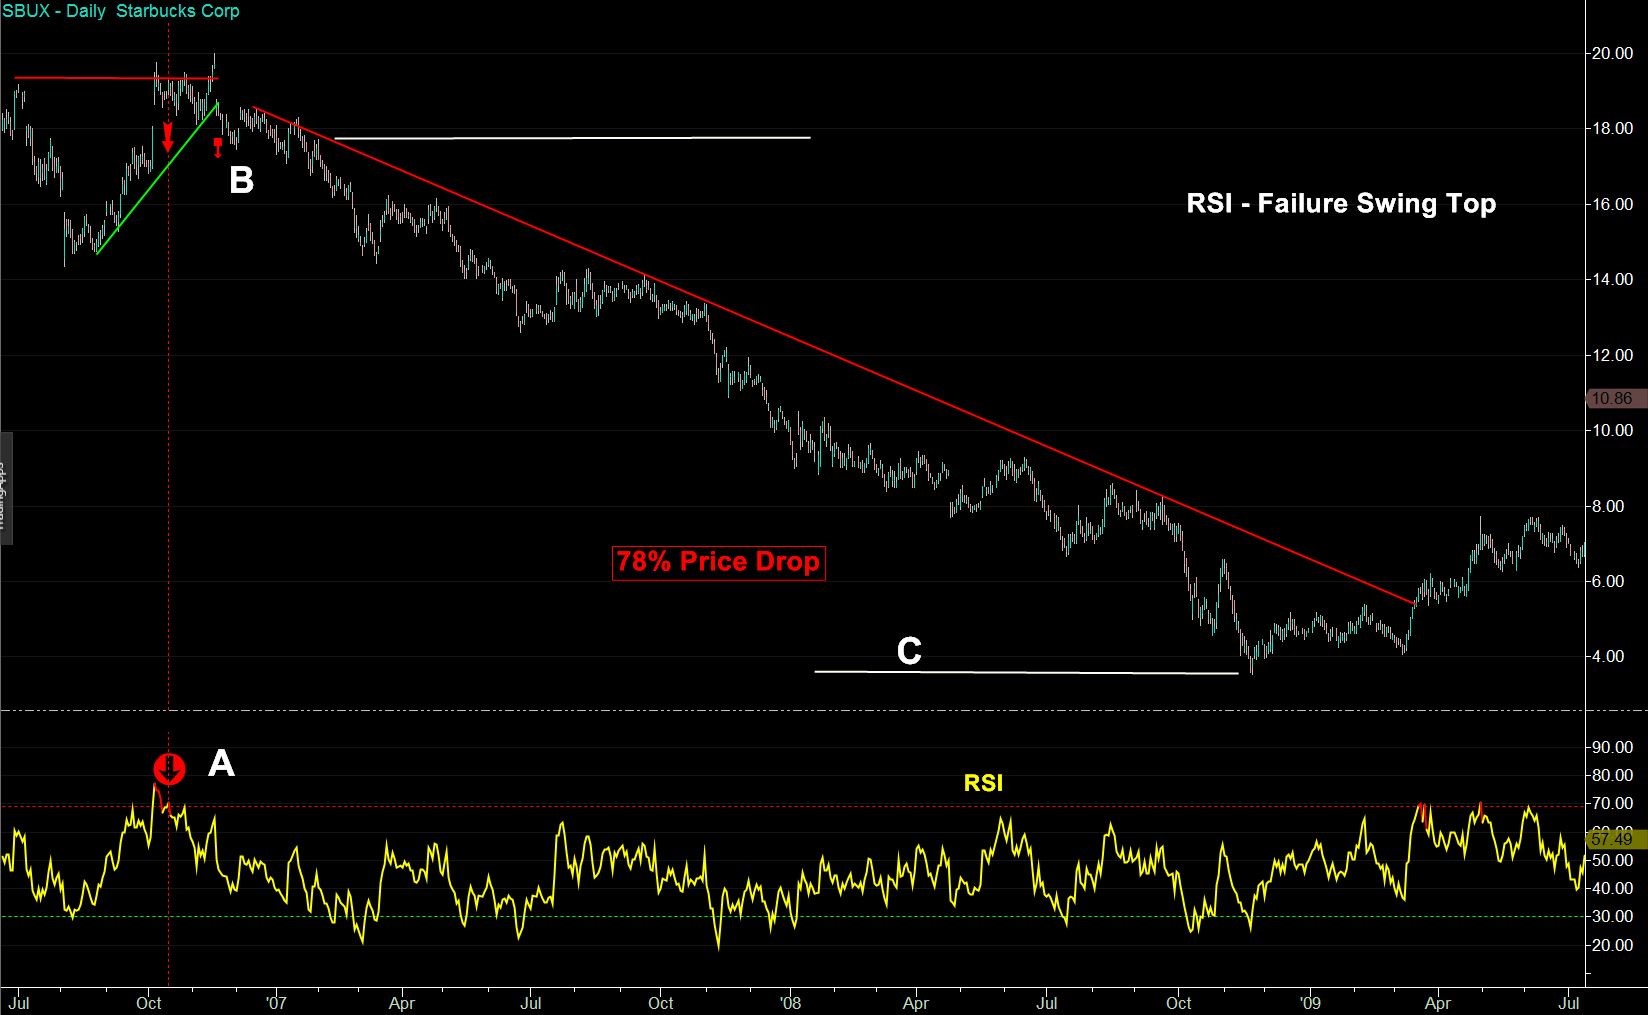
An alternate method of deriving execution signals from crosses on the overbought/oversold levels themselves is by utilizing crosses of RSI through a slowed moving average (MA) line of itself within the overbought/oversold levels. This is similar to techniques used with the moving average convergence/divergence (MACD) and stochastics indicators.
For this approach, a user first plots a moving average of RSI in the same pane as in the indicator itself. The signal is then generated when RSI crosses up through the slowed smoother MA line from oversold levels or when RSI crosses down through the slowed MA line from designated overbought levels.
On the positive side, with this method you should get in and out of a position earlier if the movement is indeed reversing. On the negative side, with this approach you will get more premature false signals.
In my opinion, the negatives outweigh the positives with this approach, at least when using the conventional faster RSI settings. This is because RSI is designed to be a leading and anticipating indicator, and, as covered earlier, conventional readings with the RSI indicator already tend to give false premature reversal signals against the prevailing trend.
Therefore, it is important for RSI users to remember the basic tenet of Dow Theory to “assume that the current trend is intact until the weight of technical evidence dictates otherwise.” With this reasoning, you would have to question if utilizing enhanced techniques that further anticipate an already leading indicator against a prevailing trend is the most prudent approach.
Figure 8 is a daily chart of Realty Income Corp. (O), with the RSI indicator (yellow line) plotted, along with a seven-period EMA of RSI (cyan line), both in the lower pane. By utilizing crosses of RSI over its exponential moving average (EMA), as opposed to crosses of RSI from designated overbought and oversold levels, you can clearly see how this approach can generate earlier signals. Following the long entry signal with this method, you would have gotten in at a lower price (saving $1.17), by purchasing at the close of line A ($37.08), as opposed to the closing price at line B ($38.25). Similarly, the sell (or shorting) signal would have saved another $0.77, with executions at the higher prices of the close of line C ($44.42), as opposed to the closing price at line D ($43.65).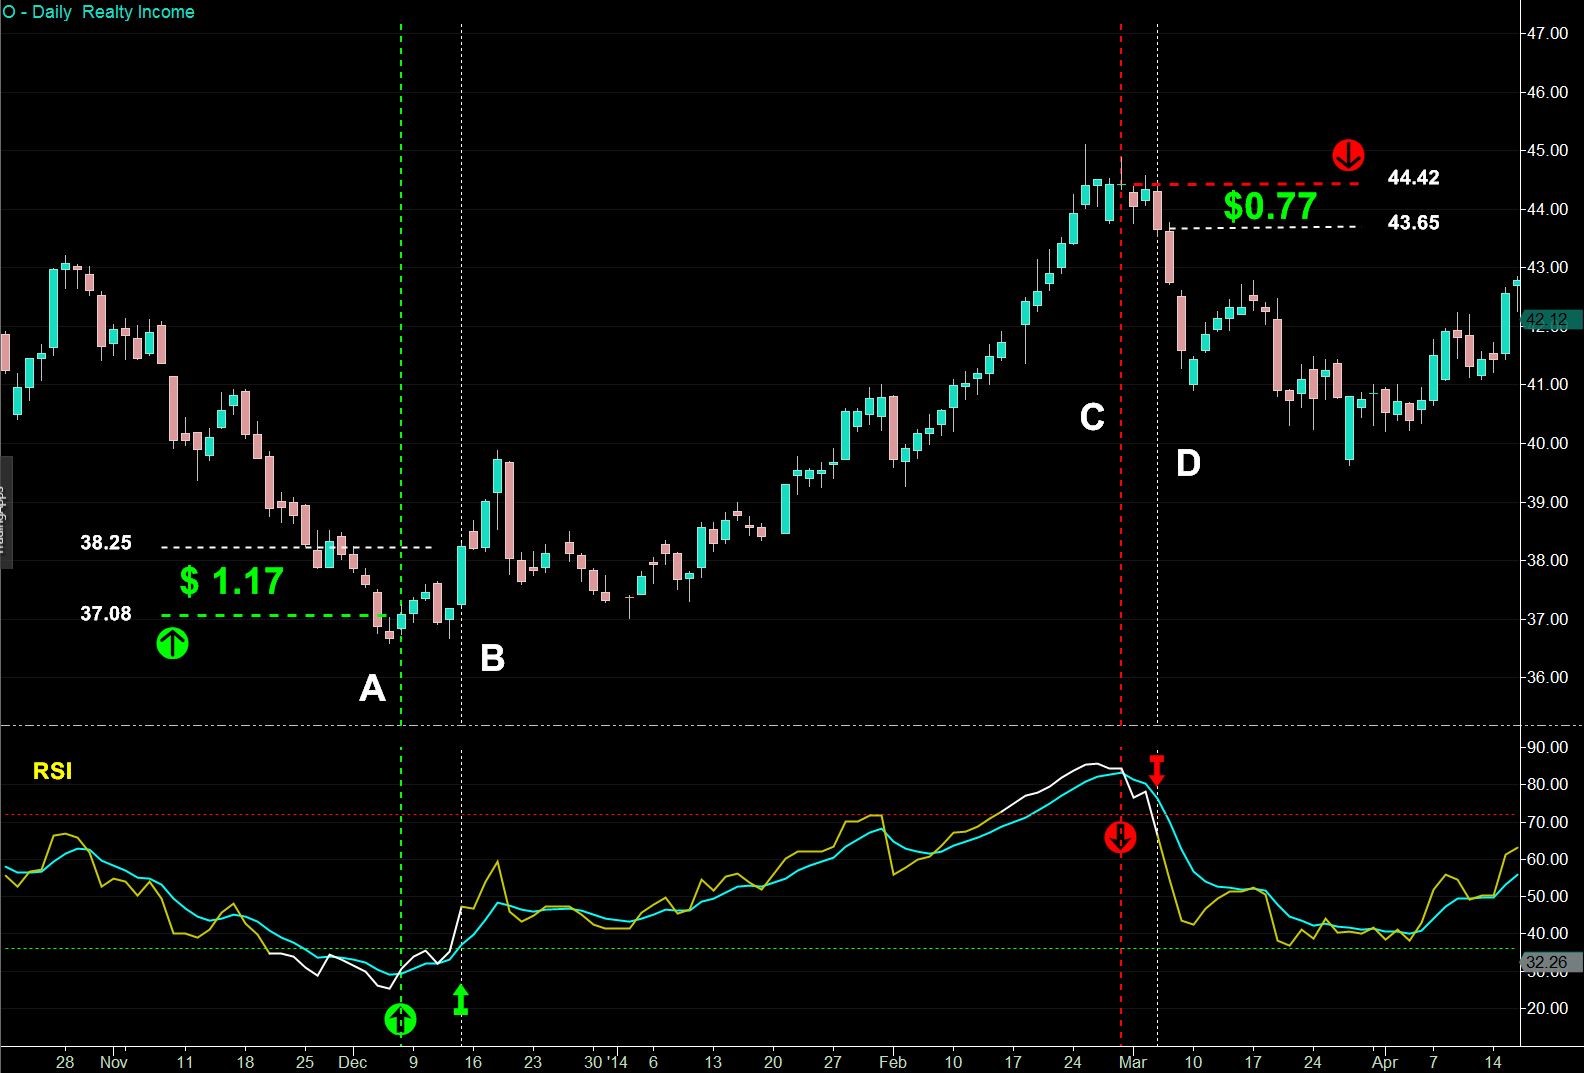
Many technicians feel that one of the more relevant and important signals to watch for with RSI is that of a price/indicator divergence. An RSI divergence occurs when the indicator and price action are heading in different directions. Stated another way, a divergence occurs when the indicator is failing to confirm the directional movement of the price action. When these divergent patterns form, they are usually interpreted as an early warning sign that the existing trend may be about to change. Divergences that form at more stretched or extreme levels are weighted more heavily and considered more relevant.
A bullish divergence occurs when price continues declining (lower lows) but RSI is not following, by forming a higher low (or equal low). In this situation RSI is “indicating” less downside price momentum than before, even though prices are still falling. Bullish divergences that form at RSI oversold levels (<30) are considered more relevant and noteworthy.
Figure 9 shows LyondellBasell Industries N.V. (LYB) displaying a six-month RSI bullish divergence, signaling a potential looming change in direction. A strategic entry at point D, where there is horizontal support and a converging upward trendline, would be a logical area to focus on. Experienced investors might also notice and anticipate the potential forming of the right shoulder of a strong inverse head and shoulder pattern, which later developed.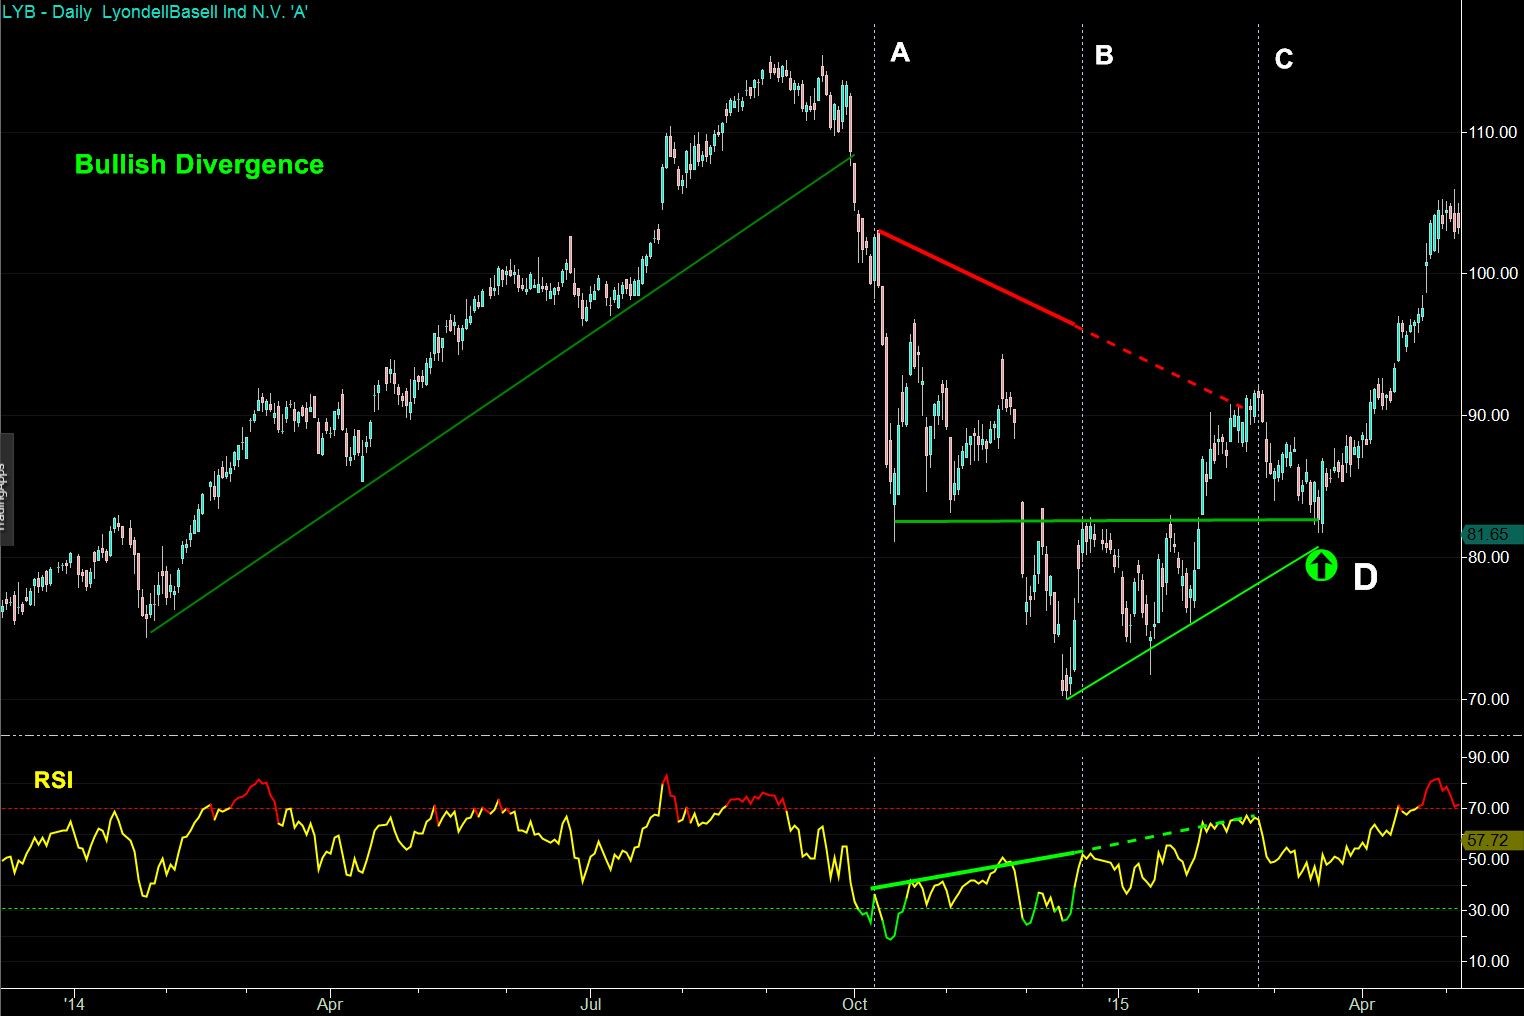
A bearish divergence occurs when the price continues rising (higher highs) but the RSI is not following, by forming a lower high (or equal high). Here RSI is “indicating” less upside price momentum than before, even though prices are still rising. Bearish divergences that form at RSI overbought levels (>70) are considered more relevant and noteworthy.
Figure 10 shows Expedia Inc. (EXPE) forming a classic five-month RSI bearish divergence at the end of a long and prolonged uptrend. Even though the RSI was “forecasting” a change in the upward trend, key technical confirmation does not occur until the confirmed price trendline break at point A. This reinforces a key concept that indicators in general are better at giving early warning signals and that the price action is the ultimate determining factor.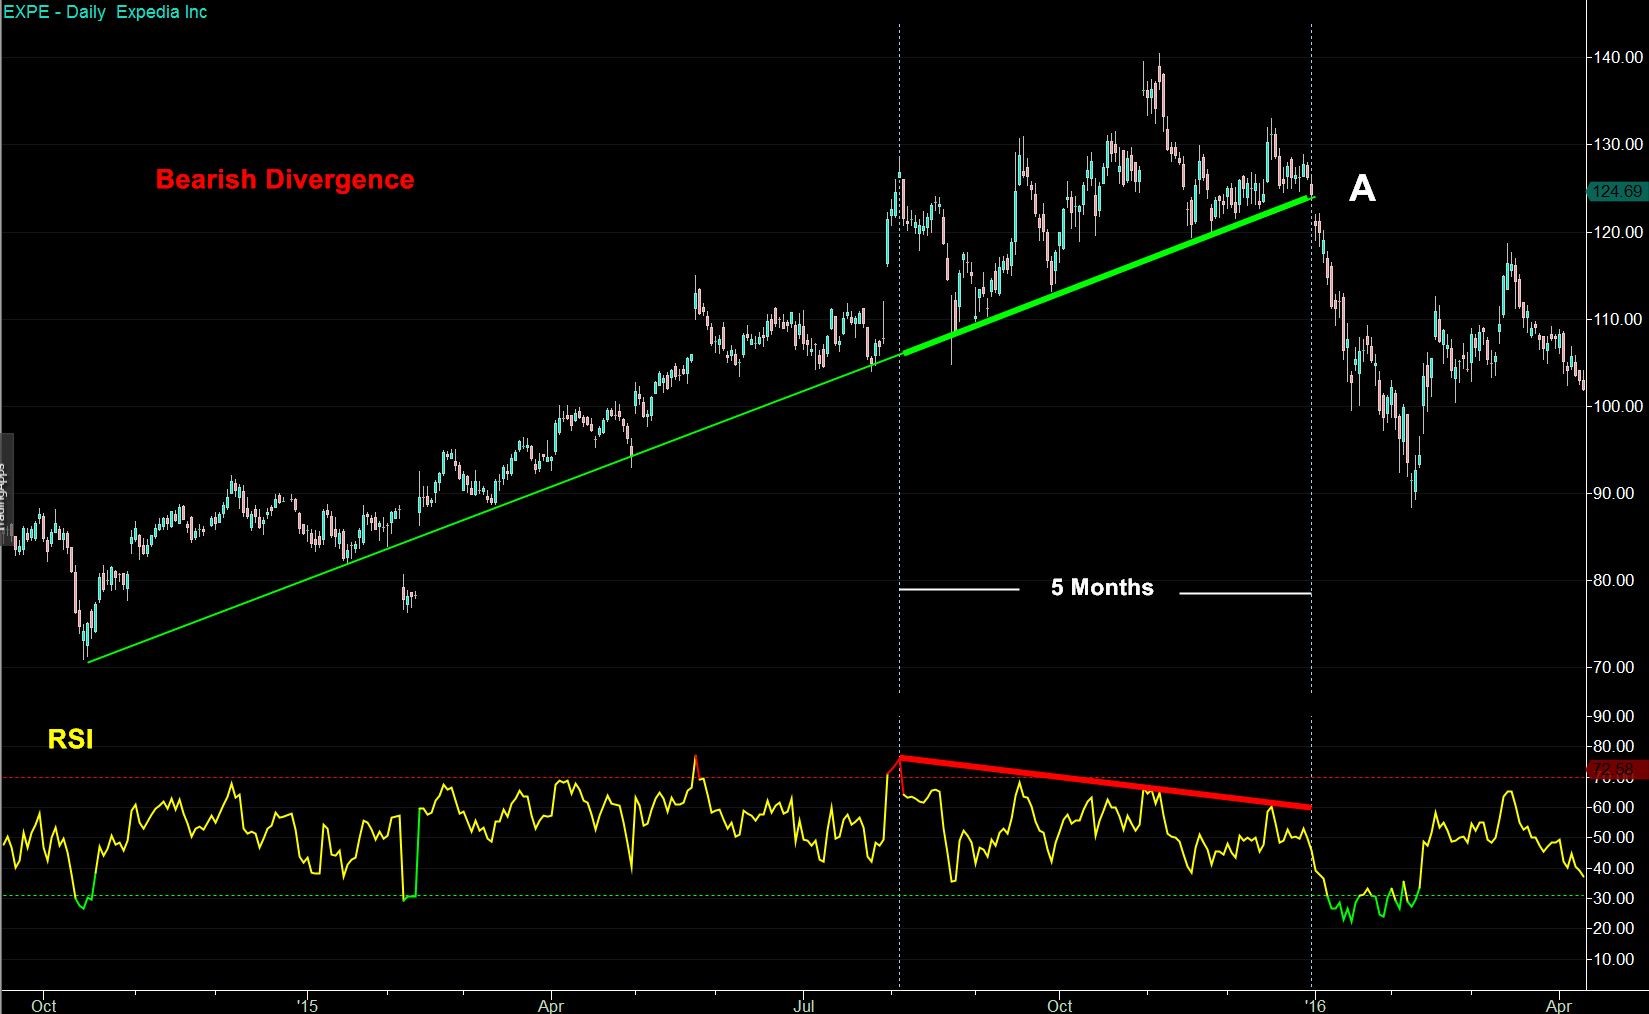
It is important to remember that RSI divergences, although noteworthy are considered a secondary classification signal. Reductions in momentum are common even in strong, healthy sustainable upward/downward price trends that often continue. The price action should always take precedence for the final call.
To provide a complete study of the RSI indicator, I briefly touch upon on another interpretation proposed by Andrew Cardwell using RSI. These formations, called positive and negative reversals are for confirmation of the primary trend.
By definition, a positive reversal occurs when the price makes higher lows and the RSI makes lower lows, preferably in the lower 30 to 50 RSI range. Here we have prices rising and RSI momentum falling—a bullish reading.
By definition a negative reversal occurs when the price makes lower highs and the RSI makes higher highs, preferably in the upper 50 to 70 RSI range. Here we have prices falling and RSI momentum rising—a bearish reading.
With this technique, it is believed that positive reversals occur more often in upward price trends and that negative reversals occur more often in downward price trends. When these formations appear, they are interpreted as “evidence” that the prevailing trend is more likely to continue its primary path. Because this is confusing to Wilder’s RSI divergence interpretation of likely reversals, my study will come to a close with one example.
Figure 11 shows Johnson & Johnson (JNJ) displaying a positive reversal, with the price forming higher lows and the RSI’s momentum forming lower lows over a five-month period in 2013. This is interpreted as a bullish continuation of the upward trend, with future prices still rising despite the RSI’s falling momentum.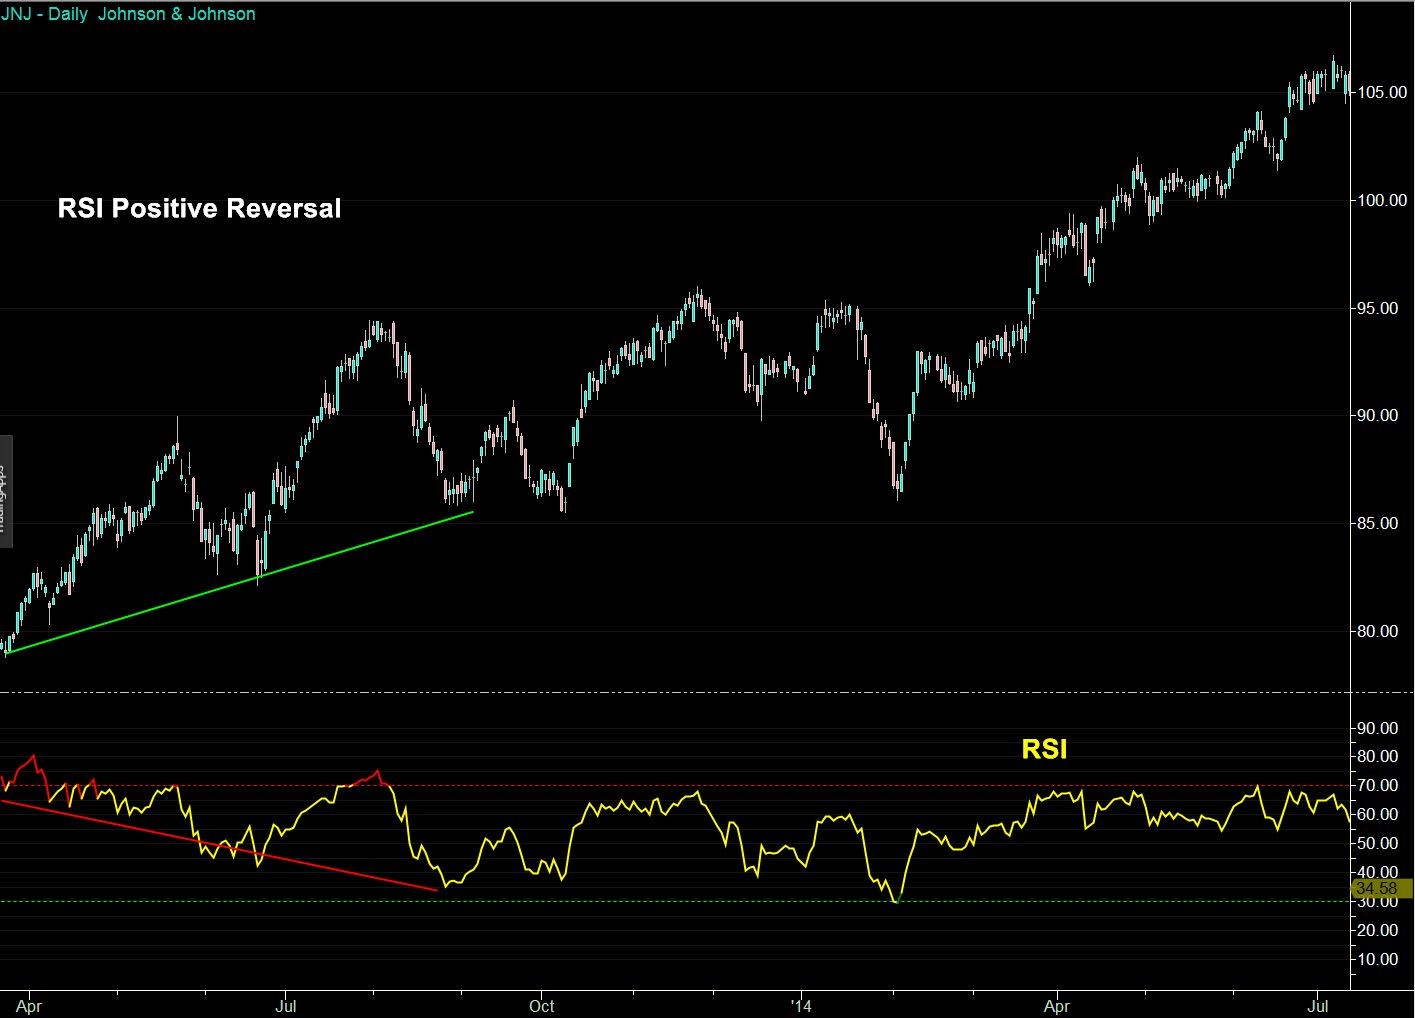
After now covering failure swings and divergences, it should be obvious that RSI is an indicator that responds well to classic support and resistance trends. Plotting these lines on the RSI indicator itself often adds clarity to readings that are sometimes difficult to see on the actual price action above. In fact, very often the key RSI overbought level (70) acts as formidable overhead resistance and the RSI oversold level (30) can act as a strong boundary of support. Even RSI 50 levels can seem to act as a secondary support and resistance barrier with the prevailing price trend.
In Figure 12, the SPY chart shows a number of examples of support and resistance on RSI. Notice how the peaks of the RSI tend to oddly align, forming straight lines. Also, notice that when breaks of these RSI lines occur, larger price movements seem to co-occur. You can see this on line A (bullish) and line B (bearish). Note how at line C, it aligns very nicely with the RSI’s oversold level of 30, acting as a double support barrier. At line D, there is a well-established RSI resistance line occurring at the overbought level of 70. This RSI resistance line, along with an established RSI bearish divergence, eventually led to an upward trend price break at point E.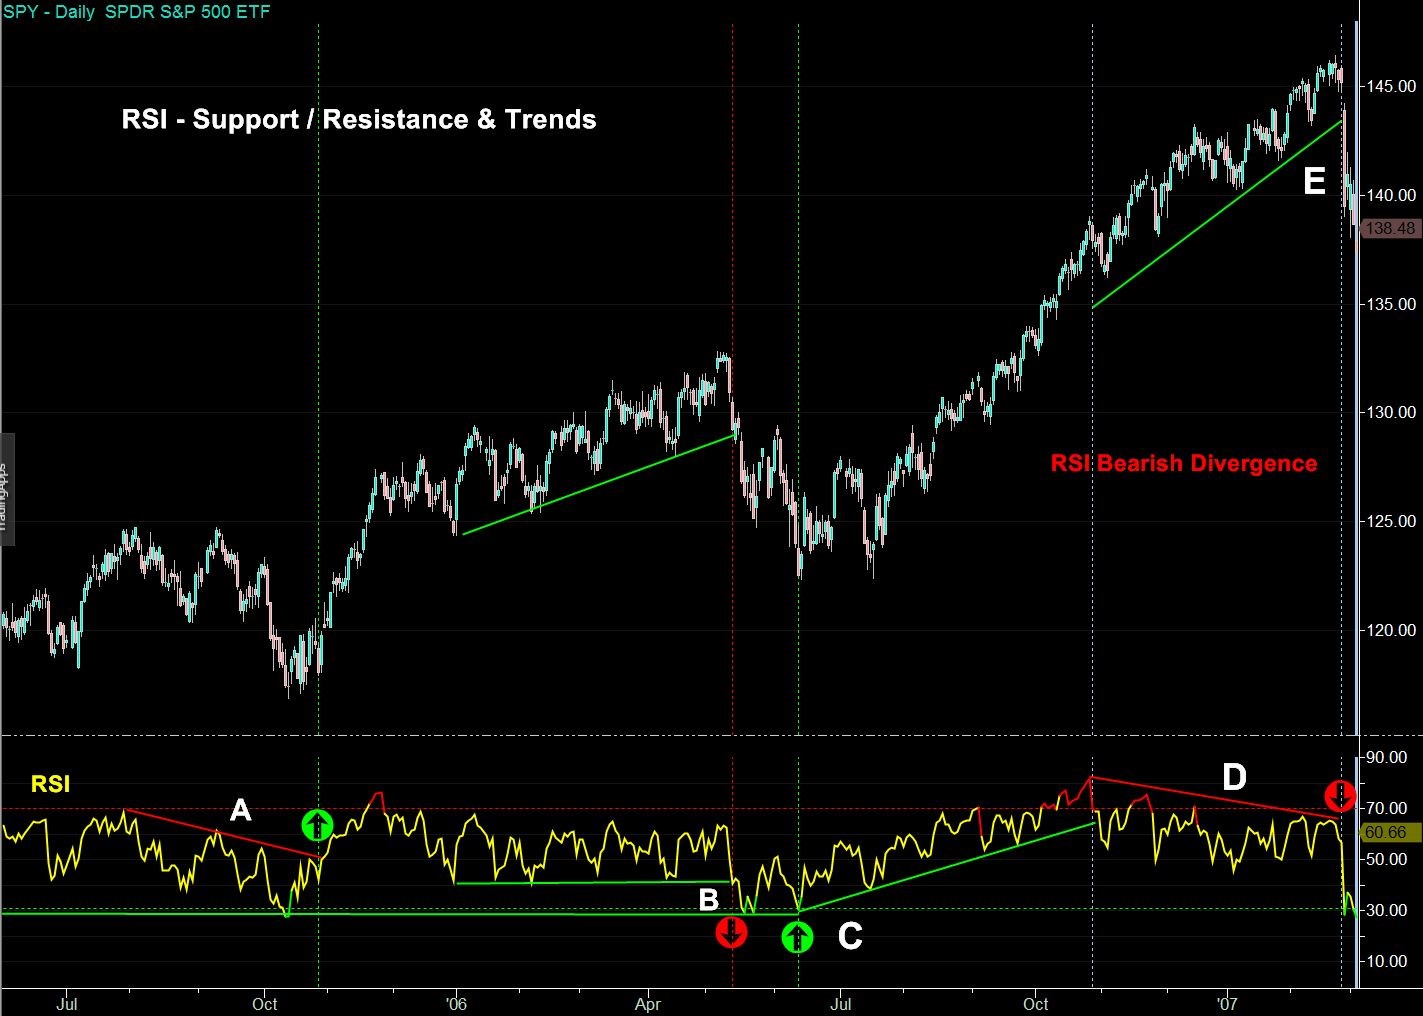
As you may expect because of the similarities to RSI failure swings, the analysis on RSI’s actual plot with classic continuation and reversal patterns also responds very well.
Figure 13 shows Avery Dennison Corp. (AVY) with the RSI forming a beautiful bullish inverse head-and-shoulder pattern (A and B). Although, it did not occur at the exact price bottom, AVY’s price then formed a prolonged bottom, with price rising by more than 100% over the next 28 months.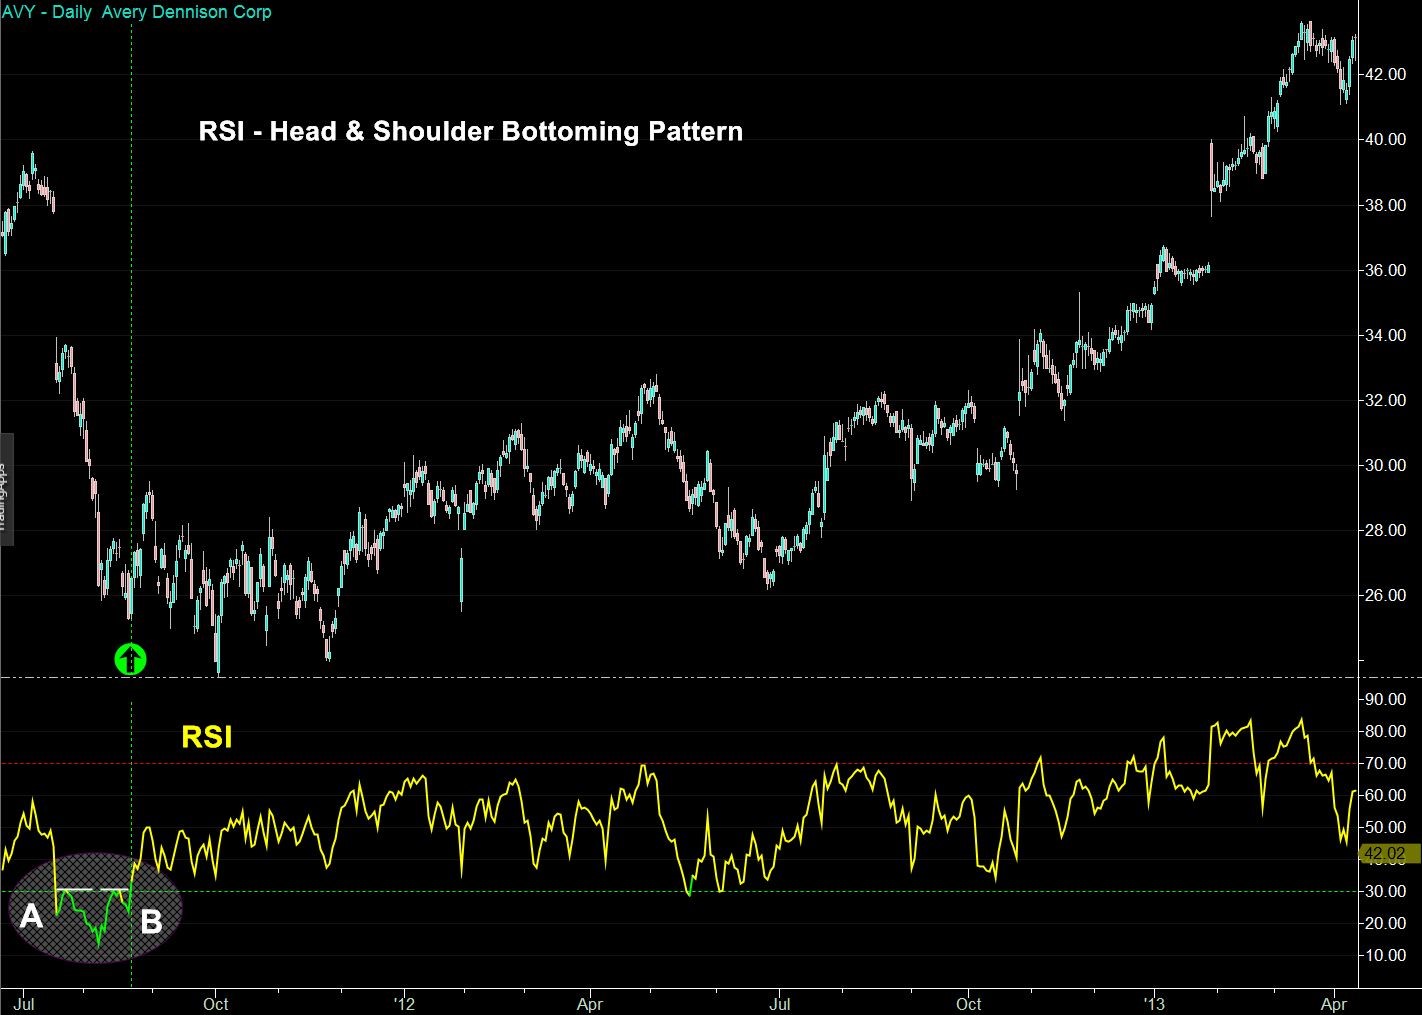
Figure 14 shows UnitedHealth Group (UNH) with the RSI forming an ugly bearish head and shoulder pattern. In this case, the break of the RSI neckline aligned perfectly with UNH’s recent price highs. Following this break, UNH dropped a whopping 75% over the next nine-month period.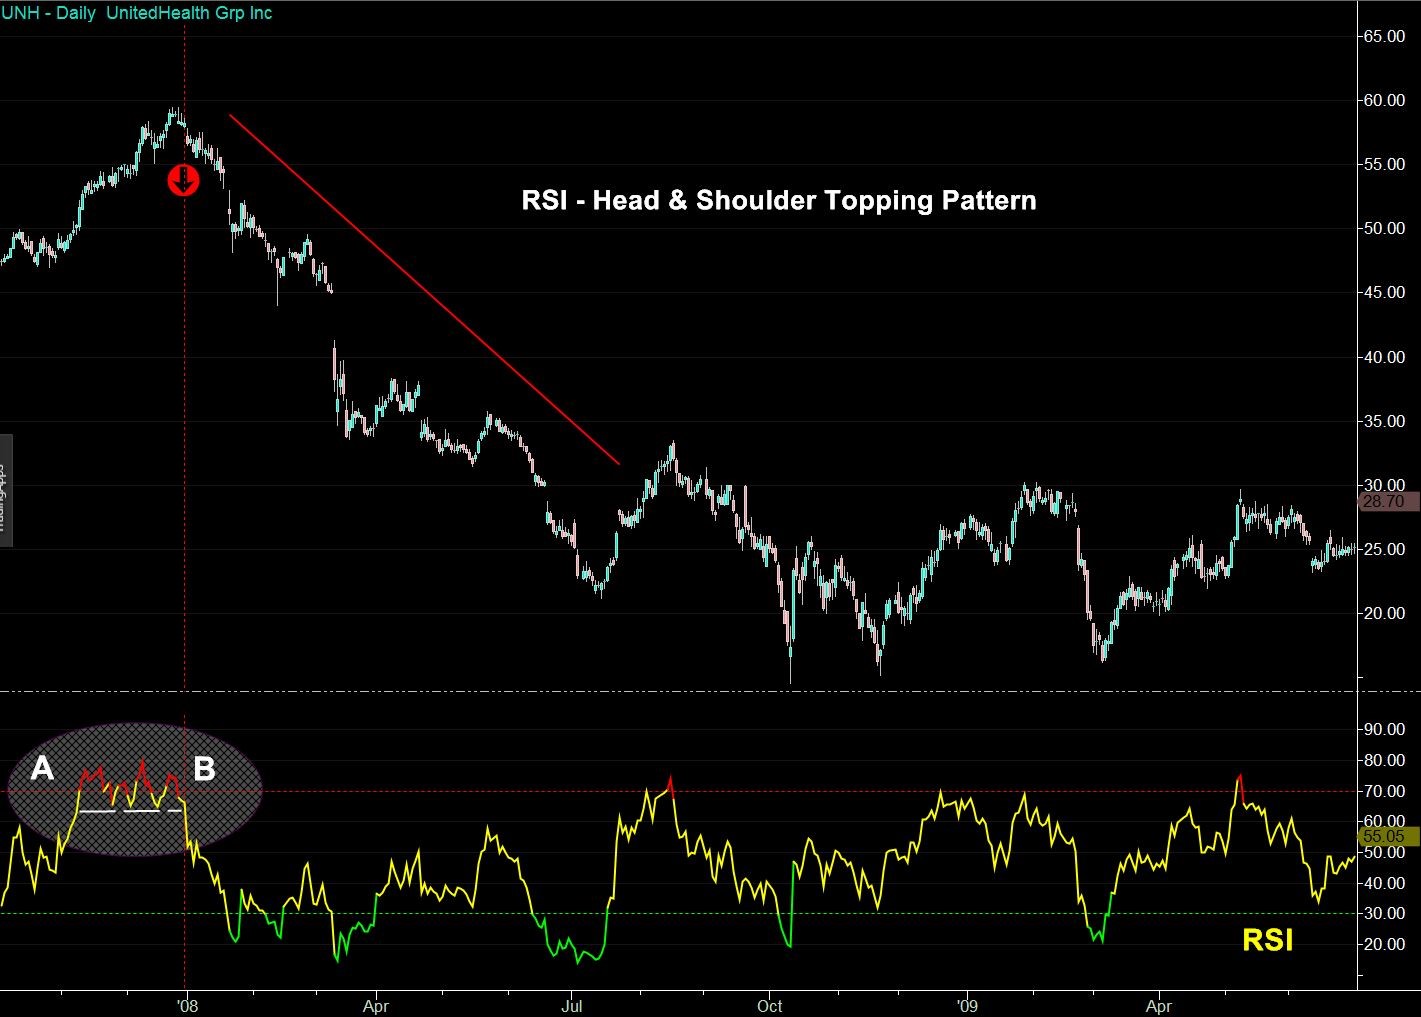
In truth, many indicators often claim many of these support/resistance and pattern association benefits. Although in the case with RSI, many experienced users report that these techniques have merit, giving the RSI user additional and significant analysis value.
As reflected in the opening articles of this Classic Technical Indicators series (The Basics of the RSI, Inside the Numbers of RSI), scanning with indicators seems to be an underutilized function for those newer to technical analysis and investing strategies. The use of indicators for assisting with secondary price analysis is certainly their primarily application but scanning with indicators can be a valuable secondary benefit.
In this area, how you use RSI (and other indicators) for scanning will be highly dependent on your specific approach to the markets. Those investors implementing a “bottom-up” investing approach who prefer to focus on specific stocks based on fundamentals and other reasons would certainly benefit more from direct indicator analysis on specific issues, as covered in this article.
For pure technical traders or perhaps those investors who may be more inclined to utilize a “top-down” investment approach and are looking for oversold/overbought issues in a specific targeted industry, scanning with indicators certainly offers an enticing and efficient option.
With today’s technology, there are numerous scans and tools available to today’s investors. These scanners are extremely effective in refining a large targeted index of components to a list of attractive fundamental-based (AAII’sStock Investor Pro) candidates. From here you can use a technical-based scanner to further reduce these candidates into an even smaller and more manageable list of issues that are currently exhibiting specific desired technical characteristics. Regarding RSI, there are numerous scanning capabilities, such as searching for issues exhibiting specific crosses or those that are currently overbought or oversold.
Figure 15 is an example of scanning with RSI within TradeStation’s real-time scanner RadarScreen. In this view, you can see some strategically selected RSI measurements on each of the individual stocks of the S&P 500.
Displayed are:
With today’s scanners and technology with platforms like TradeStation and MetaStock, the scanned criteria, amount and type of data populated and alerts are totally customizable and essentially limitless.
When scanning with the RSI indicator, you can also look to synergize the RSI benefits by further refining issues with other desirable characteristics such as: other indicators signaling overbought/oversold levels or changes in momentum, strong relative strength, gapping, high volume, high or changing short interest, noteworthy option activity etc.
Although this article focused on six RSI interpretations and applications, it should be obvious that there are numerous other methods to utilize and interpret the RSI indicator. If you factor in that there are many variances to each of these individual applications, then it is easy to see why RSI can be not only so potentially useful but also so potentially overwhelming.
Advice for those new to RSI is simply to learn the basic concepts and to start with the conventional applications and parameters to gain a feel for the indicator. In the fourth part of this RSI series, I will examine which specific methods and settings have worked best in the past. Included in this section will be very detailed backtesting statistics on all of the S&P 500 stocks over a 13-year (0% market return) period. Supplied information will include: Which RSI parameters worked best and at what overbought/oversold levels. Measurements will include: total return, number of trades, hit ratio, win/loss return ratios and sharp ratios.
For the more advanced RSI users, experimenting with more unorthodox and esoteric methods can be beneficial if contoured appropriately to their specific approaches and style. In the fourth part of this RSI series I will also look at a number of interesting parameter-altering relationships and cover some guidelines on effectively contouring them to specific situations.
Technical Analysis

Technical Analysis

Edward Emory from TN posted over 8 years ago:
Paul Hartmann from NY posted over 8 years ago:
You need to log in as a registered AAII user before commenting.
Log InCreate an account