


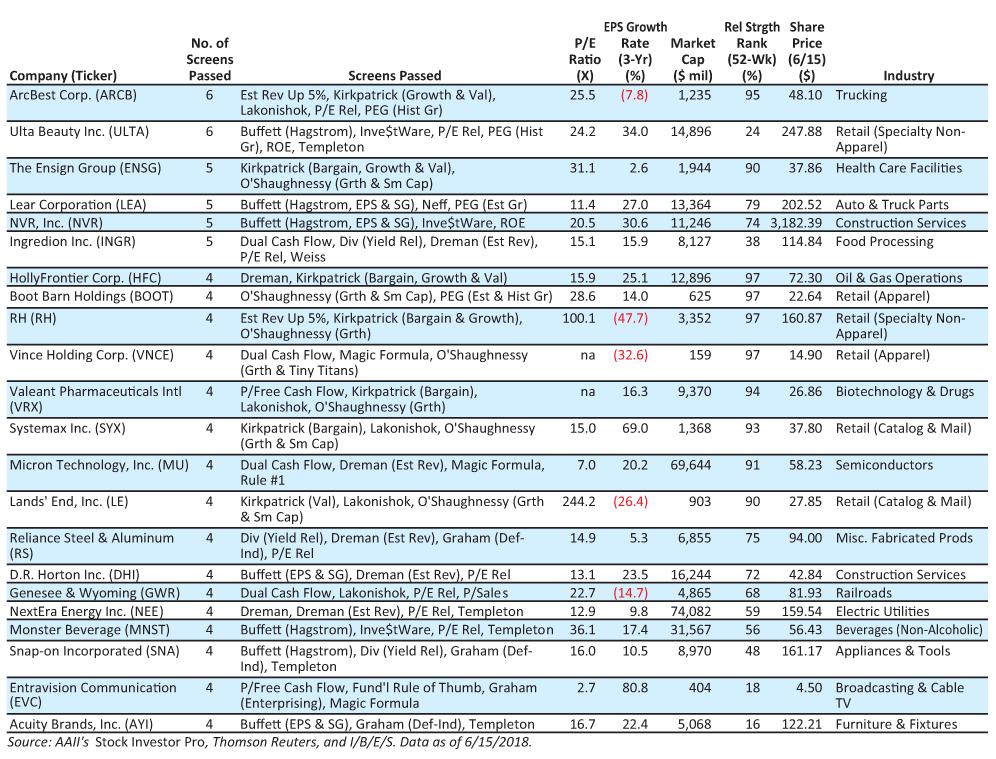
The First Cut this issue lists the stocks that passed the greatest number of screens tracked by AAII on the Stock Ideas section of AAII.com.
This process is accomplished by examining the results of every screen and identifying stocks passing more than one strategy
As of June 15, 2018, 855 stocks passed at least one of the screens tracked by AAII, but only 22 stocks passed four or more screens and they are the stocks that made the First Cut this month. Note that some screens did not have any companies that passed at the time of the analysis.
The stocks in the table are first ranked by the number of screens passed and then by their 52-week relative price strength rank. The percentile rank shows how a particular company’s price gain compares to all domestically traded companies. With price momentum, a higher relative strength percentage rank is usually desired.
The table lists the price-earnings ratio (price divided by trailing earnings per share) as a basic valuation measure.
The annual earnings growth rate provides a simple historical indication of the bottom-line company performance over the last three years.
The market cap (number of shares outstanding times the share price) is a common way to measure the size of a firm.
While you cannot automatically consider a group of consensus stocks to be a diversified portfolio, they may present a good First Cut for constructing your personal portfolio. Optimally, the group of screening approaches a stock passes is diverse enough to capture unique, yet desirable qualities.
Further information on each of the screening strategies can be found at the Stock Ideas area of AAII.com.
—John Bajkowski, AAII president

Related

Stock Strategies
Going From Stock Screen to a Real Portfolio
Related

AAII Stock Ideas
Constructing Winning Stock Screens
Discussion
FREE REPORT

Get your free copy of our special
report analyzing the tech stocks
most likely to outperform the
market.
Doug from NY posted over 8 years ago:
Ken from WI posted over 8 years ago:
Dennis Ahr from MD posted over 8 years ago:
You need to log in as a registered AAII user before commenting.
Log InCreate an account