


Related

Growth Investing
Our annual review of the AAII screening strategies finds MAGNET Complex on top after being the worst performer in 2016.

Wayne Thorp leads a class in AAII's new Essential Investing Video Course. Go to https://www.aaii.com/ves for more information and to subscribe.
Article Highlights:
• 53 of our 63 stock screening strategies realized positive year-to-date returns through the end of November, with 25 besting the S&P 500.
• The MAGNET Complex rebounded from a lousy 2016 with a gain of 150.7% during the first 11 months of 2017.
• Investors displayed a risk-on stance, with growth and momentum strategies outperforming value strategies.
The first year of the post-Trump election was one of the best years for stocks.
At the one-year mark of Donald Trump’s win in the U.S. presidential race, the Dow Jones industrial average posted its biggest post-Election Day gain in more than 70 years. The Dow advanced 28.5% between the close on November 8, 2016, and the close on November 8, 2017. That represents its best performance following a presidential election since 1945, when the blue-chip index was up 29.8% in the year following the re-election of Franklin Roosevelt and the fourth-best results in the year following a presidential election since the Dow made its debut in 1896. Calvin Coolidge enjoyed the best one-year return in the Dow with a 52.1% gain following his November 4, 1925, victory, according to MarketWatch.com. On the other end of the spectrum, Woodrow Wilson saw the Dow fall 33.3% in the year following his election on November 7, 1917. According to the WSJ Market Data Group, the average 12-month gain following Election Day is 6.0%.
The other major U.S. stock indexes also fared very well, thanks to the “Trump Trade.” The S&P 500 index was up 21% in the year following Trump’s election. This was the fourth-best 12-month gain for the large-cap index following a presidential election since 1936, according to Goldman Sachs. For the S&P 500, the average market return in the first year of a president’s first term is 6.6%, according to Charles Schwab data that goes back to 1932.
2017 Investment Thesis: “Risk On”
Many of the gains since the election have been concentrated in two sectors: technology (up 42.2%) and financials (37.5%), according to MarketWatch.com. Data from Goldman Sachs suggests that tech stocks alone have contributed to 37% of the S&P 500’s rise over the past year. However, 10 of the 11 primary S&P 500 sectors have posted gains in the year following November 8, 2016. The only industry to be negative is telecommunications, which was down 5.4%.
The strong performance of technology stocks in 2017 reflects the “risk on” nature of investors since last November. Risk-on risk-off is an investment setting whereby price behavior is driven by changes in investor risk tolerance. This risk tolerance, in turn, changes in response to global economic patterns. During periods when risk is perceived as low, risk-on risk-off theory states that investors tend to gravitate toward “higher-risk investments” and when risk is perceived as high, investors tend to shift to lower-risk investments.
Risk-on environments are often carried by a combination of expanding corporate earnings, optimistic economic outlook, accommodative central bank policies and speculation. As investors feel the market is being supported by strong influential fundamentals, they perceive less risk about the market and its outlook. Since election day last year, investors have had an increased appetite for risk. This stems from hopes of a legislative agenda from the new administration that will boost the economy, lower regulation and, ultimately, boost corporate profits.
Note, however, the increase in market volatility since early November as the Republican Congress tackles tax reform. As of this writing in mid-December, the devil now lies in the details as information emerges regarding the competing tax bills in the House and Senate.
2017 Performance of Strategies
AAII has been developing, testing, refining and tracking a variety of stock strategies for nearly 20 years. Many of the selection strategies follow the approaches of popular investment professionals, while others are tied to basic principles of investing. These approaches run the full spectrum, from those that are value-based to those that focus primarily on growth, while most fall somewhere in the middle.
The educational purpose of these stock selection strategies is to highlight what works—and what doesn’t work—when selecting stocks. While here we discuss, in-depth, the best- and worst-performing stock selection strategies for this year, you can also review the long-term performance and see how these strategies performed in up and down markets.
AAII screens following the approach of an investment professional do not represent their actual stock picks. The quantitative rules of each strategy are defined by our interpretations of their respective approaches. The results of the screening strategies, as well as the criteria for each screen, are programmed into AAII’s fundamental stock screening and research program, Stock Investor Pro, and are also posted in the Stock Ideas area of AAII.com.
Each month, over 60 separate screens are run using AAII’s Stock Investor Pro and the current companies passing each individual strategy are also reported in the Stock Ideas section of AAII.com. Stock Investor Pro subscribers can run the screens themselves daily with the software, while AAII members can access the screening results by going to the Stock Ideas area of AAII.com (www.aaii.com/stockideas). The results are posted to AAII.com on the 15th of each month (excluding holidays and weekends) using data from the previous month’s end.
In analyzing the performance of AAII stock strategies this year, several trends emerge. The performance of the screens as a group reflect the strong year for stocks in general, with 53 of the 63 different strategies that AAII tracks posting gains for the year through the end of November, matching last year’s total. However, out of these 53 methodologies, only 25 outperformed the S&P 500’s 18.3% year-to-date price gain. The median price change of all AAII stock strategies through November 30, 2017, was a 15.5% gain, compared to a price gain of 16.1% for the same set of screens last year. One screening methodology, the MAGNET Simple Revised approach, posted its best year ever over the backtesting period beginning in 1998 with a 66.7% gain. None of the AAII screens posted their worst annual return.
Table 1 summarizes the performance and variability of the stock screens tracked on AAII.com, ranked by year- to-date price change through November 30 (see the box “The AAII Stock Screens” for more information about them). All the screening strategies AAII tracks have been developed and backtested using Stock Investor Pro and all but two—the Dogs of the Dow and Dogs of the Dow Low-Priced 5 screens—are pre-built into the software. Table 1 presents the price change performance (excluding dividends and transactions costs, such as commissions, bid-ask spreads, time and price slippage, etc.) over various time periods for each stock screening strategy. The table also includes the style category used to categorize the screens on AAII.com (see the bottom of the table for an explanation of the initials).
Table 1. Stock Screens on AAII.com Ranked by 2017 YTD Performance
For 2017, an approach that blends value, growth and momentum investing styles—the MAGNET Complex methodology—led all strategies with an extraordinary 150.8% gain. Another approach, Philip Fisher’s strategy that seeks out quality growth companies, posted a 101.4% gain through the end of November.
The year 2017 was a good year for growth and momentum investing, reversing last year’s dominance of value-oriented strategies. Large-cap growth was the big winner for the year, as the S&P 500 Growth index experienced a total return—including dividends—of 26.7% through the end of November. In comparison, the index posted a total return of only 6.9% for all of 2016. Reflecting the strong year tech stocks have had, the Nasdaq 100 index, which includes the 100 largest non-financial companies listed on the tech-heavy Nasdaq Stock Market, posted a price gain of 30.9% through the end of November.
Table 2. Median Multiples for Market-Cap Indexes
| End of Year | Price-Earnings (X) | Price-to-Book (X) | Price-to-Sales (X) | Dividend Yield (%) | ||||||||
|---|---|---|---|---|---|---|---|---|---|---|---|---|
| S&P 500 |
S&P Mid Cap |
S&P Small Cap |
S&P 500 |
S&P Mid Cap |
S&P Small Cap |
S&P 500 |
S&P Mid Cap |
S&P Small Cap |
S&P 500 |
S&P Mid Cap |
S&P Small Cap |
|
| 1998 | 23.3 | 19.3 | 18.0 | 3.07 | 2.49 | 2.03 | 1.46 | 1.22 | 0.97 | 1.5 | 0.9 | 0.0 |
| 1999 | 22.2 | 17.0 | 16.6 | 3.08 | 2.10 | 1.89 | 1.52 | 1.13 | 0.90 | 1.5 | 0.9 | 0.0 |
| 2000 | 20.7 | 18.4 | 15.1 | 3.11 | 2.49 | 1.85 | 1.59 | 1.29 | 0.91 | 1.1 | 0.3 | 0.0 |
| 2001 | 24.2 | 22.1 | 20.1 | 2.76 | 2.35 | 1.95 | 1.53 | 1.33 | 1.05 | 1.2 | 0.3 | 0.0 |
| 2002 | 20.6 | 18.5 | 18.0 | 2.27 | 1.91 | 1.63 | 1.91 | 1.19 | 0.97 | 1.2 | 0.1 | 0.0 |
| 2003 | 22.3 | 21.6 | 22.2 | 2.82 | 2.34 | 2.09 | 1.64 | 1.53 | 1.26 | 1.2 | 0.4 | 0.0 |
| 2004 | 20.8 | 21.9 | 23.6 | 2.89 | 2.50 | 2.20 | 1.77 | 1.59 | 1.38 | 1.1 | 0.5 | 0.0 |
| 2005 | 19.0 | 21.0 | 21.0 | 2.80 | 2.53 | 2.15 | 1.69 | 1.50 | 1.24 | 1.2 | 0.6 | 0.0 |
| 2006 | 19.4 | 20.0 | 21.5 | 2.89 | 2.51 | 2.28 | 1.73 | 1.41 | 1.44 | 1.2 | 0.8 | 0.0 |
| 2007 | 18.1 | 18.7 | 18.9 | 2.93 | 2.38 | 1.96 | 1.59 | 1.38 | 1.25 | 1.4 | 0.7 | 0.0 |
| 2008 | 11.7 | 12.8 | 13.8 | 1.67 | 1.37 | 1.20 | 0.91 | 0.82 | 0.71 | 2.1 | 1.2 | 0.0 |
| 2009 | 18.5 | 20.7 | 20.5 | 2.29 | 1.92 | 1.61 | 1.41 | 1.34 | 1.10 | 1.4 | 0.6 | 0.0 |
| 2010 | 17.8 | 20.3 | 21.7 | 2.46 | 2.15 | 1.79 | 1.64 | 1.51 | 1.30 | 1.3 | 0.8 | 0.0 |
| 2011 | 15.7 | 17.6 | 18.0 | 2.26 | 1.93 | 1.60 | 1.46 | 1.31 | 1.11 | 1.9 | 1.1 | 0.0 |
| 2012 | 17.3 | 18.6 | 19.5 | 2.38 | 2.02 | 1.72 | 1.62 | 1.41 | 1.14 | 2.0 | 1.2 | 0.0 |
| 2013 | 21.2 | 22.6 | 24.4 | 3.06 | 2.56 | 2.21 | 2.05 | 1.90 | 1.60 | 1.7 | 1.2 | 0.1 |
| 2014 | 21.5 | 22.5 | 23.8 | 3.18 | 2.49 | 2.12 | 2.18 | 1.83 | 1.51 | 1.8 | 1.3 | 0.6 |
| 2015 | 20.7 | 20.4 | 20.9 | 2.89 | 2.27 | 1.80 | 2.12 | 1.60 | 1.36 | 2.1 | 1.6 | 0.7 |
| 2016 | 21.5 | 22.9 | 25.6 | 3.20 | 2.49 | 2.23 | 2.42 | 1.94 | 1.59 | 1.9 | 1.3 | 0.4 |
| 2017* | 24.3 | 23.6 | 26.8 | 3.33 | 2.61 | 2.20 | 2.70 | 1.95 | 1.60 | 1.8 | 1.2 | 0.3 |
|
*As of 11/30/2017. Source: AAII’s Stock Investor Pro/Thomson Reuters. Data as of 11/30/2017. |
||||||||||||
In comparison, the S&P SmallCap 600 Value index had a total return of 11.9% year to date, versus its 31.3% total return last year. Also, indicative of the relative strength of larger stocks this year, the typical exchange-listed stock saw its share price rise by 14.2%. As of the end of November, the median market capitalization of all exchange-listed (non-OTC) companies in Stock Investor Pro was around $900 million.
As stock prices rose this year, so too did valuations rise from their levels of a year ago, although not universally or by the same magnitude, depending on the market-cap segment you are looking at. Table 2 shows the median trailing price- earnings (P/E) ratio, price-to-book-value (P/B) ratio, price-to-sales (P/S) ratio and dividend yield for the constituents of the S&P 500, S&P MidCap 400 and S&P SmallCap 600 indexes as of the end of each year from 1998 through 2016 and through the end of November for 2017. These figures are calculated by taking the median values of the stocks in each of these three S&P indexes that are tracked by Stock Investor Pro.
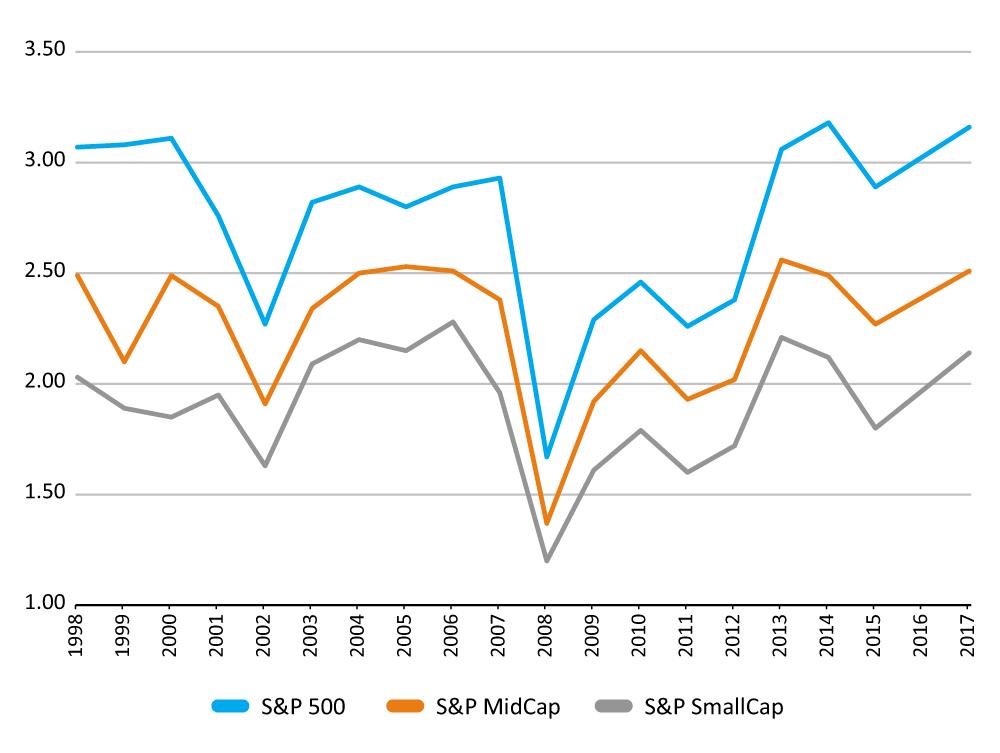
The chart in Figure 1 represents the trend in the median end- of-year price-to-book value ratios for each of the S&P market-cap indexes. Those trends generally mirror those exhibited by the multiples in Table 2. All three indexes have seen the median price- to-book ratio of their underlying stocks rise sharply since the end of the financial crisis of 2007–2009. The price-to-book ratios of the stocks in the three indexes fell to their lowest levels since 1998 at the end of 2008, with the S&P SmallCap 600 bottoming out at 1.20 and the S&P 500 sliding to 1.67. Figure 1 also shows that, compared to the late 1990s, the spread between price-to- book-value ratios for the indexes narrowed significantly during the Great Recession. Since 2008, the price-to-book ratios for the indexes have risen sharply, as have the spreads between them. As of the end of November, the median price-to-book ratio for the stocks in the S&P 500 index was 3.33, which is the highest since the end of 1998. The median price-to-book ratio for the S&P MidCap 400 stood at 2.61, which is also the highest level for the period. However, the 2.20 median price-to-book ratio for the stocks in the S&P SmallCap 600 is down from 2.23 at the end of last year and is below the highest level of 2.28 seen at the end of 2006.
For only the third time since 1998, an AAII stock screening strategy has gone from being the poorest performer one year to the top performer the next. This year the MAGNET Complex approach joins the MAGNET Simple (2008 to 2009) and the Murphy Technology (2003 to 2004) strategies in that category. Last year, the MAGNET Complex methodology lost 25.5% and then roared back with a 150.8% gain through the end of November.
AAII tracks four different MAGNET strategies, which are the brainchild of Jordan Kimmel, the managing member of the Magnet Investment Group LLC. Kimmel blends value, growth and momentum investing styles into a singular approach, which he termed the MAGNET Stock Selection Process. A MAGNET stock, according to Kimmel, offers a blend of technical and fundamental characteristics “that pull investors into shares, as though by magnetic attraction, resulting in rapid price increase.” Kimmel believes the MAGNET process “encompasses the best of the momentum aspects of the market, while demanding the downside protection of a value approach, and insisting on top-line revenue growth.”
The MAGNET acronym is as follows:
M—Management must be outstanding; momentum must be improving,
A—Acceleration of earnings, revenues and margins;
G—Growth rate must exceed valuation,
N—New product or management may be the driver,
E—Emerging industry or product creates opportunity and
T—Timing needs to be right (technically poised for large price increase).
Originally, there were two AAII MAGNET screens, a simple version as well as a complex (we have since added revised versions of both the simple and complex strategies). The MAGNET Complex strategy’s growth aspects look for companies that have increased sales and earnings by at least 25% over the trailing 12 months (last four fiscal quarters).
For momentum investors, the MAGNET Complex approach looks for high price momentum over the last three months and 12 months. Specifically, companies must rank in the top 25% of the stock universe based on relative price strength over the last 13 and 52 weeks.
For the value component of the MAGNET Complex strategy, Kimmel uses the price-to-sales ratio to find undervalued stocks. To pass the AAII Complex screen, a company’s current valuation (price-to- sales ratio) cannot be greater than the median value for its respective industry.
To identify companies with solid balance sheets, the MAGNET Complex approach uses secondary criteria as well. Kimmel requires a current ratio (current assets to current liabilities) of at least 1.5 and a debt-to-equity ratio of no more than 40%.
While not part of the quantitative filters used in the AAII MAGNET Complex screen, Kimmel also uses a variety of technical analysis tools to help him decide when to buy. Tools he uses include moving averages, moving average convergence/divergence (MACD), stochastics, relative strength, volume, point & figure charts and insider trading.
For a stock strategy to be useful, however, it also must be investable. This, in part, means there should ideally be enough stocks passing to provide various alternatives, but not so many that investors are overloaded. Since the start of 1998, the MAGNET Simple screen has only averaged two passing companies a month, while the MAGNET Complex screen averages three passing companies a month. For 2017, the MAGNET Complex screen has averaged two passing companies a month, ranging from only one passing company in a month to four in one month. It is perhaps not surprising that the MAGNET screens generate so few passing companies, as it is rare to find “unicorn” stocks exhibiting such strong growth and price momentum trading at discount valuations.
The average monthly price return this year for the stocks comprising the MAGNET Complex screen’s hypothetical portfolio ranged from a decline of 15.7% in August, one of the only two down months for the screen all year, to a gain of 34.6% in May. At the end of July, B. Riley Financial (RILY) was the only company that passed the MAGNET Complex screen. Its shares fell more than 7% following the company’s earnings release that month, falling through key technical support that more than likely added to the downward pressure on the stock price.
The one stock that passed the MAGNET Complex screen at the end of April was Baozun Inc. (BZUN). The Chinese e-commerce company reported earnings in mid-May in line with the consensus estimate but its revenues beat analyst estimates. Following the report, the company’s shares, which had been rising ahead of the earnings release, jumped nearly 15%.
AAII has been developing, testing and refining a wide range of screening strategies over the years. Many of the screens follow the approaches of popular investment professionals, while others are tied to basic principles of investing. These approaches run the full spectrum, from those that are value-based to those that focus primarily on growth, while most fall somewhere in the middle.
Screens following the approach of an investment professional do not represent their actual stock picks. The rules of each screen are defined by our interpretations of their respective investment approaches. The results of the screening strategies, as well as the criteria for each screen, are programmed into the Stock Investor Pro program and are also posted in the Stock Ideas area of AAII.com.
Each month over 60 separate screens are performed using AAII’s Stock Investor Pro and the current companies passing each individual screen are reported. Stock Investor Pro subscribers can run the screens themselves on a weekly basis, while AAII members can access the screening results by going to the Stock Ideas area of AAII.com (www.aaii.com/stockideas). The results are posted to AAII.com on the 15th of each month (excluding holidays and weekends) using data from the previous month’s end. The AAII Stock Screens Update email will notify you when the strategies have been updated on AAII.com and provide a more in-depth look at a featured screen each month. You can sign up for this complimentary newsletter at www.aaii.com/emails.
The performance of the stocks passing each approach is tracked on a monthly basis. The month-to-month closing price is used to calculate the return, with equal investments in each stock at the beginning of each month assumed. The impact of factors such as commissions, bid-ask spreads, time slippage (the time between the initial decision to buy a stock and the actual purchase) and taxes is not considered. This overstates the reported performance, but all approaches are subject to the same conditions and procedures. Higher turnover portfolios typically benefit more from these simplified rules.
Keep in mind, however, that performance figures for the AAII stock screening strategies represent price change only, and do not include dividend payments or dividend reinvestment. Therefore, the results of screens that tend to isolate large, dividend-paying stocks—such as the Dogs of the Dow (in the value category) —do not receive a boost from dividend payments or reinvestment. The 10 stocks passing the Dogs of the Dow screen at the end of November were yielding 3.5%, the same as at the end of November 2016; investors holding shares in these stocks, therefore, would have a higher annual return by approximately this amount for the coming year.
Sell rules are the same as the buy rules: The hypothetical portfolios are completely reallocated using each subsequent month’s data. Thus, a stock is sold (no longer included in the portfolio) if it ceases to meet the initial criteria, and new stocks are added if they qualify.
Stocks that no longer qualify are dropped even if the strategist behind a particular approach suggests different sell rules versus buy rules. This may shorten the holding period and increase the turnover relative to what the strategist would suggest for an actual portfolio.
Almost all the top AAII stock screening strategies this year have some element of growth to them. Stock prices, in the long term, are driven by a company’s ability to generate earnings. When trying to identify growth companies, your primary screen should provide you with a list of companies that are in the growth stage of their life cycle, not mature cyclical firms.
Many growth screens focus specifically on earnings growth (although growth in sales, cash flow and dividends may also be considered), such as:
Another common thread running through successful screening strategies is price momentum. We can evaluate a stock’s price momentum by looking at its percentage change over a given period—for example, six months. However, it’s hard to say if being up 25% over the last six months or falling 25% is good or bad without context. We obviously would like to see our stocks go up, if we have a long position. But if our stock is up 25% over the last six months and the market is up 50%, the performance loses some of its luster. Likewise, if the market is down 50% but our stock is down “only” 25%, we probably wouldn’t complain quite so much. For this reason, relative price strength is often a popular measure of a stock’s price momentum. Using price momentum filters in conjunction with value-oriented filters has been found to enhance the performance of value strategies, too, by lessening the likelihood of buying into a “value trap”—a stock with a depressed stock price that remains depressed.
Momentum filters focus on changes or acceleration in price, such as:
In Stock Investor Pro, the relative strength index is calculated against the performance of the iShares S&P 500 ETF (IVV), which is used as a proxy for the S&P 500 index. Stocks with performance equal to that of the S&P 500 over the last 52 weeks have a relative strength index of 0%. A relative strength index value of 10% indicates that the stock outperformed the S&P 500 by 10%. Negative index numbers indicate underperformance relative to the index: A relative strength index reading of –5% means the stock has underperformed the S&P 500 by 5%.
Relative strength rank values compare a stock’s relative price performance against all other U.S.-listed stocks. So, a company with a 26-week relative price rank value of 90% ranks in the top 10% of all U.S. stocks in terms of relative price strength over the last six months (90% of all U.S. stocks have a weaker relative price strength over that period).
Among this year’s top-performing strategies, four of the top five have relative price strength filters. Of these four, three require the relative price strength to have some minimum ranking compared to all stocks while the fourth, the Price-to-Sales screen, looks for stocks with relative price strength that is better than its industry.
As mentioned earlier, the MAGNET Complex approach looks for companies that have boosted sales by at least 25% over the last 12 months as well as having relative price strength that ranks in the top 25% of all stocks over the last three and 12 months. The Philip Fisher strategy requires companies to have increased sales over each of the last three years and have an average annual growth rate in sales over the last three years that is better than its industry median.
AAII’s O’Neil CAN SLIM Revised 3rd Edition screen identifies firms with a year-over-year growth rate in earnings for the latest quarter of at least 20% and that is better than the year-over- year growth rate of the previous quarter. In addition, the screen has filters for increasing earnings over each of the last four years and an average annual growth rate in earnings of at least 25% over the last three years. Finally, the revised CAN SLIM methodology looks for stocks that are trading within 10% of their 52-week high and have relative price strength that ranks in the top 20% of all stocks over the last year.
Rounding out the top five screens for 2017 are two other MAGNET screens, the Simple Revised and Simple. The MAGNET Simple strategy looks for sales growth of at least 15% over the last four quarters and relative price strength that ranks in the top 10% of all U.S.-listed stocks over the last three and 12 months. The MAGNET Simple Revised approach adds cash flow growth as an additional filter. In addition, the MAGNET Simple Revised methodology requires relative price strength over the last three months to be in the top 40% and in the top 20% over the last six months.
Among the poorest performers this year we find a familiar name, the Murphy Technology approach. The strategy’s 29.3% decline this year through the end of November ranks the lowest among all AAII stock strategies. This is also the fourth time since 1998 that this methodology has turned in the lowest annual performance. The irony is that technology stocks were some of the best performers this year, but the Murphy Technology screen was not able to capitalize on the trend.
The screening strategy looks for technology companies that have been growing sales by at least 15% a year over the last three years, as well as net margins and return on equity (ROE) or at least 15%. In addition, the Murphy Technology approach has a value filter based on price/growth flow, which is a measure for identifying companies that are producing solid earnings and investing a large amount in research and development (R&D). This ratio compares the current share price to the amount of per-share earnings a company generates as well as the per-share R&D expense of the company. In a year where growth and momentum ruled, especially in the technology sector, this measure may have been the tipping point.
While Table 1 ranks all the screening strategies tracked by AAII based on year-to-date price change, one- year returns are not necessarily indicative of a methodology’s typical performance. Year in and year out, the performance of various strategies can be very volatile. When looking for a strategy to follow, therefore, it is important to examine the long-term performance and look for those that fit your own temperament when it comes to the types of stocks they usually cover and the overall volatility.
To help you with this, Table 3 ranks the AAII stock strategies over a longer period, specifically the average annual price gain over the last 10 years. Ten years is typically a long enough period to be meaningful and long enough to capture at least one full economic cycle.
Table 3. Stock Screens on AAII.com Ranked by 10-Year Return
This year, we see some changes at the top in terms of long- term performance. Once again, the Estimate Revisions Top 30 Up methodology has the best average annual price change over the last 10 years at 20.5%. However, we have a new runner-up: The Price-to-Free- Cash-Flow approach has an average annual return of 18.1% over the last 10 years, while last year’s number two, the Estimate Revisions Up 5% strategy, slips to fourth based on 10-year performance at 17.5%. Rounding out the top three based on 10-year performance is the Stock Market Winners approach with an average annual price gain of 18.0%.
The Estimate Revisions Top 30 Up approach requires that the consensus estimates for the current fiscal year and next fiscal year have risen over the last month, that there has been at least one upward revision to the current and next fiscal-year consensus estimates, and that there have been no downward revisions in the current or next fiscal year’s consensus estimates. Finally, the set of passing companies is limited to those 30 that have seen the largest percentage increase over the last month in the consensus earnings estimate for the current fiscal year. Over the last 10 years, this strategy, on average, has generated an annual gain of 20.5%. In comparison, the average annual price gain in the S&P 500 over the same period has been 6.0%.
We also see some of the top performers over the last 10 years with other characteristics that underlie many successful stock selection strategies, namely low relative valuations and earnings momentum. The Price-to-Free-Cash-Flow screen is a “pure value” approach, requiring companies to have positive free cash flow per share for each of the last five years as well as a price-to- free-cash-flow ratio that is below the industry median as well as the five-year average. The strategy also limits passing companies to the 30 each month with the lowest price-to-free-cash-flow ratio. While the approach has only generated a price gain of 3.4% this year, this year’s 10-year performance now omits the screen’s 21.2% loss in 2007. Next year we will see a drastic change in the 10-year performance, as the losses from 2008 will no longer be included in the 10-year calculation.
Two of the factors that the Stock Market Winners strategy looks for is weighted relative price strength over the last year to rank in the top 30% as well as a current share price that is within 15% of the two-year high. The weighted relative strength measure gives greater weight to more recent relative price strength. The Revised 3rd edition of the CAN SLIM strategy looks for stocks trading within 10% of their 52-week high and that rank in the top 20% in terms of 52-week relative price rank.
Looking at the poorest performers over the last 10 years, 10 screening strategies have negative annual average numbers, down from 12 last year. Still at the bottom of the list is the Muhlenkamp strategy, with an average annual loss of 10.7% a year over the last 10 years. This approach looks for companies with above-average returns on equity, a reasonable price-earnings ratio based on prevailing inflation and interest rates, positive long-term earnings growth, profit margins that exceed the industry norm, a percentage of liabilities to assets that is below the industry norm and positive free cash flow. This methodology does not possess the relative valuation that we found in the top performers, as it caps the price- earnings ratio at 22, which is adjusted over time. Furthermore, it is one of the few “value” strategies AAII tracks that does not also have some price momentum component.
It is also worth pointing out that this year’s top performer, the MAGNET Complex approach, is near the bottom in terms of 10-year performance, losing an average of 7.8% a year. Over the last 10 years, this strategy has posted losses in six of those years, including a 43.0% decline in 2015. This highlights the fact that you must look past short-term performance when evaluating an investment strategy. In contrast, the Estimate Revisions Top 30 Up approach has only had two losing years over the last 10. It was down 2.3% in 2011 and lost 31.1% in 2008.
Tables 1 and 3 also present the risk-adjusted return for each of the strategies AAII tracks. This calculation adjusts the performance of each approach using their volatility as measured through standard deviation of returns, penalizing screens with higher standard deviations (for a more detailed explanation of the risk- adjusted return calculation, see the box below). Using risk- adjusted returns, the two best-performing strategies since 1998 are the Stock Market Winners (+17.0%) and Estimate Revisions Up 5% (+16.8%). This is a slight reordering of the approaches based on risk-adjusted return, as the Stock Market Winners methodology ranked third last year. The Estimate Revisions Top 30 Up approach slipped to third with an average annual risk-adjusted return of +16.6%.
The Stock Market Winners approach is based on research performed by William O’Neil and published as “The Greatest Stock Market Winners: 1970–1983.” The screen is based on variables from five categories. The first, “smart money,” includes the behaviors of professionally managed funds and corporate insiders. The second contains valuation measures such as price-to- book-value and price-earnings ratios. The third grouping includes the technical indicator of relative strength. The fourth consists of accounting earnings and profitability measures. The final group contains miscellaneous variables that did not fit into the other four groups, including the number of common shares outstanding.
Seven of the AAII stock screening strategies have negative average annual risk-adjusted returns. On a risk-adjusted basis, we see that the Murphy Technology approach is again at the bottom with an average annual loss of 26.5%. This year’s strongest AAII stock screening strategy, the MAGNET Complex approach, ranks in the bottom third of the methodologies we track with an average annual risk- adjusted return of +8.8%.
The formula for calculating the risk-adjusted return is as follows:
Margin Rate + (Benchmark Std Dev ÷ Portfolio Std Dev) × (Portfolio Return – Margin Rate)
Where:
This calculation assumes that the portfolio return for a given stock screen is higher than the margin rate. If it isn’t, the risk-adjusted return calculation would be as follows:
Margin Rate + (Portfolio Std Dev ÷ Benchmark Std Dev) × (Portfolio Return – Margin Rate)
Following this methodology, we calculate the risk- adjusted returns since inception for all of the AAII stock screens.
Most stocks have some positive correlation with the overall market: When the market is going up, so do the values of many stocks. However, the extent of the increase varies.
When investing in individual stocks you would like to outperform the market, otherwise you are probably better off investing in an index fund. By tracking the performance of our stock screening strategies over the latest bull and bear markets, you can see whether an approach outperforms the market during an uptrend or limits losses during a downtrend.
Among the AAII stock screening strategies, the Price-to-Free- Cash-Flow approach has turned in the best bull market performance, gaining an astonishing 1,194.2% between March 1, 2009, and November 30, 2017.
Even with the current bull market nearing its ninth anniversary, four screening strategies have not been able to capture the market’s overall upward momentum during the current bull market: MAGNET Complex Revised (–56.2%), Muhlenkamp (–44.7%), MAGNET Complex (–8.1%) and Kirkpatrick Value (–6.3%). By way of comparison, the S&P 500 has a bull market price gain of 260.2%.
Over the last bear market, O’Neil’s CAN SLIM approach had the smallest loss at –10.1% from November 1, 2007, through February 28, 2009. The approach benefited from being out of the market for much of that time, as its strict price momentum filters have few, if any, candidates during a prolonged market downturn. When no stocks pass a strategy at the beginning of a calendar month, AAII’s backtesting methodology considers the hypothetical portfolio to be fully invested in cash and out of the market. The biggest loser over the last bear market was the Dogs of the Dow Low Priced 5, which fell by 82.9%.
The MAGNET Complex strategy registered a 55.9% loss over the last bear market.
The volatility index compares the variability of returns, as measured by the standard deviation of return, for a given stock screening strategy to that of a benchmark. Standard deviation is a measure of return volatility computed using monthly returns since the beginning of 1998. The volatility index divides the standard deviation of a strategy’s return by the standard deviation of return for a benchmark, in this case the S&P 500. The volatility index provides a relative measure of risk by comparing the variation in return for a screen since the beginning of 1998 to the typical variation in return for the benchmark index. The volatility index of the S&P 500, therefore, is 1.00; methodologies with a volatility index below 1.00 are below average in risk.
All but one of AAII’s stock screening strategies have volatility indexes above 1.00, which is to be expected. Stock selection strategies, after all, typically pass anywhere from a handful of stocks to around 50, while the S&P 500 is made up of 500 very heavily traded companies. As of the end of November, the only approach with a volatility index lower than 1.00 is the High Relative Dividend Yield strategy. The passing company list for this screen is made up of “safer” dividend-paying stocks. Its volatility index value of 0.99 means the approach is 1% less volatile than the S&P 500 since the start of 1998. Therefore, the screen’s risk-adjusted return matches its average annual return since the start of 1998 at 9.5%.
The High Relative Dividend Yield approach requires a rising dividend for each of the last six years, a current dividend yield that is greater than the seven-year average yield, reasonable payout ratios (depending on the industry), liabilities levels that are below industry norms and historical earnings growth that exceeds the industry norm.
The AAII stock screening strategy with the best average annual risk-adjusted return, Stock Market Winners, has a volatility index of 1.44. This indicates that, since the beginning of 1998, the monthly variability of returns for the stocks held in this portfolio has been 44% higher than that of the S&P 500. This makes the Stock Market Winners approach the 39th-riskiest screen among the 63 screens AAII tracks. Among all AAII stock screening strategies, the median volatility index value is 1.55, which matches last year’s median value. This indicates that the typical stock screen tracked by AAII has 55% more volatility of returns than the S&P 500.
The MAGNET Simple approach continues to have the highest volatility index (3.00), which means the monthly variability of returns for the stocks held in this portfolio is twice that of the S&P 500. Accordingly, its annualized gain of 16.8% since 1998, which is above the median annualized gain for all screens of 11.2%, becomes a more middling risk-adjusted return of 10.6%, only slightly exceeding the median risk-adjusted return for the screen universe of 10.0%.
The MAGNET Complex strategy has the second-highest volatility index of all the AAII methodologies at 2.86. This transforms the screen’s average annual return of 11.2% since the start of 1998 to an average annual risk-adjusted return of 8.8%.
One trend that has developed over time is that the screens with a higher average number of passing companies tend to have lower volatility and, thus, a lower relative volatility index. For the five AAII stock screening strategies with the lowest volatility indexes, the historical median number of passing companies is 36. However, the five approaches with the highest volatility indexes have had a median average number of passing companies of only five. The MAGNET Simple strategy, with the highest volatility index, has the second-lowest average number of passing companies among all the AAII stock screening strategies at three. The average median number of monthly holdings for all AAII stock strategies is just over 19.
Furthermore, strategies with lower monthly turnover also tend to have lower volatility index values. The median monthly portfolio turnover for the five methodologies with the lowest volatility index values is 21.1%, whereas the approaches with the five highest volatility indexes have a median monthly turnover of 45.8%. The median average monthly turnover for all 63 AAII stock screening strategies is 37.1%.
The drawdown of a portfolio is the peak-to-trough decline, usually quoted as the percentage loss from the maximum value of the portfolio to the subsequent trough. As discussed, one measure of volatility is standard deviation. However, standard deviation considers both downside and upside volatility. Many investors prefer upside volatility and are more concerned about drawdowns. During volatile markets, drawdown is a critical concern, especially for retirees.
Stock strategies with large drawdowns are, all else equal, not very attractive. However, how quickly the portfolio recovers from the drawdown is equally important. The Murphy Technology approach has the largest drawdown among the 63 strategies tracked by AAII at 92.4%. This means the strategy lost over 92% from its peak value, in this case between May 2000 and December 2003. Being a strategy geared toward identifying technology stocks, it is probably not a surprise that this drawdown coincides with the bursting of the tech bubble. It has been 167 months since the screen reached its 92.4% trough and the strategy is still down 87.9% from its 2000 peak as of November 30, 2017.
The Graham Defensive Investor Utility approach has the smallest drawdown among all AAII screens at 32.3%. This occurred between June 2007 and February 2008, during the global financial meltdown. Unlike the Murphy Technology approach, however, this one was able to recoup its peak-to-trough losses and achieve new highs within 40 months of its trough.
The MAGNET Complex strategy has seen a maximum drawdown of 77.4%, which it hit at the end of May 2012. As of the end of November, the screen is still down 65.1% from its March 31, 2006 peak.
By means of comparison, the median drawdown for all AAII stock screening strategies is 57.0%. The maximum drawdown for the S&P 500 is 52.6%, which transpired between November 2007 and February 2009. It took the index 49 months from that trough to achieve new highs.
The columns near the rightmost side of Tables 1 and 3 present the average number of passing stocks and the turnover percentage for each of the AAII stock screening strategies. For many of the approaches, you will notice patterns depending on the market cycle. For example, the High Relative Dividend Yield methodology has generated, on average, 36 stocks per month since the start of 1998. However, as dividend yields have fallen as the overall market value has increased, the screen has seen its average number of monthly passing companies fall such that only 18 companies have passed, on average, each month this year.
Overall, the Value on the Move PEG With Historical Growth approach has the highest average number of passing companies each month at 74. At the other end of the spectrum, the MAGNET Complex and MAGNET Complex Revised strategies have the lowest average number of passing companies each month at two.
The average monthly turnover percentage indicates the percentage of stocks passing the screen in each month that are different from the previous month. The Estimate Revisions strategies have some of the highest monthly turnovers, ranging from 89.4% to 93.5%. These approaches look for companies that have had upward or downward earnings revisions over the past month. Not many companies will continuously pass them, since that would suggest that analysts are continuously revising the estimates of a specific company upward or downward month after month.
Also, keep in mind that, as a rule, value-oriented strategies tend to have lower turnover and growth-oriented approaches tend to have higher turnover.
The AAII stock screening strategy with the lowest turnover is the Dogs of the Dow approach, with an average monthly turnover of 7.8%. This strategy simply looks for those 10 stocks that are part of the Dow Jones industrial average that have the highest dividend yield. Since the initial stock universe is only 30, the stocks that pass this screen month to month are relatively constant.
The median average monthly turnover for AAII’s stock screening strategies is 37.1%.
Stock screening is the first step of the stock selection and analysis process. The AAII stock screening strategies are not intended to be buy or recommended lists. Instead, they allow investors to see how different investment strategies perform over varying market conditions. Since market conditions change, it is important to be adequately diversified to weather the ups and downs of the market.
One way to achieve sufficient diversification is to select stocks from multiple stock screening methodologies. However, it is not enough to simply choose those strategies that have the best long-term performance. Instead, it is useful to understand the forces influencing both the overall market and a strategy’s performance, and how changing economic conditions can impact both the market and individual stocks. Examining the characteristics of an investment methodology may reveal some practical problems you might face when trying to translate quantitative stock screening into real- world portfolio building.
Something else to keep in mind is that once you decide on which methodologies to follow, you cannot just let the quantitative screens choose your stocks.
Screening is a multi-step process. For some investors, this means first applying quantitative filters such as the screens we have discussed here to help you arrive at a set of candidates that all share the same base set of characteristics. This does not necessarily mean they are all good investments. It is important to then perform at least cursory qualitative analysis to decide whether they are right for your stock portfolio.
Growth Investing

Investor Professor
AAII Stock Ideas

Manjunath Sharma from CA posted over 8 years ago:
Tim Taylor from SC posted over 8 years ago:
Norbert Falasco from FL posted over 8 years ago:
Maurice Clark from CA posted over 8 years ago:
D Jenkins from NC posted over 8 years ago:
b. durr from WA posted over 8 years ago:
Leo Chouinard from KS posted over 8 years ago:
You need to log in as a registered AAII user before commenting.
Log InCreate an account