

Warren Buffett never expounded extensively on his investment approach, although it can be gleaned from his writings in Berkshire Hathaway annual reports. AAII was inspired by the approach presented by Robert Hagstrom in “The Essential Buffett” (John Wiley & Sons, 2001) to develop a quantitative screen for Buffett stocks.
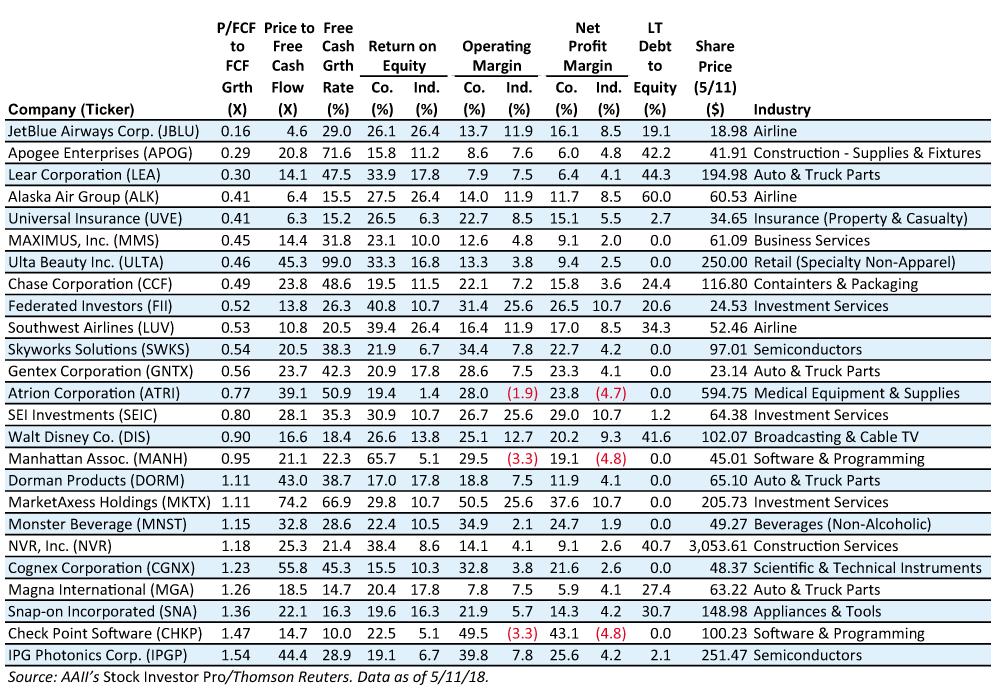
The Hagstrom Buffett approach is available for AAII members in the Stock Ideas section of AAII.com and is also built into AAII’s fundamental stock screening and research database, Stock Investor Pro. This First Cut presents the exchanged-traded, domestically listed stocks that pass the filter.
The First Cut begins by seeking companies with a consistent operation history as measured by operating profits. Companies must have positive operating income for the trailing 12 months and each of the last seven fiscal years.
The First Cut requires return on equity (ROE) greater than 15% for the current period and each of the last three fiscal years as well as operating margin and net profit margins greater than the respective industry median to reflect Buffett’s preference for companies that have defensible market share.
As a measure of financial strength, the First Cut looks for companies with a ratio of current debt-to-equity better than the industry median. Buffett favors larger companies, so the First Cut requires a market cap of at least $1 billion dollars.
Buffet seeks out companies managed with shareholder interests in mind. The First Cut requires at least a dollar-for-dollar share price increase for each dollar added to retained earnings from the income statement over the last five years.
The final filter examines valuation: Since Buffett likes to focus on free cash flow, the price-to-free-cash-flow ratio is used. Lower is better; however, to adjust for varying growth rates, the price-to-free-cash-flow ratio was divided by the free-cash-flow growth rate to help equate value to growth (P/FCF to FCF growth field). The 25 companies with the lowest ratios of free-cash-flow multiple to growth rate made the First Cut.
—John Bajkowski, AAII president
Criteria for Use in SI Pro
| Field: | Operator: | Factor: | Compare to: | |
|---|---|---|---|---|
| Exchange | Not Equal | Over the counter | ||
| And | ADR/ADS Stock | Is False | ||
| And | Industry | Not Equal | Misc. Financial Services | |
| And | Industry | Not Equal | Real Estate Operations | |
| And | Market Cap Q1 | >= | 1000 | |
| And | Gross operating income 12m | > | 0 | |
| And | Gross operating income Y1 | > | 0 | |
| And | Gross operating income Y2 | > | 0 | |
| And | Gross operating income Y3 | > | 0 | |
| And | Gross operating income Y4 | > | 0 | |
| And | Gross operating income Y5 | > | 0 | |
| And | Gross operating income Y6 | > | 0 | |
| And | Gross operating income Y7 | > | 0 | |
| And | Return on equity 12m | > | 15 | |
| And | Return on equity Y1 | > | 15 | |
| And | Return on equity Y2 | > | 15 | |
| And | Return on equity Y3 | > | 15 | |
| And | Operating margin 12m | > | Industry Operating margin 12m | |
| And | Net margin 12m | > | Industry Net margin 12m | |
| And | LT Debt/equity Q1 | < | Industry LT Debt/equity Q1 | |
| And | Price Chg vs BV Chg | > | 0 | |
| And | PFCF to FCF growth | > | 0 | |
| And | PFCF to FCF growth | <= | 1.7 |

Related
Stock Strategies
Insights on Warren Buffett From His Friend and Editor
Related

Value Investing
Hagstrom's Buffett Approach to Analyzing a Stock as a Business
Discussion
FREE REPORT

Get your free copy of our special
report analyzing the tech stocks
most likely to outperform the
market.
Steve from AZ posted over 8 years ago:
Jakob Trachsler from Switzerland posted over 8 years ago:
You need to log in as a registered AAII user before commenting.
Log InCreate an account