


The philosophy and investment style of Geraldine Weiss was examined by Jaclyn McClellan in the June 2016 issue of the AAII Journal. Here we derive quantitative metrics from Geraldine Weiss’ approach of investing in blue-chip stocks and implement them into a stock screen to arrive at a list of prospective stocks that may warrant further analysis. AAII’s Stock Investor Pro fundamental stock screening and research database program was used to create the Weiss screen.
While investors cannot agree on a single approach to selecting stocks, the desirability of a disciplined and consistent stock selection framework is well accepted among successful investors. A sound approach provides analytical guidance when your emotions may disrupt your thinking or even push you away from making decisions when they are warranted. Weiss applies a relative dividend yield approach to a universe of blue-chip stocks to help determine purchase and sale values. Weiss first constructs a universe of qualified blue-chip companies, then relates their current dividend to the company’s historical norm to decide if the company is buy, hold or sell.
Her approach, as outlined in this article, can be attributed to the book “Dividends Don’t Lie,” (Longman Publishing, 1988) co-authored by Janet Lowe. The methodology outlined in “Dividends Don’t Lie” served as a game plan for Weiss’ investment advisory newsletter, Investment Quality Trends, and is still widely followed today.
The Philosophy
Weiss is a value investor with a focus on blue chips. Weiss primarily looks toward the dividend yield (current annual indicated dividend payment divided by share price) to identify when stocks are undervalued or overvalued. Weiss felt that, over time, stocks repeatedly fluctuate between high and low values best indicated by dividend yield. A careful study of a stock will reveal these extremes, thereby providing guidance on future stock turning points.
Dividends help to separate the speculators from the investors in the marketplace. Investors are only willing to risk their capital in a company when they can be reasonably assured of getting an attractive return on their investment. The dividend payment serves as a direct source of profit for the investor and also acts as a valuable tool to measure the relative attractiveness of a company compared to its own historical pattern. The dividend yield becomes a useful measure when you can be assured that the company paying the dividend is committed to its dividend and has the financial strength for its dividend payments.
Determining the Universe
Weiss limits her analysis to about 350 blue-chip companies because her research showed that there was just as much profit potential in high-quality stocks as in low-quality stocks. However, high-quality stocks carry much less risk, making them a more attractive option.
Weiss feels that blue-chip companies have a reputation for dependability as well as offering the best potential for increasing shareholder value through dividend growth and capital gains.
She notes that these blue-chip companies have the resources to attract and develop proven, experienced managers and established, effective marketing programs. They have experienced and weathered variable economic cycles and have demonstrated their ability to adjust successfully to changing environments. Their capital and resources allow them to invest in research and development needed to ensure future growth. Furthermore, a history of uninterrupted dividends indicates that the company is concerned about its shareholders and would be reluctant to cut its dividends.
The list below reveals the six criteria used to identify the “high-quality” companies suitable for Weiss’ valuation.
Blue-chip stocks:
- The dividend must have increased a minimum of five times in the past 12 years.
- In at least the seven of the last 12 years, corporate earnings should have improved.
- Company must have paid dividends, with no interruptions, for the past 25 years.
- Shares outstanding should number at least five million.
- Shares must be held by at least 80 institutions.
-
The stock must carry a Standard & Poor’s quality ranking no lower
than A
Weiss requires that a company pass at least five of the criteria to be included for further analysis in her blue-chip list, and she removes companies from her list when they no longer meet four of the criteria.
History of Dividend Increases
The first criterion specifies that dividends must have increased a minimum of five times in the past 12 years, as the only way to reliably recognize good management is by its long-term track record. A substantial upward trend of increased dividends is made possible through a company’s ability to have successful revenue growth and earnings growth. Not every company should be expected to increase its dividend every year, but Weiss looks for an annual increase roughly 42% of the time.
This filter is trying to capture companies with a strong record of dividend increases. Increasing dividends have a corresponding increase effect on valuation levels. An increase in the dividend payment directly results in a higher valuation.
Most screening systems available to individual investors do not have a deep enough historical record to look for updates in five out of the last 12 years. We are using Stock Investor Pro to implement the Weiss screen. The current version of the program and database provides seven fiscal years of income statement data. Since the Weiss approach looks for increases 42% of the time, we specified three increases out of the last seven years. The June 10, 2016, edition of the Stock Investor Pro database tracked 6,852 publicly traded companies, but only 2,505 currently pay a dividend. Requiring three annual dividend increases over the last seven years cuts our 6,852-stock universe down to 1,625 stocks.
Earnings Strength
Earnings growth helps to fuel dividend growth, so Weiss specifies that corporate earnings should have increased in at least seven of the last 12 years. It’s another indication of a well-managed company, indicating that a company can survive the tough years and prosper in the good ones. Weiss notes that she also looks for sales increases as well as profit margins that are under control.
As with dividends, most screening programs do not supply 12 years of data. Since Weiss looks for earnings increases 58% of the time, we specified four increases out of the last seven years. We also require that trailing earnings per share over the last 12 months be greater than or equal to earnings per share for the last fiscal year. About 1,440 companies meet this filter, but when combined with our dividend increase filters we are down to 472 stocks.
Record of Uninterrupted Dividends
Weiss requires her blue-chip companies to have a minimum of 20 to 25 years of uninterrupted cash dividends to help ensure that companies used for her relative yield analysis have a high resistance to cutting dividends. One needs to examine dividend payments over a longer-term period to properly determine a stock’s dividend cycle. Weiss notes that this wasn’t a rule she always followed, because she sometimes selected blue chips that had not been around for 25 years. But most of the companies on her list had been paying dividends for 25 years.
As Stock Investor Pro currently only provides seven years’ worth of financial data, we looked for stocks that paid a dividend for each of the last seven years and that have not decreased their dividend over the last seven years. There are 398 companies that passed this filter independently. Adding the requirement to our Weiss screen drops the number of passing companies from 472 to 206.
Minimum Liquidity
It is important to be able to have a sufficient number of outstanding shares to help ensure that investors can purchase and sell shares at appropriate times. Share prices can react more severely to buying or selling pressure if only a limited number of shares are outstanding. Therefore, sufficient liquidity helps to guard against manipulation of share price. Weiss specifies that the initial universe of stocks should have at least five million outstanding shares.
Adding that requirement to our Weiss screen drops the number of passing companies from 206 to 193. There are 6,181 securities in Stock Investor Pro, out of its universe of 6,852, that have at least five million shares outstanding.
Institutional Sponsorship
Weiss reveals that almost all of the trading volume in today’s market involves institutional investors. These institutional investors consist of mutual funds, hedge funds, banks, insurance companies, pensions and retirement funds. It is therefore important for a company to have sufficient interest in the powerful institutional market to prevent the stock price of even a quality company from languishing. Weiss requires that a company’s shares be held by at least 80 institutions. Because of the scrutiny and strict conditions under which institutional investors operate, they theoretically “must” invest in high-quality stocks.
We followed Weiss’ recommendation and required at least 80 institutional shareholders. About half of the stocks tracked in Stock Investor Pro meet this criterion. Adding the filter to our Weiss screen dropped the number of passing companies from 193 to 182.
Quality Rankings
Weiss requires that firms have Standard & Poor’s earnings and dividends quality rankings of A– or better. The ranking examines the growth, stability and cyclicality of earnings and dividends over the last 10 years. The rankings are further adjusted based upon corporate size, with minimum size limits placed for various rankings. B+ is considered average, so Weiss requires above-average rankings for her blue-chip universe.
Standard and Poor’s classifies common stock on a ranking based on earnings and dividends. Weiss quoted the S&P Stock Guide, “A ranking is not a forecast of future market price performance, but is basically an appraisal of past performance of earnings and dividends, and relative current standing.”
Weiss found the rankings to be a useful guide to investment quality. Although stocks needed to have a quality ranking of at least A– to make it onto her list, she allowed stocks to drop to B before removing them.
This is a proprietary S&P figure that is now called the S&P Capital IQ Quality Ranking. Company rankings are available on S&P Capital IQ datasheets and the methodology is outlined on the S&P Dow Jones Indices website. We were not able to filter our companies using this factor, leaving us a 182-stock universe from which to run our yield analysis.
Yield Comparison
From her universe of blue-chip stocks, Weiss applies an analysis of relative dividend yield levels to company historical norms to determine levels of undervaluation and overvaluation. Weiss has observed that companies repeatedly fluctuate between levels of high and low values. For example, one stock may typically top out when its yield drops to 2% and rebound strongly when its yield increases to 5%. While a stock may continue to increase in price once its yield drops below 2%, the potential benefit of ownership is not equal to the risk of decline. Its price can only be supported by increasing its dividend, which has the effect of increasing its dividend yield, assuming that the price stays constant.
Weiss’ rule of thumb notes that stocks tend to be undervalued or overvalued when they are within the 10% range of their historical levels of high or low dividend yield average. When a stock’s dividend yield is at or above its historical average high, it’s time to buy. When a stock’s dividend yield is equal to or below its historical average low, it’s time to sell. Weiss monitored the dividend yield cycle of the Dow Jones industrial average as a means for analyzing overall market valuations.
We looked for stocks that were trading at current yields within 10% of their seven-year average high dividend yield. The comparison of current yield to the firm’s own past record of dividend yields allow firms with low absolute dividend yields to pass the screen. It is best to study the pattern of movement between high and low dividend yield over a number of cycles. Stock Investor Pro is currently limited to a comparison over the last seven fiscal years. There are 2,370 stocks with enough data to calculate a seven-year average high dividend yield, but only 867 have a current yield within 10% of their seven-year average high. Adding this criterion to our Weiss screen reduced the number of passing companies from 182 to 38 stocks.
Secondary Factors
A high relative current yield by itself does not indicate that a stock is undervalued. It may indicate that the dividend is in jeopardy. For a high relative yield to be considered a sign of an undervalued stock, the company must be expected to continue to pay and expand the dividend over time. While the blue-chip screen helps to reveal strong firms, Weiss also relies on many traditional ratios as indications of the safety of the dividend and the attractiveness of the yield.
-
Current Ratio
Weiss uses the current ratio as a measure of cash liquidity. Determined by dividing current assets by current liabilities, current ratios above 2.0 are generally considered desirable.
We screened for a current ratio of 2.0 or greater. However, the current ratio has many weaknesses—it includes inventory as an asset, but in a cash squeeze inventory may be very illiquid. The current ratio is also meaningless for financial firms because of their unique balance sheets. There are only 2,221 companies with a current ratio of 2.0 or higher, and applying the filter cut our list of passing companies from 38 to only eight stocks. Eleven of the 38 companies were financials (banks and insurance companies) that do not have a current ratio. Most of the service-oriented companies will tend to have low current ratios since they do not carry assets such as inventory. This is the type of filter that you may choose to adjust or even exclude depending upon the company’s industry or sector.
-
Debt-to-Equity
Weiss also suggests using the debt-to-equity ratio, which compares long-term debt to equity. Companies with high levels of debt can run into financial problems more quickly during an economic slowdown, putting the dividend or even solvency into jeopardy.
Weiss likes to see a debt-to-equity ratio of no more than 50%, but excludes this test for utilities because of their unique regulatory status. For non-utility stocks, we required a debt-to-equity ratio less than 50%. More conservative investors may look for even lower percentages such as 20%.
One weakness in using this measure is the lack of consideration of short-term liabilities on the financial leverage of the firm. More comprehensive measures such as the ratio of total liabilities to total assets take into account the complete range of liabilities and can be reasonable substitutes.
-
Payout Ratio
The payout ratio is a common measure of safety of dividend. It is calculated by dividing dividends by earnings. Generally, the lower the payout ratio, the more secure the dividend. Weiss considers any ratio above 50% as a warning sign. However, Weiss points out that for some industries, such as utilities, levels as high as 85% are considered normal. Figures above 100% indicate that the payout is greater than earnings. The company can sustain this in the short run, but too high a payout destroys liquidity and growth opportunities in the long run. Strong cash flow can help cover a dividend payment when earnings drop temporarily, but an “unprotected dividend is in greater danger than a protected dividend.” Weiss likes to see low payout ratios coupled with high earnings growth as signs of strong opportunities for continued dividend growth.
Data as of 6/10/2016.
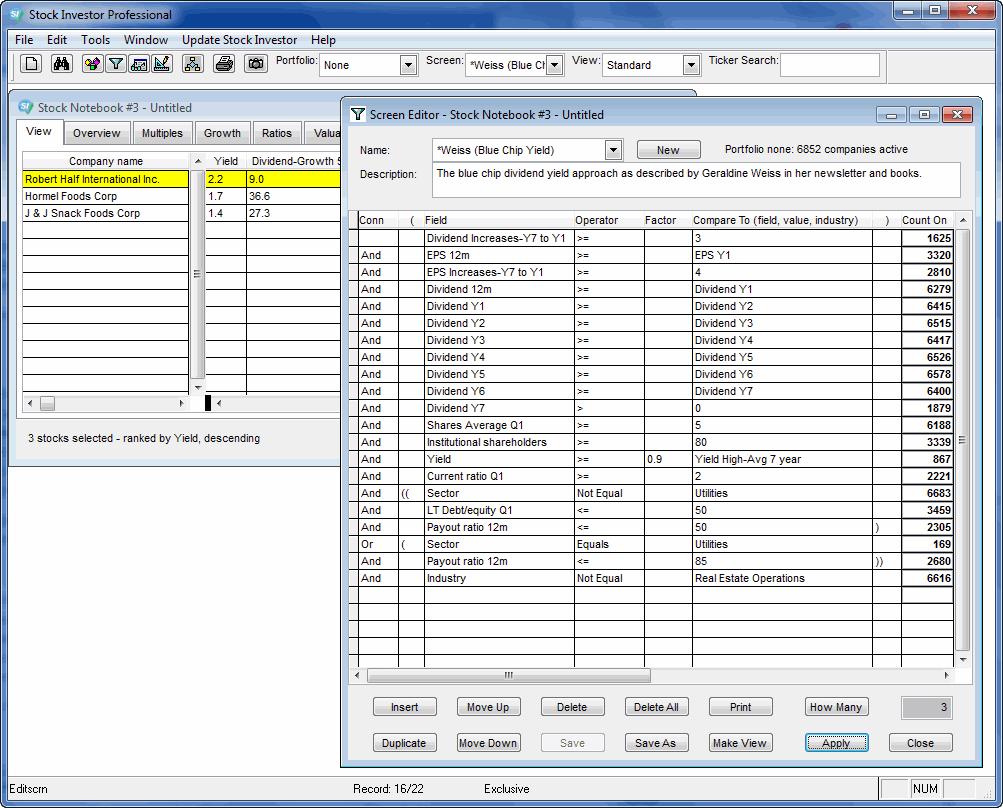
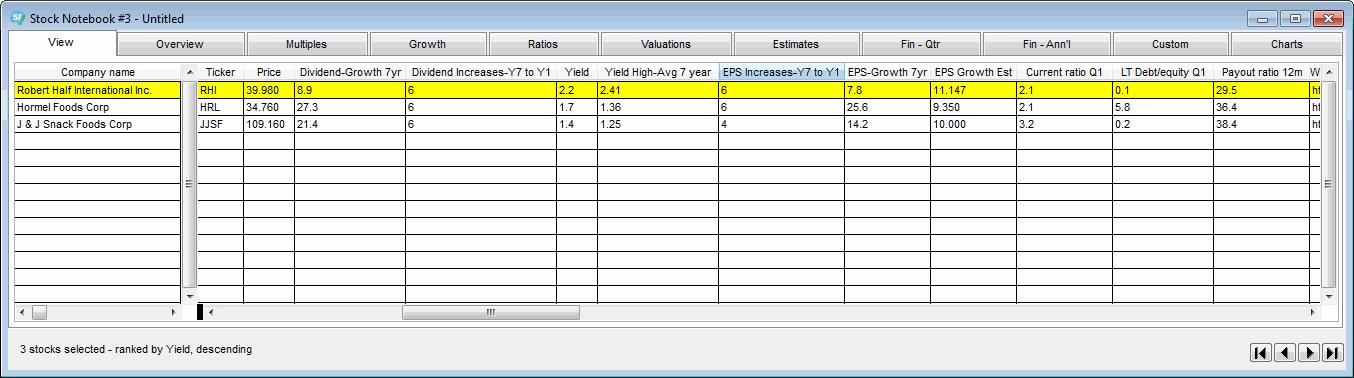
We used parenthesis and the “or” operation in Stock Investor Pro to apply this set of secondary filters to consider whether or not a company is classified as a utility. When constructing a screen, normally each conditions is linked together with “and” operation indicating that each condition must be true for any company to pass the filter. With the “or” operation you are specifying that one filter must be true or the other filter must be true for a company to pass the screen. The opening and closing parenthesis limit the scope of the comparison. For our next filters, if a company is not in the utility sector, the payout ratio for the last 12 months had to be less than or equal to 50% and the company’s long-term debt-to-equity ratio must be 50% or lower. Or, if a company is in the utility sector, we required a payout ratio for the latest 12 months to be less than or equal to 85%. Together, 1,493 companies in Stock Investor Pro pass the combined filter—1,418 non-utilities and 75 utilities. We also excluded companies in the real estate operations industry (REITs) industry. Adding these requirements to our Weiss screen further reduced our list of passing companies to the three firms in the table below.
Figure 1 is a screen shot of Stock Investor Pro showing the entry of the criteria in the program’s screen editor. This screen is preprogrammed into the software under the name *Weiss (Blue Chip Yield). Figure 2 gives the list of companies passing all of these filters, ranked by the current dividend yield.
Data as of 6/10/2016.
Weiss recommends that investors looking at companies should examine all fundamental factors to fully understand the company before purchasing it, and when judging the merits of one prospective blue chip relative to another. She does not go into detail concerning what to look for, but she does provide a generalized guide of what to look at when judging the quality of a firm:
- The company’s financial performance, including its record of earnings, dividends, debt-to-equity ratio, dividend payout ratio, book value and cash flow.
- The company’s product performance, whether it is manufacturing goods or services that are in demand, its research and development efforts, and its ability to market its products or services.
- The company’s investment performance in the form of capital gains and dividend growth.
Conclusion
Weiss maintains that all stocks go through cycles of undervaluation and overvaluation. She feels that investors can take advantage of these cycles—buying stocks when they are undervalued and subsequently selling them when they are overvalued—by comparing current dividend yields to historical norms for blue-chip companies. In Weiss’ view, dividends offer the best indication of both quality and value, while providing a steady source of return. It’s necessary to have the patience to hold onto those stocks until the market is able to recognize their worth, as well as the wisdom to sell stocks when they become overvalued. Our screen just touched upon the primary aspects of applying a dividend yield approach to investing. Like any investment approach, this one requires careful study and analysis of individual companies prior to making any investments.
Following AAII’s Interpretation of the Weiss Screen
AAII tracks the Weiss screen in the Stock Screens area of the AAII website. A list of companies that pass the screen is updated each month. To receive a Stock Screens Update email that will alert you when new data is posted, go to www.aaii.com/my-account/e-newsletters.
Subscribers to Stock Investor Pro can run the preprogrammed *Weiss (Blue Chip Yield) Screen, save the results, and use the program’s research database to conduct further analysis on the passing companies.
What It Takes: Stock Investor Pro Weiss Screening Criteria
- Those companies in the real estate operations industry are not included
- Over the last seven fiscal years dividends have been increased at least three times and have never been decreased
- Earnings per share have increased at least four times over the last seven fiscal years
- Dividends have been paid for at last seven fiscal years
- The average number of shares outstanding for the last fiscal quarter (Q1) is greater than or equal to five million
- At least 80 institutions own stock in the company
- The current dividend yield is within 10% of the seven-year average high dividend yield
- The seven-year average high dividend yield is the average of the ratios of dividend in a given year to the high price for the same year for each of the last seven fiscal years
- The current ratio for the latest quarter (Q1) is greater than or equal to 2.0
- For companies not in the utility sector, the long-term debt to equity ratio for the latest quarter (Q1) is less than or equal to 50%
- For companies not in the utility sector, the payout ratio for the last 12 months is less than or equal to 50%
- For companies in the utility sector, the payout ratio for the latest 12 months is less than or equal to 85%
For a current list of passing companies, click here.
Discussion
FREE REPORT

Per Kjeldaas from LA posted over 10 years ago:
Bob Weber from IL posted over 10 years ago:
Jackie McClellan from IL posted over 10 years ago:
Christophe Couallier from FL posted over 10 years ago:
Simon Huang from MO posted over 7 years ago:
You need to log in as a registered AAII user before commenting.
Log InCreate an account