

Related

Stock Strategies
Geraldine Weiss’ approach seeks dividend-paying, blue-chip stocks with attractive yields, growth and financial soundness.

Geraldine Weiss was crowned “The Grand Dame of Dividends” and has been regarded as the “Dividend Detective” for good reason.
Her approach melds a conservative, blue-chip investment style with a value approach using dividend yield as a guide to value. Weiss felt that a stock’s dividend yield can say a lot about its value as well as the direction of the market.
Her approach, as outlined in this article, can be attributed to the book “Dividends Don’t Lie,” (Longman Publishing, 1988) co-authored by Janet Lowe. The methodology outlined in “Dividends Don’t Lie” served as a game plan for Weiss’ investment advisory newsletter, Investment Quality Trends, and is still widely followed today.
In the wise words of Geraldine Weiss, “An enlightened investor, one who can recognize value and quality, will survive in virtually any investment climate.” So how does one go about becoming an enlightened investor?
The first step is analyzing stocks by their dividend yield, which is annual indicated dividend per share divided by share price.
Weiss uses dividend yield as the primary valuation measure. She feels that the price of a stock is driven by its dividend yield. Value investors are drawn to stocks with high yields. As investors begin purchasing shares, the dividend yield’s denominator (price) increases, pushing the ratio lower. Once the price appreciation causes the yield to decline, investors begin to sell the stock because it is no longer an attractive investment on a dividend-yield basis. The downward pressure on price from investors exiting the stock pushes the dividend yield higher once more, making it an attractive purchase for value investors seeking yield. Value investors become enticed by the opportunity to realize a higher stream of cash payments relative to the price paid.
To Weiss, the dividend yield was the most important measure of investment value for three reasons: dividends are the result of earnings, a rising dividend trend is a predictor of growth and repetitive dividend-yield extremes establish reliable areas for undervalued and overvalued prices.
Weiss noted that dividend-paying stocks have a safeguard against price declines. When a dividend-paying stock’s price falls and the yield becomes attractive, value investors (who often pay close attention to the dividend yield) are drawn into the market and the stock’s price decline is halted. Stocks that do not pay dividends do not have such a safeguard.
Rather than emphasize price patterns, market structure or other factors, Weiss stressed that the dividend yield helps investors decide when to buy and sell.
The popular phrase “a bird in the hand is worth two in the bush” is used to explain the concept that, of the two profit paths (price performance and dividends), only dividend payments provide an element of certainty. Weiss points out that companies can manipulate earnings because of the accrual accounting method, which attempts to match expenses with the related revenues as opposed to when cash actually exchanges hands. On the other hand, dividends are real money. They’re tangible cash flows as opposed to figures on a balance sheet—hence Weiss’s book title, “Dividends Don’t Lie.”
Corporate executives and boards of directors are hesitant to decrease dividend payments because, historically, investors have had a significant adverse reaction when a company suspends or decreases its distribution. This ultimately leads to a lower stock price and questions regarding the company’s financial stability. If a company consistently raises its dividend payment, it is often perceived as a positive signal from management regarding the company’s profitability and strong financial position.
In her book, Weiss states that the dividend yield actually adds dividend growth as an additional component of total return:
Dividend yield + dividend growth + capital gains = total return
While the bond market can offer interest income—and, in some cases, price appreciation—bond interest payments and principal repayment are typically fixed. Growth, which accompanies and inspires rising stock prices, is available only in the stock market. When a company increases its dividend, the price of the stock often rises to reflect the increased value of the investment. Without dividend increases, sooner or later overpriced stocks will decline in value and price. The ability for a company to increase its dividend payment allows for the yield and share price to go up.
According to Weiss, price appreciation coupled with dividend yield and dividend growth escalates the total return to heights that are virtually impossible elsewhere, assuming that “the purchase has been made at undervalued levels, from which price appreciation and dividend growth is a reasonable expectation over a reasonable period of time.”
Weiss felt that for an investor to reap the most benefit of the dividend yield approach, he or she must:
Because price appreciation, dividend growth and yield are not guaranteed over time, Weiss used additional metrics to separate the worthy investments from the unworthy.
She felt that the most persuasive characteristic of a company’s quality is its standing as a blue-chip stock. “To save time and turmoil, to pave the way to profits and, most of all, to minimize risk, the dividend-yield theory should be applied only to the most prosperous and progressive corporations on the stock exchanges—the blue chips.”
While there are young growing companies that have high-quality characteristics, Weiss believed that their risk runs high. Blue chips, on the other hand, offer few unpleasant surprises, have the benefit of being managed by experienced leaders and offer more visibility than smaller firms. Ultimately, blue chips are the forefront of every market move—they are the first to rise in a bull market and the last to fall when the market declines.
To measure which stocks were blue chips, Weiss outlined the following metrics:
Weiss believed that the only reliable way to recognize good management is by its long-term performance. This can be demonstrated by management’s proven ability to increase company earnings and, in doing so, provide a means for increasing the dividend.
An increasing trend of dividend payments shows the firm’s willingness to share the company’s good fortune with shareholders. A company that regularly boosts its dividend, irrespective of economic or financial fluctuations, shows strength and steadiness.
Weiss does not require a dividend increase every year, just around 40% of the time.
Even under the finest management, firm earnings are responsive to the overall economic environment (which is why Weiss didn’t require a company to increase earnings every year over the last 12 years). However, Weiss sought well-managed blue chips, and good management goes hand in hand with increasing earnings. Earnings growth demonstrates the firm’s ability to weather difficult environments as well as thrive during times of economic growth.
Additionally, higher earnings, or management’s expectations of higher earnings, is what drives dividend growth.
To properly determine a stock’s dividend cycle, one needs to examine dividend payments over a longer-term period. This metric sometimes rules out young industries.
This wasn’t a hard rule for Weiss, because she sometimes selected blue chips that had not been around for 25 years. But most of the companies on her radar had been paying dividends for 25 years.
More shares outstanding leads to higher liquidity in the market.
Institutional investors purchase stocks that are liquid so they can purchase shares without significantly disrupting the stock price. Therefore, sufficient liquidity helps to guard against manipulation of share price.
Weiss asserted that institutional investors (mutual funds, banks, insurance companies, pensions and retirement funds) dominate roughly 80% of all stock trading in the market on any given day. Because of the scrutiny and strict conditions under which institutional investors operate, they theoretically “must” invest in high-quality stocks.
However, of the six criteria for blue chips, the level of institutional ownership was the least rigid to Weiss.
Standard and Poor’s classifies common stock on a ranking based on earnings and dividends. Weiss quoted the S&P stock guide, “A ranking is not a forecast of future market price performance, but is basically an appraisal of past performance of earnings and dividends, and relative current standing.”
Weiss found the rankings a useful guide to investment quality. Although stocks needed to have a quality ranking of at least A– to make it onto her list, she allowed stocks to drop to B before removing them. The ranking is now called the S&P Capital IQ Quality Ranking. Company rankings are available on S&P Capital IQ datasheets and the methodology is outlined on S&P Dow Jones Indices website.
Once quality blue-chip stocks have been identified, Weiss uses four fundamental metrics to determine value.
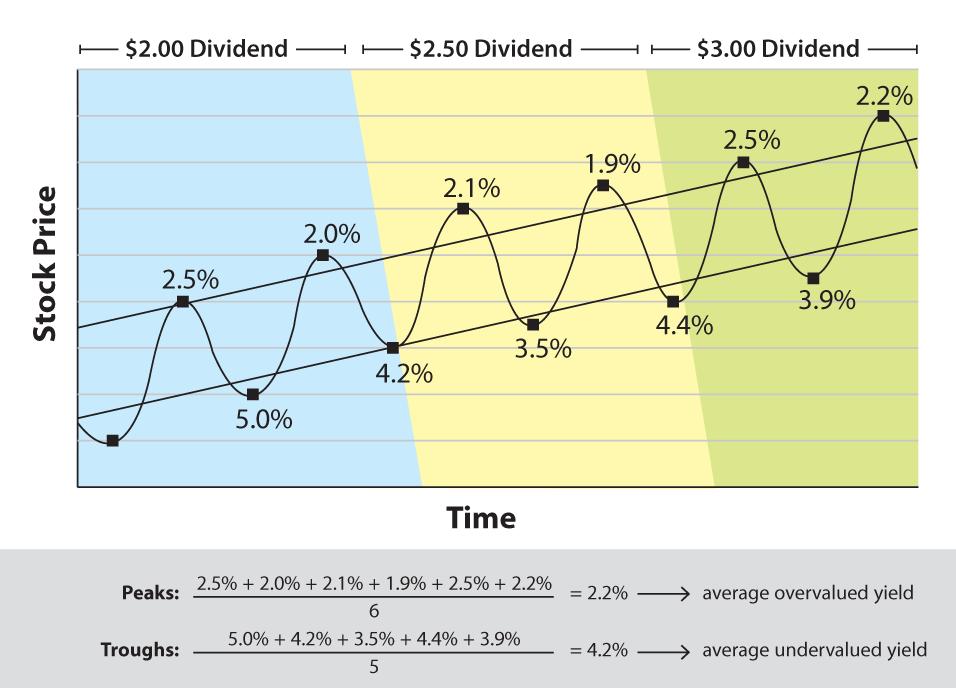
Weiss maintained that the dividend yield moves in cycles, with each stock maintaining its own cycle. The cycle is driven by Weiss’s underlying premise that “when all other factors that merit analytical consideration have been digested, the underlying value of dividends, which determines yield, will in the long run also determine price.”
Dividend yields fluctuate between highs and lows, or “turning points.” These peaks and troughs can be used to establish a channel of undervalued (high dividend yield due to low price) and overvalued (low dividend yield due to high price) price levels (Figure 1). Since the dividend yield is calculated using both price and dividend, the price at each turning point will vary. Weiss’ rule of thumb notes that stocks tend to be undervalued or overvalued when they are within the 10% range of their historical levels of high or low dividend yield. When a stock’s dividend yield is at or above its historical average high, it’s time to buy. When a stock’s dividend yield is equal to or below its historical average low, it’s time to sell. Weiss monitored the dividend yield cycle of the Dow Jones industrial average as a means for analyzing overall market valuations.
According to Weiss, investors who buy a stock when its shares are in the undervalued part of the dividend cycle and sell when they reach their historical overvalued level accomplish three objectives:
Weiss stresses that when using the dividend yield as a valuation metric, an investor must confirm that the payment is sustainable.
To judge the sustainability of a dividend payment, investors often look to the payout ratio, which is dividends per share divided by earnings per share. A 100% payout ratio means the firm is paying all of its earnings out via dividend payments. Payout ratios approaching 100% may not be sustainable.
Weiss noted that if a blue chip company’s payout is above 50% of earnings, the company may be undergoing a restructuring or experiencing a decline in earnings. Utilities are an exception, generally paying out around 70% of earnings. If the payout for a particular stock is below the market average, there is usually an explanation: The company is being stingy with its earnings, or the company is working on an expensive new project that will require additional cash, the capital is needed to reduce debt, repurchase stock or make an acquisition. It is always important to investigate and determine whether there is an identifiable reason for a low payout ratio.
Weiss felt that the price-earnings ratio (P/E) can help an investor confirm the message of the dividend yield trend because earnings are a sound measure of corporate growth as well as an indicator of investment value. The price-earnings ratio shows what an investor is willing to pay for a given level of earnings. A lower price-earnings ratio is more desirable because it represents more earnings for your money; you are paid less for a given level of earnings.
An investor should seek a price-earnings ratio that is historically low for a particular stock and that is also below the multiple for the Dow Jones industrial average. These can be found on popular finance sites such as Yahoo Finance.
Weiss made an exception for growth stocks with consistent records of rising earnings that were advancing faster than the market average and therefore commanding a higher price-earnings ratio.
Weiss warned against looking solely to the price-earnings ratio as a means of valuation: Prices are generally much more volatile than earnings and, again, earnings can be manipulated by management, causing distortions in the ratio. There is also a chance that the price-earnings ratio will never rise to its historical average, which is why this approach is best when combined with other qualifying metrics.
Third, Weiss looks for a strong financial position, with a current ratio (current assets dividend by current liabilities) of at least 2.0 and a debt-to-equity ratio (total debt divided by total equity) of no more than 50%. The current ratio measures liquidity, while the debt-to-equity ratio examines capital structure.
A low debt-to-equity ratio (as opposed to a higher ratio) indicates that a company will have an easier time surviving a high interest rate market and will be better able to endure a recession. In a tough economic environment, firms that are highly levered (or have a lot of debt in relation to equity) can see their earnings drain into the debt market, which reduces their ability to properly deploy assets. Weiss mentioned that another metric to analyze is a company’s bond rating—the higher the better.
Lastly, Weiss sought stocks with a price-to-book-value ratio that is no higher than 1.3; the closer to 1.0 the better.
Piggybacking off Benjamin Graham’s methodology, Weiss stated, “book value is the bare-bones worth of a company, below which, if the stock market were rational, no company’s price would fall.” But because the market is not always rational, book values can be vastly understated and stock prices sometimes fall below these “bargain-basement” levels. According to Graham, an investor should concentrate on stocks selling reasonably close to asset value, but certainly at no more than 30% above that figure, an approach that Weiss
adopted. Graham felt that the greater the premium above book value, the more the stock’s value depends on changing moods of the stock market.
Because book value is synonymous with net asset value, Weiss’s approach asserted that book value can be a significant measure of investment value in the stock market. However, a stock does not become a sound investment solely because it is trading near its book value, and there is no guarantee that its price will ever rise to book value.
Not all of Geraldine Weiss’s approach can be defined with quantitative measures. The following are additional guidelines she followed. The box below summarizes the Weiss approach in full.
High-quality ‘blue-chip’ stocks. To get on this initial list, stocks should have at least five of the following characteristics:
Stocks are removed from the blue chip universe when they no longer pass at least four of the rules.
Buy from the blue-chip stock list when changing share prices cause dividend yields to be within 10% of their historical highs, indicating that the stock is historically undervalued.
Aim for a portfolio of about 20 stocks selected from a variety of industry groups.
Continually monitor the portfolio to weed out stocks that no longer satisfy the requirements of good value or quality.
Sell stocks when they are within 10% of their historical low dividend yield, indicating overvaluation. If you tend to be reluctant to sell when prices are rising, consider placing a stop-loss order 10% below the overvalued price.
If dividend yields rise among stocks you own, make sure you understand why, but in general view it as an opportunity to buy more. However, if the rise occurs because a company omits a dividend, wait temporarily for prices to shore up and then sell, since it no longer meets Weiss’ blue-chip criteria.
Weiss’s approach was long term. She stated that the average length of time required for a stock to rise from undervalued to overvalued (on a dividend yield basis), is three years, and the average length of time to go from overvalued to undervalued is two years. Hence, a complete dividend-yield cycle takes five years on average. Weiss recommends analyzing dividend yields over at least a decade, although she preferred 25 years.
While good value can be found at any phase of the stock market cycle, Weiss felt that more undervalued stocks could be found at the end of a bear market or during a major correction in a bull market. To her, these times provided investors an exceptional opportunity to diversify.
Weiss felt that sometimes an investor’s worst enemy is himself, not only on the downside, but on the upside. When an investor “falls in love” with a stock, he can’t bring himself to sell it, even if it is overvalued. Her response to this situation is, “It is better to miss a little of the upswing than to lose a lot when the turn comes down.”
Weiss states that the best protection against a significant loss in the case of the market’s sudden decline is to place a stop-loss order at 10% under the price of any stocks in which one has substantial profits. Stop-loss orders are triggered to buy or sell a stock once a specific price level is reached.
Weiss said, “The greatest lesson of the 1929 crash is that buying on margin [borrowed money] in a mature bull market is a folly.” This particular phase of the market is accompanied by uncertainty and volatility. Therefore, the thoughtful investor should limit their risk and exposure to debt financing because in a sharp market decline, a margin call is almost guaranteed.
Margin calls are triggered when the value of a portfolio goes below the minimum amount required by the broker. Once a margin call is triggered, the investor must deposit more money to meet the minimum.
When stocks become overvalued (on a dividend-yield basis), they should be sold. The additional cash from selling overvalued positions should be used to reinvest in undervalued positions, or kept in a “safe place” for easy access when new undervalued stock selections appear.
Weiss felt that while at least 50% of available investment funds should be out of the market at the top, investors need not remain completely on the sidelines. Undervalued stocks with at least 10% annualized dividend growth over the past decade can be held through a bear market as a means of uninterrupted income, dividend growth and future capital gains.
If you have a relatively small nest egg (around $10,000), Weiss recommends investing equally in three to five stocks, with each of those stocks in different industries. Because the value of a small portfolio is especially vulnerable to variations in price, industries should be heavily vetted.
If an investor’s initial investment is large, it can be divided into seven or more equal parts. However, she recommends not holding more than 20 stocks at a time. Having 20 holdings ensures that the portfolio is diversified but also manageable. Weiss said, “No matter how many companies are included in the portfolio, one should be a utility.” She recommends the next selection be from the food or pharmaceutical industry because these industries are resistant to adverse economic events. As the portfolio gets larger and more mature, the investor can add to other industry groups as they become undervalued.
Geraldine Weiss takes a value-oriented approach to investing. As a value investor, her concern is with buying low and selling high. While many value investors focus on the price-earnings ratio or price-to-book ratio, Weiss’s chosen method of valuation is the dividend yield. She doesn’t discredit the price-earnings and price-to-book ratios; she merely feels that they are a means of validating the signal produced by a stock’s dividend yield.
Weiss focuses on developing an initial list of stocks she would be comfortable investing in (blue chips), stocks that have the ability to maintain and increase their dividend payments over time. After the list is developed, she invests in these stocks as they become undervalued on a dividend-yield basis, or when their dividend yield is within 10% of its historical average high.
Monitoring a stock’s dividend-yield cycle is an essential part of the Weiss approach. While the dividend yield can be used to gauge the valuation of the overall market, it must also be observed on an individual stock basis to properly time when to buy and sell.
Her approach is suited for long-term individual investors who seek a steady stream of dividends. It is less attractive to growth investors who aren’t concerned with buying undervalued stocks, but who are more interested in buying stocks with high-flying prospects regardless of the current value.
Weiss’ approach is one of the many stock screens tracked by AAII. See www.aaii.com/stock-screens for more information. More about Geraldine Weiss’ strategy will be discussed in the June 2016 issue of Computerized Investing, including guidance for creating quantifiable criteria for implementing the blue-chip dividend yield approach in a stock screen.
Stock Strategies

Investing Gurus

Value Investing

Ron Wacik from SC posted over 10 years ago:
Dave Gilmer from WA posted over 10 years ago:
Neil Schecker from PA posted over 10 years ago:
Jackie McClellan from IL posted over 10 years ago:
eddie from CA posted over 10 years ago:
Jackie McClellan from IL posted over 10 years ago:
David Phillips from AL posted over 10 years ago:
You need to log in as a registered AAII user before commenting.
Log InCreate an account