


Related

AAII InvestoGraphic
Nearly duplicating last year’s turnaround, this year’s top-performing AAII screening strategy ranked near the bottom in 2017.

Wayne Thorp leads a class in AAII's new Essential Investing Video Course. Go to https://www.aaii.com/ves for more information and to subscribe.
U.S. stocks had a tough act to follow in 2018 after 2017’s banner year. However, in the face of the Tax Cuts and Jobs Act (TCJA) that President Trump signed into law at the end of 2017, along with a growing U.S. economy and strong corporate earnings, there were reasons for optimism. As we come to the end of 2018, though, many investors probably feel let down by the U.S. stock market this year. Contributing to the underwhelming performance in U.S. stocks were the bubbling trade dispute between the U.S. and China, rising inflation, weakening energy and housing markets, a flattening yield curve and political uncertainty and strife here at home and in Europe.
Year to date through the end of November 2018, the S&P 500 index has endured two corrections—price declines of more than 10% but less than 20%. However, the S&P 500 was still up more than 3% on a price-change basis for the year through the end of November and stood less than 6% below its all-time high close set on September 20, 2018. The Dow Jones industrial average  (DJIA) has added 3.3% for the year and the Nasdaq composite is up 6.2% through the close on November 30.
The market declines also didn’t keep the stock market from entering record territory this year. On August 22, 2018, the S&P 500 marked its 3,453rd day without seeing a 20% decline, making this the longest bull market in U.S. history, by most accounts.
If you prescribe to the Presidential Election Cycle theory, 2018 has actually outperformed relative to historical results. Since 1896 when the DJIA was created, it has produced an average fiscal-year (November 1 through October 31) gain of 4.1% during second years in presidential cycles according to The Wall Street Journal. Between the close on October 31, 2017, and October 31, 2018, the Dow gained 7.4% on a price-change basis.
After record-low volatility in 2017, 2018 saw a reversion to the mean. The CBOE Volatility Index (the VIX)—the market’s collective “fear gauge”—hit an all-time low in November 2017 and was down nearly 20% in 2017. Looking at the 200-day moving average for the VIX in 2017, it was an almost perfectly straight downward sloping line. That came to an end almost as soon as the ball dropped to start 2018, and in a little over a month the VIX had jumped nearly 240% from 2017’s close. For the year, through the close on November 30, 2018, the VIX was up more than 63%.
Furthermore, 2017 did not see a single trading day where the S&P 500 was down 2% or more. Through the close on December 7, 2018, there have been 11 days this year with losses of at least 2% in the large-cap index.
During 2017, the largest intraday spread for the S&P 500—the percentage difference between the daily high and low values for the index—was 1.7%, set on December 1. For 2018 as of the close on December 7, the largest intraday spread for the S&P 500 was 4.7%, set back on February 5. That day the index fell 4.1%. In all, there have been five trading days in 2018 where the intraday spread for the S&P 500 was 4.0% or more (the average percentage change in the index on those days was a decline of 1.1%) and 40 trading days with an intraday spread that exceeded 2017’s largest daily spread.
In addition to the spike in market volatility, the average stock has not enjoyed the same success as the major U.S. stock indexes. Market participation in 2018 has not been broad-based. In fact, of the 6,180 U.S.-listed stocks tracked by AAII’s Stock Investor Pro fundamental stock screening and research database program, 4,017 (65.0%) are down more than 20% from their 52-week high year to date.
Drilling deeper into the data provides a clearer picture of the pockets of strength and weakness among U.S. stocks for 2018. Table 1 reports data on the number of stocks that are trading at least 20% below their 52-week high as of November 30, 2018. The data is broken down by index, exchange and sector [as designated by Thomson Reuters Business Classification (TRBC)].
Table 1 confirms that 2018 tended to favor larger companies in less economic-sensitive sectors. Among stocks that trade over-the-counter (OTC), more than three-quarters (77.8%) were trading at least 20% below their 52-week high at the end of November. OTC stocks tend to be very small companies—the median market capitalization (stock price multiplied by shares outstanding) for all OTC stocks in AAII’s Stock Investor Pro database as of November 30 was only $14.4 million. For comparison, stocks that are part of the New York Stock Exchange had a median market cap of $2.76 billion at the end of November and slightly more than half (53.6%) were down 20% or more from their 52-week high.
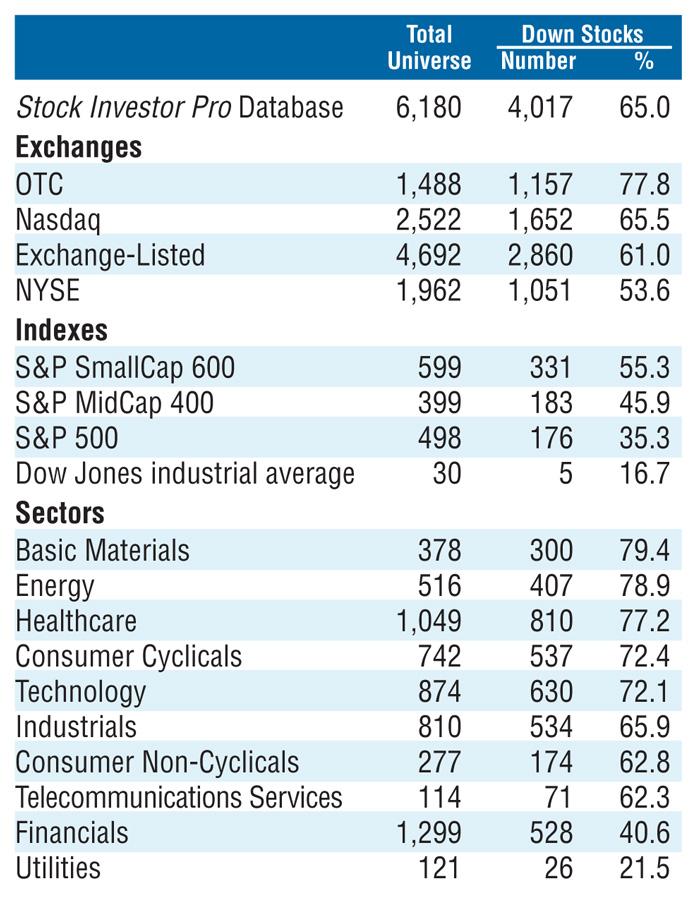
Only 35.3% of the S&P 500 companies in the Stock Investor Pro database were down 20% or more from their 52-week high at the end of November. Meanwhile, 55.3% of the companies in the S&P SmallCap 600 index were down 20% or more from their 52-week high.
Lastly, looking at sectors, those that are more closely tied to the economy have seen their stock prices suffer. For the stocks that make up the basic materials sector, nearly 80% are trading 20% or more below their 52-week high. More than three-quarters of the companies in the energy (78.9%) and healthcare (77.2%) sectors are also down at least 20% from their 52-week high.
On the opposite end of the spectrum, only 21.5% of companies in the utilities sector are down 20% or more from their 52-week high as of the end of November, while 40.6% of firms in the financials sector are down at least 20% from their 52-week high.
AAII has been developing, testing, refining and tracking a variety of quantitative stock strategies for 20 years. Many of these methodologies follow the approaches of popular investment professionals, while others are tied to basic investment principles. These strategies run the gamut of investment styles, from those that are value-based to those that focus primarily on price momentum and growth. However, most fall somewhere in the middle.
These strategies are intended for educational purposes and are not merely buy and sell lists. Their primary purpose is to highlight what works—and what hasn’t worked—when selecting stocks. While this annual recap article discusses, in-depth, the best- and worst-performing strategies for 2018, you can also review the long-term performance and see how these strategies performed in up and down markets.
AAII screens following the approach of a named investment professional do not represent their actual stock picks. The quantitative rules of each strategy are defined by our interpretations of their respective approaches. The results of the screening strategies, as well as the criteria for each approach, are programmed into AAII’s Stock Investor Pro and are posted in the Stock Ideas area of AAII.com.
Each month, 59 separate screening strategies are run using Stock Investor Pro, and the current companies meeting the criteria of each strategy are also reported in the Stock Ideas section of AAII.com. Stock Investor Pro subscribers can run the screening strategies themselves with the software (the data is updated daily, Tuesday through Saturday). AAII members can access the month-end screening results by going to the Stock Ideas area of AAII.com (www.aaii.com/stockideas). The results are posted there on or around the 15th of each month (excluding weekends and holidays) using data from the previous month’s end.
Looking at the performance for the 59 AAII stock strategies this year in Table 2, you can see that 2018 hasn’t been an overly promising year for quantitative stock screening. Only 14 of the 59 screening methodologies AAII tracks posted positive returns for the year through the end of November. Another—Foolish Small Cap 8 Revised—ended the year flat, which is attributable to the approach not yielding a single passing company all year. Ten of the AAII screening strategies outperformed the S&P 500’s 3.2% price gain through the end of November. The median price change of all AAII stock screening strategies through November 30, 2018, was a 5.2% loss, compared to the price gain of 16.3% last year for the same set of screens. [Editor’s note: At the request of Jordan Kimmel, AAII no longer tracks the MAGNET approaches, one of which was the top performer last year.] None of the AAII screening methodologies posted its best year over the backtesting period beginning in 1998. However, the William O’Neil CAN SLIM screen incurred its weakest year ever for the backtesting period, posting a 25.7% decline for the year through the end of November. The approach’s worst year previously was 2015 when it posted a 10.5% decline. This year was only the sixth year over the 21-year testing period where the “original” CAN SLIM strategy posted a decline.
Table 2. Stock Ideas on AAII.com Ranked by 2018 YTD Performance
Table 2 summarizes the performance and variability of the screening strategies tracked on the Stock Ideas section of AAII.com, ranked in descending order by year-to-date price change through the close on November 30 (see the The AAII Stock Ideas box below for more information about them). All of the screening strategies that AAII tracks have been developed and backtested using Stock Investor Pro and all but three—the Dogs of the Dow, Dogs of the Dow Low-Priced 5 and Magic Formula approaches—are prebuilt into the software. Table 2 also presents the price change performance (excluding dividends and transactions costs such as commissions, bid/ask spreads, time and price slippage, etc.) over various periods for each approach. New this year, we now categorize the screening strategies based on the “factors” that underlie each strategy. Factor investing has become a popular way to seek out excess returns. Common factors used today include value, momentum, size, quality, volatility and yield. A key at the bottom of the table explains the initials and the Factor Categories of AAII Screening Strategies box further explains them.
AAII has been developing, testing and refining a wide range of screening strategies over the years. Many of the screens follow the approaches of popular investment professionals, while others are tied to basic principles of investing. These approaches run the full spectrum, from those that are value-based to those that focus primarily on growth, while most fall somewhere in the middle.
Screens following the approach of an investment professional do not represent their actual stock picks. The rules of each screen are defined by our interpretations of their respective investment approaches. The results of the screening strategies, as well as the criteria for each screen, are programmed into the Stock Investor Pro program and are also posted in the Stock Ideas area of AAII.com.
Each month, 59 separate screens are performed using AAII’s Stock Investor Pro and the current companies passing each screen are reported. Stock Investor Pro subscribers can run the screens themselves on a daily basis, while AAII members can access the screening results by going to the Stock Ideas area of AAII.com (www.aaii.com/stockideas). The results are posted to AAII.com on the 15th of each month (excluding holidays and weekends) using data from the previous month’s end. The AAII Stock Ideas Update email will notify you when the strategies have been updated on AAII.com and provide a more in-depth look at a featured screen each month. You can sign up for this complimentary newsletter at www.aaii.com/email.
The performance of the stocks passing each screen is tracked on a monthly basis. The month-to-month closing price is used to calculate the return, with equal investments in each stock at the beginning of each month assumed. The impact of factors such as commissions, bid/ask spreads, time slippage (the time between the initial decision to buy a stock and the actual purchase) and taxes is not considered. This overstates the reported performance, but all approaches are subject to the same conditions and procedures. Higher turnover portfolios typically benefit more from these simplified rules.
Keep in mind, however, that performance figures for the AAII stock screening strategies represent price change only, and do not include dividend payments or dividend reinvestment. Therefore, the results of screens that tend to isolate large, dividend-paying stocks—such as the Dogs of the Dow (in the value category)—do not receive a boost from dividend payments or reinvestment. The 10 stocks passing the Dogs of the Dow screen at the end of November were yielding 3.1%, compared to 3.5% at the end of November 2017; investors holding shares in these stocks, therefore, would have a higher annual return by approximately this amount for the coming year.
Sell rules are the same as the buy rules: The hypothetical portfolios are completely reallocated using each subsequent month’s data. Thus, a stock is sold (no longer included in the portfolio) if it ceases to meet the initial criteria, and new stocks are added if they qualify. Note that we use these rules for backtesting purposes but do not necessarily advocate them as part of a real-world investment framework.
Stocks that no longer qualify are dropped even if the strategist behind a particular approach suggests different sell rules versus buy rules. This may shorten the holding period and increase the turnover relative to what the strategist would suggest for an actual portfolio.
For 2018 (through November 30), an approach that blends value, momentum and size factors—O’Shaughnessy Tiny Titans—led all AAII strategies with a 31.1% gain through the end of November.
The year 2018, generally speaking, favored growth investing, continuing last year’s trend. Interestingly, though, growth at the large-cap and small-cap levels are neck and neck. Through the end of November, the S&P 500 Growth index posted a total return—including dividends—of 9.4% while the S&P SmallCap 600 Growth index had a year-to-date total return of 8.8%. The strength of growth investing is also reflected in the return of the Nasdaq 100 index, which includes the 100 largest non-financial companies listed on the tech-laden Nasdaq Stock Market. For the year, the Nasdaq 100 had a price gain of 8.6% through the end of November.
In comparison to growth investing, value investing struggled this year across all market-cap segments. The total returns of the S&P MidCap 400 Value and S&P SmallCap 600 Value indexes were negative through the end of November, while the S&P 500 Value index posted a year-to-date total return of 0.6%.
It is worth mentioning that all of the S&P style and market-cap indexes are market-cap weighted, which means the largest stocks in each of the indexes have a greater impact on the index’s overall performance. Indicative of the continued relative strength of larger stocks this year, the typical exchange-listed stock saw its shares fall by 4.8% through the end of November. As of November 30, 2018, the median market capitalization of all exchange-listed (non-OTC) companies in Stock Investor Pro was around $918 million.
The uneven year in stock prices pushed valuations lower from their 20-year highs of a year ago across all market-cap segments. Table 3 shows the median trailing price-earnings (P/E), price-to-book-value (P/B) ratio, price-to-sales (P/S) ratio and dividend yield for the constituents for the S&P 500, S&P MidCap 400 and S&P SmallCap 600 indexes as of the end of each year from 1998 through 2017 and as of the end November 2018. These figures were calculated by taking the median values of the stocks tracked by Stock Investor Pro that are in each of these three S&P indexes.
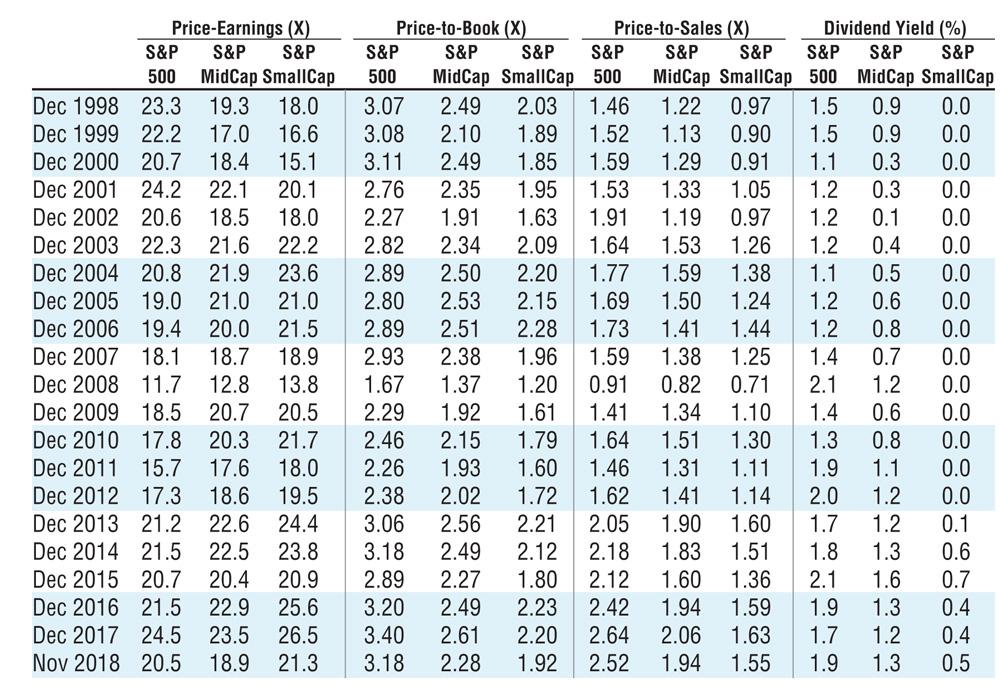
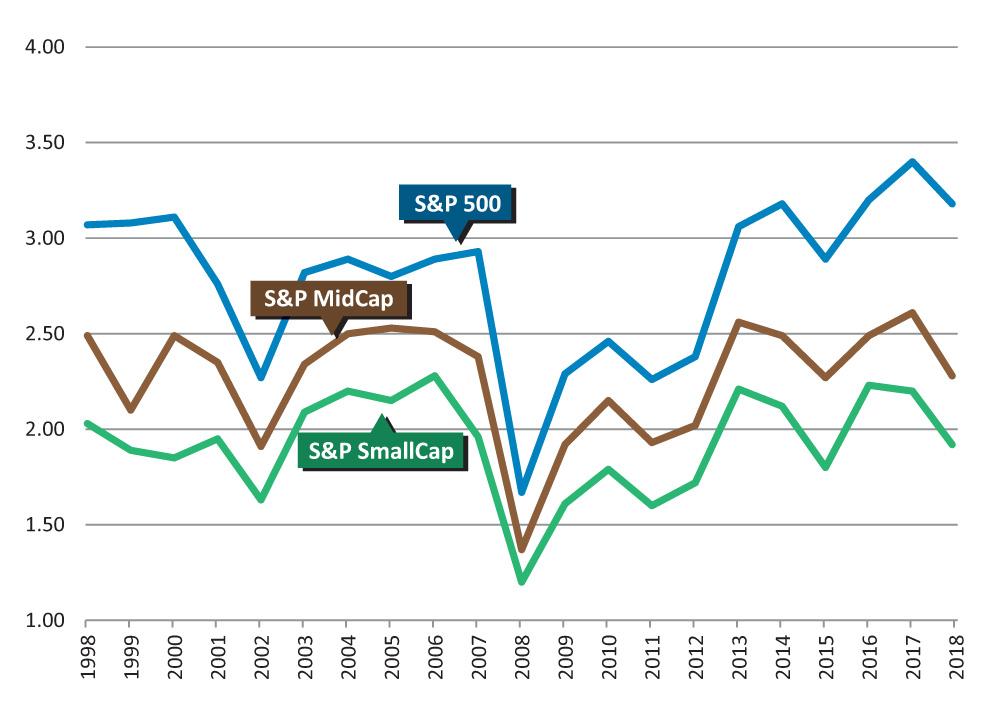
The chart in Figure 1 represents the trend in the median end-of-year price-to-book-value ratios for each of the S&P market-cap indexes. These trends generally track those exhibited by the multiples in Table 3. All three indexes saw the median price-to-book-value ratio of their underlying stock climb significantly in the post-financial-crisis period. After falling to their lowest levels since 1998 at the end of 2008 for all three indexes, there was a sharp rebound in the nine proceeding years. During that time, the spreads between the price-to-book-value ratios for the three indexes have also widened. The median price-to-book-value ratios for both the S&P 500 and S&P MidCap 400 indexes hit 20-year highs in 2017 at 3.40 and 2.61, respectively. The S&P SmallCap 600 saw the median price-to-book-value ratio of its constituents hit a high of 2.23 at the end of 2016 and ended 2017 at 2.20. In 2018, as of the end of November, the median price-to-book-value ratios for the underlying stocks of the three indexes had fallen from the 2017 values: The S&P 500 price-to-book-value ratio was 3.18, while it was 2.28 for the S&P MidCap 400 and 1.92 for the S&P SmallCap 600 index.
Nearly duplicating last year’s turnaround, this year’s top-performing screening strategy ranked near the bottom in 2017. This year the O’Shaughnessy Tiny Titans approach leads the way with a 31.1% price gain through the end of November, after ranking sixth-worst last year with a price decline of 7.0%.
AAII tracks several screens from James O’Shaughnessy, the founder and chairman of O’Shaughnessy Asset Management LLC, an asset management firm headquartered in Stamford, Connecticut. The O’Shaughnessy screens that AAII has developed are based on the strategies outlined in his books “What Works on Wall Street: A Guide to the Best-Performing Investment Strategies of All Time,” (3rd Edition, 2005, McGraw-Hill) and “Predicting the Markets of Tomorrow: A Contrarian Investment Strategy for the Next Twenty Years,” (2006, Penguin Group). It is from the latter book that the concept of the Tiny Titans approach was derived.
O’Shaughnessy’s research dates back to the late 1790s and found that equity markets tend to move in trends of about 20 years. According to this pattern, a 20-year trend began in early 2000 during which greater returns will be earned by small- and mid-cap stocks and large-cap value stocks. The previous 20-year cycle favored large-cap growth stocks, while small- and mid-cap stocks and large-cap value stocks were, on average, underperforming the market.
The Tiny Titans approach focuses on low-price micro-cap stocks. Much research has been done regarding the success of investing in this market-cap category. AAII’s Model Shadow Stock Portfolio is based on a study that showed that small- and micro-cap stocks tend to outperform the overall market over long periods.
O’Shaughnessy believes the reason for this outperformance is that few analysts follow these small stocks. Also, many institutional investors and mutual funds cannot trade these stocks without moving the price due to the relatively small number of outstanding shares. This leaves room for surprises, which can lead to a performance “pop.” O’Shaughnessy also says that micro-cap stocks have a low correlation with the overall stock market, making them a potential hedge in a portfolio of larger-cap stocks.
AAII’s version of O’Shaughnessy’s Tiny Titans stock screen consists of very few criteria. First, all foreign stocks and over-the-counter stocks are eliminated. Next, a stock’s market capitalization must be between $25 million and $250 million. For the universe of exchange-listed (non-OTC) stocks as of the end of November, the median market cap was $917.5 million and the average was $8,477.5 million.
After filtering out the larger-capitalization stocks, the Tiny Titans screen looks for stocks with price-to-sales ratios of less than 1.0. O’Shaughnessy uses this as a proxy for “cheapness,” as opposed to a price-earnings ratio. He reasons that all viable companies have sales, and sales are harder to manipulate than earnings. In his book “What Works on Wall Street,” O’Shaughnessy found that stocks with low price-to-sales ratios produced higher returns. As of November 30, 2018, a price-to-sales ratio of 1.0 ranked in the bottom 30% of all U.S.-listed stocks.
Finally, O’Shaughnessy thinks investors should hold 25 stocks in this micro-cap portfolio to diversify the risk that goes along with holding such volatile stocks. He narrowed the list to the 25 stocks with the highest 52-week relative strength as compared to the S&P 500. So, on a monthly basis, we track only those 25 companies with the highest 52-week relative strength. As of the end of November, the 25 companies passing the O’Shaughnessy Tiny Titans strategy ranked in the top 88% of all stocks regarding 52-week relative price strength.
For a stock investment strategy to be useful, it must be investable. That means a quantitative approach needs to generate a large enough universe of passing companies on which to perform additional due diligence to identify investment candidates. Since the O’Shaughnessy Tiny Titans screen looks for the 25 companies with the highest price strength over the last year after applying the market cap and value filters, there are always companies passing. Keep in mind, however, that there may be periods when the companies with the “best” price strength may still be down over the last 52 weeks. The Tiny Titans methodology looks for those companies with the strongest price performance, but not necessarily a positive price change.
The average monthly price returns in 2018 for the stocks comprising the O’Shaughnessy Tiny Titans screen’s hypothetical portfolio ranged from a loss of 10.7% in November to a gain of 17.8% in March.
Three of the most widely tracked investment factors are value, growth and momentum, and many of this year’s top AAII screening strategies capture one or more of these factors.
Of the 10 AAII screening methodologies that beat the S&P 500 through the end of November, eight had a value component to them. Value investing entails buying shares of unappreciated or neglected companies at attractive prices. Investment gurus such as David Dreman and Benjamin Graham believe that investors tend to pay too much for companies that appear to have the best prospects at the moment and react too negatively to companies considered to have the weakest prospects. This is a behavioral bias that is best overcome by using a quantitative approach or model with rules to help us overcome our natural inclinations. The mispricing of securities tends to be a self-correcting process that contrarian investors can use to their advantage.
The price-earnings ratio, or earnings multiple, is the most common valuation metric used in the stock screening strategies tracked by AAII. The basic price-earnings ratio is computed by dividing the current stock price by earnings per share for the most recent 12 months. It is followed so closely because it relates the market’s expectation of future company performance, embedded in the price component of the equation, to the company’s actual recent earnings performance. The greater the expectation, the higher the multiple of current earnings investors are willing to pay for the promise of future earnings. If the market has low earnings growth expectations for a firm, or views earnings as suspect, it will not be willing to pay as much per share as it would for a firm with high and more certain earnings growth expectations.
The price-to-book-value ratio is the second most common value filter found in the value screens on AAII.com. The price-to-book-value ratio is determined by dividing market price per share by book value per share. Book value is generally determined by subtracting total liabilities from total assets and then dividing by the number of shares outstanding. It represents the value of the owners’ equity based on historical accounting decisions. If accounting truly captured the current values of the firm, then one would expect the current stock price to sell near its accounting book value. Over the history of a firm, many events occur that can distort the book value figure. For example, inflation may leave the replacement cost of capital goods within the firm far above their stated book value.
We also have examples of successful value stock approaches that employ the price-to-sales ratio—such as the O’Shaughnessy Tiny Titans approach—the price-to-cash-flow ratio or the dividend yield.
The bottom line is that you can identify attractively priced stocks with a variety of price multiples, but successful investors become experts in the strengths and weaknesses of a given multiple and use their value test as the first step in the selection process.
Generally speaking, you shouldn’t merely be looking for the cheapest stocks, just stocks that are trading below the market norm or below the firm’s past average multiple.
Four of AAII’s screening strategies that beat the S&P 500 year to date have a growth factor component. Stock prices, in the long term, are driven by a company’s ability to generate earnings. When trying to identify growth companies, your primary screen should provide you with a list of companies that are in the growth stage of their life cycle, not mature cyclical firms.
Many growth screens focus specifically on earnings growth (although growth in sales, cash flow and dividends may also be considered), such as:
Another common thread running through successful screening strategies is price momentum. Four of the 10 screening approaches AAII tracks that outperformed the S&P 500 this year had a momentum component. We can evaluate a stock’s price momentum by looking at its percentage change over a given period—for example, six months. However, it’s hard to say if being up 25% over the last six months or falling 25% is good or bad without context. We obviously would like to see our stocks go up, if we have a long position. But if our stock is up 25% over the last six months and the market is up 50%, the performance loses some of its luster. Likewise, if the market is down 50%, but our stock is down “only” 25%, we probably wouldn’t complain quite so much. For this reason, relative price strength is often a popular measure of a stock’s price momentum.
Using price momentum filters in conjunction with value-oriented filters has been found to enhance the performance of value strategies, too, by lessening the likelihood of buying into a “value trap”—a stock with a depressed price that remains depressed.
Momentum filters focus on changes or acceleration in price, such as:
In Stock Investor Pro, the relative strength index is calculated against the performance of the iShares S&P 500 ETF (IVV), which is used as a proxy for the S&P 500 index. Stocks with performance equal to that of the S&P 500 over the last 52 weeks have a relative strength index of 0%. A relative strength index value of 10% indicates that the stock outperformed the S&P 500 by 10%. Negative index numbers indicate underperformance relative to the index: A relative strength index reading of –5% means the stock has underperformed the S&P 500 by 5%.
Relative strength rank values compare a stock’s relative price performance against all other U.S.-listed stocks. So, a company with a 26-week relative price rank value of 90% ranks in the top 10% of all U.S. stocks in terms of relative price strength over the last six months (90% of all U.S. stocks have a weaker relative price strength over that period).
As mentioned earlier, the O’Shaughnessy Tiny Titans approach looks for micro-cap companies (size is another factor that research has shown to generate market-beating returns) with low price-to-sales ratios (value) and strong relative price strength (momentum).
The second-best-performing AAII screening approach for 2018 is the Dogs of the Dow: Low Priced 5, which is up 14.6% through the end of November. This approach focuses on the 30 companies that make up the Dow Jones industrial average and selects the five lowest-priced stocks (value factor) from the 10 Dow stocks with the highest dividend yields (yield factor).
AAII’s Stock Market Winners strategy, which has gained 13.5% for the year, is based on research performed by William O’Neil of CAN SLIM fame. Initially, O’Neil analyzed the common traits of the 500 biggest stock market winners dating back to 1953. The results of this study formed the basis of O’Neil’s CAN SLIM screening methodology. In the article “Investment Characteristics of Stock Market Winners,” from the September 1989 issue of the AAII Journal, Marc Reinganum examined the common traits of 222 stocks highlighted in a publication by William O’Neil & Co. titled “The Greatest Stock Market Winners: 1970–1983” to establish the characteristics that were common to these stocks prior to their rise to prominence. Based on his analysis, Reinganum came up with nine trading rules to help identify potential future winners. The approach includes the value factor of price-to-book-value ratio less than 1.0; the momentum factors of relative price strength of at least 70, relative strength rank in the current quarter that is greater than the rank in the previous quarter and current stock price that is within 15% of its two-year high; and the growth factors of accelerating quarterly earnings and positive five-year growth rate in earnings.
The AAII Foolish Small Cap 8 methodology captures growth, momentum and size factors. For the year, it gained 11.6% through the close on November 30, 2018. From a growth perspective, the strategy requires recent earnings and sales growth of at least 25%. The strategy’s momentum element seeks out companies with relative strength greater than 90%. Lastly, the Foolish 8 screening strategy caps a company’s annual sales at $500 million, which is used to identify smaller companies.
Rounding out the top five screens for 2018 is the Weiss Blue Chip Dividend Yield approach. This strategy makes use of yet another investment factor—yield (or carry)—as well as value and quality. Looking at dividends and yield, the approach requires that a company’s dividend must have increased over the last six years and that the dividend yield is within 10% of the seven-year average high yield. This level of yield also indicates that a stock is historically undervalued. From a quality standpoint, the strategy restricts the level of long-term debt to equity.
We nearly had a first-to-worst for this year, as the Philip Fisher approach, which ended last year as AAII’s best-performing screening strategy with a price gain of 97.3%, is down 30.4% through the end of November. This, however, placed the Fisher approach in the second-to-last position. The poorest-performing methodology for the year is the Oberweis Octagon approach.
The screening strategy integrates value, growth and momentum factors that stem from eight points that make up the Oberweis Octagon. They include:
Because this is an annual recap article, Table 2 ranks all the screening strategies that AAII tracks based on year-to-date price change. However, saying that a strategy is “good” or “bad” based on one year of performance isn’t practical or realistic.
Therefore, Table 4 ranks the AAII stock screening strategies over a longer period—specifically, on average annual price gain over the last 10 years. Ten years is typically a long enough period to be meaningful and long enough to capture at least one full economic cycle.
Table 4. Stock Ideas on AAII.com Ranked by 10-Year Performance
It’s worth noting that we are now 10 years removed from the financial crisis. That means that, for many of the strategies AAII tracks, their worst year on record is not included in this 10-year performance figure. As a result, we have seen some changes at the top regarding long-term performance.
The Price-to-Free-Cash-Flow approach continued its ascent this year and has reached the apex in terms of 10-year performance, with the best average annual price change over the last 10 years at 25.1%. The strategy supplanted the Estimate Revisions Top 30 Up methodology from the top spot, although it is a close second with a 10-year average annual price gain of 24.7%. The Stock Market Winners approach remains in third place with an average annual price gain of 24.4% over the last 10 years. Rounding out the top five, though, are two newcomers: The Richard Driehaus approach (24.3% average annual price gain over the last 10 years) and the T. Rowe Price strategy (22.4% 10-year average annual price gain).
The Price-to-Free-Cash-Flow approach requires companies to have positive free cash flow per share for each of the last five years as well as a price-to-free-cash-flow ratio that is below the industry median and the five-year average. The strategy also limits passing companies to the 30 each month with the lowest price-to-free-cash-flow ratio. Even though the approach is down 12.5% year to date, it has, on average, generated an annual gain of 25.1% over the last 10 years. In comparison, the average annual price gain in the S&P 500 over the same period has been 11.9%.
We also see some of the top performers over the last 10 years with other characteristics that continue to underlie many successful stock selection strategies, namely value, growth and earnings momentum. The Price-to-Free-Cash-Flow screen is a “pure value” approach. Two of the factors that the Stock Market Winners strategy looks for are weighted relative price strength over the last year to rank in the top 30% and a current share price that is within 15% of the two-year high. The weighted relative strength measure gives greater weight to more recent relative price strength.
The Driehaus strategy focuses on small- and mid-cap companies with a market cap of no more than $3 billion. Driehaus is also a strong proponent of momentum investing—identifying and buying stocks in a strong upward price move and staying with them as long as the upward move continues. For him, the primary catalysts to these rapid price increases are strong positive earnings surprises, sharp upward earnings revisions and very strong, consistent and sustained earnings growth and accelerating earnings and sales.
Among the worst performers over the last 10 years, only two strategies have negative average annual price gains, down from 10 at this time last year (AAII no longer tracks two of the 10 from last year’s list). Still at the bottom of the list is the Muhlenkamp strategy, with an average annual loss of 9.1% a year over the last 10 years. This approach looks for companies with above-average returns on equity, a reasonable price-earnings ratio based on prevailing inflation and interest rates, positive long-term earnings growth, profit margins that exceed the industry norm, a ratio of liabilities to assets that is below the industry norm and positive free cash flow. This methodology does not possess the relative valuation that we found in the top performers, as it caps the price-earnings ratio at 17, which is adjusted over time. Furthermore, it is one of the strategies that AAII tracks that does not combine value and momentum factors. The other strategy with negative 10-year performance is Kirkpatrick Value, which has an average annual 10-year loss of 4.4%.
Tables 2 and 4 also present the risk-adjusted return for each of the strategies that AAII tracks. This calculation adjusts the performance of each approach using their volatility as measured through standard deviation of returns, penalizing screens with higher standard deviations (for a more detailed explanation of the risk-adjusted return calculation, see the box below). Using risk-adjusted returns since inception (1998), the three best-performing strategies continue to be the Stock Market Winners (16.7%), Estimate Revisions Up 5% (15.9%) and Estimate Revisions Top 30 Up (15.8%). This year’s strongest AAII stock screening strategy, the O’Shaughnessy Tiny Titans approach, ranks fourth among the methodologies AAII tracks with an average annual risk-adjusted return of 15.3% since 1998. The median risk-adjusted return for all 59 screening strategies AAII tracks is 9.8%.
The formula for calculating the risk-adjusted return is as follows:
Margin Rate + (Benchmark Std Dev ÷ Portfolio Std Dev) (DJIA) (Portfolio Return – Margin Rate)
Where:
This calculation assumes that the portfolio return for a given stock screen is higher than the margin rate. If it isn’t, the risk-adjusted return calculation would be as follows:
Margin Rate + (Portfolio Std Dev ÷ Benchmark Std Dev) (DJIA) (Portfolio Return – Margin Rate)
Following this methodology, we calculate the risk-adjusted returns since inception for all of the AAII stock screening strategies.
The Estimate Revisions Up 5% strategy looks for upward revisions in annual earnings estimates; specifically, it identifies companies that have had their annual earnings estimates raised by at least 5% over the last month.
The Estimate Revisions Top 30 Up approach requires that the consensus estimates for the current fiscal year and next fiscal year have risen over the last month, that there has been at least one upward revision to the current and next fiscal-year consensus estimates, and that there have been no downward revisions in the current or next fiscal year’s consensus estimates. Finally, the set of passing companies is limited to those 30 that have seen the largest percentage increase over the last month in the consensus earnings estimate for the current fiscal year.
Five of the AAII stock screening strategies have negative average annual risk-adjusted returns. On a risk-adjusted basis, we see that the Murphy Technology approach is once again at the bottom with an average annual loss of 27.3%. This screening strategy looks for technology and telecommunications companies that have been growing sales by at least 15% a year over the last three years, as well as net margins and returns on equity (ROE) of at least 15%. Also, the Murphy Technology approach has a value filter based on the ratio of price to growth flow, which is a measure for identifying companies that are producing solid earnings and investing a large amount in research and development (R&D). This ratio compares the current share price to the amount of per-share earnings a company generates as well as the per-share R&D expense of the company.
Most stocks have some positive correlation with the overall market: When the market is going up, so do the values of many stocks. However, the extent of the increase varies.
When investing in individual stocks, you would like to outperform the market. Otherwise, you are probably better off investing in an index fund. By tracking the performance of our stock screening strategies over the latest bull and bear markets, you can see whether an approach outperforms the market during an uptrend or limits losses during a downtrend.
Among the AAII stock screening strategies, the Price-to-Free-Cash-Flow approach continues to have the best bull market performance, gaining an astounding 1,153.9% between March 1, 2009, and September 30, 2018. Given the recent volatility in the market, we chose not to extend the bull market period past the end of the third quarter at this time.
This year’s top strategy, the O’Shaughnessy Tiny Titans, has posted a 618.2% price gain during the current bull market.
Only one of AAII’s screening strategies has failed to generate a positive price gain during the current bull market: the Muhlenkamp approach is down 48.0%. By way of comparison, the S&P 500 has a bull market price gain of 296.4%.
Over the last bear market, O’Neil’s CAN SLIM approach had the smallest loss at –10.1% from November 1, 2007, through February 28, 2009. The approach benefited from being out of the market for much of that time, as its strict price momentum filters have few, if any, candidates during a prolonged market downturn. When no stocks pass a strategy at the beginning of a calendar month, AAII’s backtesting methodology considers the hypothetical portfolio to be fully invested in cash and out of the market. The biggest loser over the last bear market was the Dogs of the Dow Low Priced 5, which fell by 82.9%.
The O’Shaughnessy Tiny Titans strategy registered a 67.3% loss over the last bear market.
The volatility index compares the variability of returns, as measured by the standard deviation of return, for a given stock screening strategy to that of a benchmark. Standard deviation is a measure of return volatility computed using monthly returns since the beginning of 1998. The volatility index is the standard deviation of a strategy’s return divided by the standard deviation of return for a benchmark—in this case, the S&P 500. The volatility index provides a relative measure of risk by comparing the variation in return for a screen since the beginning of 1998 to the typical variation in return for the benchmark index. The volatility index of the S&P 500, therefore, is 1.00; methodologies with a volatility index below 1.00 are below average in risk.
All but one of AAII’s stock screening strategies have volatility indexes above 1.00, which is to be expected. Stock selection strategies, after all, typically pass anywhere from a handful of stocks to around 50, while the S&P 500 is made up of 500 very heavily traded companies. As of the end of November, the only approach with a volatility index lower than 1.00 continues to be the High Relative Dividend Yield strategy. The passing company list for this screen is made up of “safer” dividend-paying stocks. Its volatility index value of 0.99 means the approach is 1% less volatile than the S&P 500 since the start of 1998. Therefore, the screen’s risk-adjusted return (nearly) matches its average annual return since the start of 1998 at 8.8%.
The High Relative Dividend Yield approach requires a rising dividend for each of the last six years, a current dividend yield that is greater than the seven-year average yield, reasonable payout ratios (depending on the industry), liabilities levels that are below industry norms and historical earnings growth that exceeds the industry norm.
The AAII stock screening strategy with the best average annual risk-adjusted return, Stock Market Winners, has a volatility index of 1.44. This indicates that, since the beginning of 1998, the monthly variability of returns for the stocks held in this portfolio has been 44% higher than that of the S&P 500. This makes the Stock Market Winners approach the 25th-riskiest screen among the 59 screens AAII tracks. Among all AAII stock screening strategies, the median volatility index value is 1.54, meaning that the typical stock screen tracked by AAII has 54% more volatile returns than the S&P 500.
The Murphy Technology approach has the highest volatility index (2.77), indicating that the monthly variability of returns for the stocks held in this portfolio is nearly twice that of the S&P 500. Accordingly, its annualized loss of 4.9% since 1998 becomes an even more dismal risk-adjusted annualized loss of 27.3%.
The O’Shaughnessy Tiny Titans strategy is tied for the 15th-highest volatility index of all the AAII methodologies at 1.93. This transforms the screen’s average annual return of 22.4% since the start of 1998 to an average annual risk-adjusted return of 15.3%.
One trend that has developed over time is that the screens with a higher average number of passing companies tend to have lower volatility and, thus, a lower relative volatility index. For the five AAII stock screening strategies with the lowest volatility indexes, the historical median number of passing companies is roughly 35. However, the five approaches with the highest volatility indexes have had a median average number of passing companies of 13. For the eight strategies that, historically, have averaged fewer than 10 passing companies a month, the median volatility index is 1.94, more than 25% higher than the median volatility index for all AAII screening strategies. The median average number of monthly holdings for all AAII stock strategies is nearly 21. Furthermore, strategies with lower monthly turnover also tend to have lower volatility index values. The median average monthly portfolio turnover for the five methodologies with the lowest volatility index values is 21.4%, whereas the approaches with the five highest volatility indexes have a median average monthly turnover of 46.2%. The median average monthly turnover for all 59 AAII stock screening strategies is 33.2%.
The drawdown of a portfolio is the peak-to-trough decline, usually quoted as the percentage loss from the maximum value of the portfolio to the subsequent trough. As discussed, one measure of volatility is standard deviation. However, standard deviation considers both downside and upside volatility. Many investors prefer upside volatility and are concerned about drawdowns. During volatile markets, drawdown is a critical concern, especially for retirees.
Stock strategies with large drawdowns are, all else equal, not very attractive. However, how quickly the portfolio recovers from the drawdown is equally important. The Murphy Technology approach still has the largest drawdown among the 59 strategies tracked by AAII at 92.4%. The strategy lost over 92% from its peak value, in this case between May 2000 and December 2003. Being a strategy geared toward identifying technology stocks, it is probably not a surprise that this drawdown coincides with the bursting of the tech bubble. Even though it has been 179 months since the screen reached its 92.4% trough, the strategy is still down 89.5% from its 2000 peak as of November 30, 2018.
The Graham Defensive Investor Utility approach has the smallest drawdown among all AAII screens at 32.3%. This occurred between June 2007 and February 2008, during the global financial meltdown. Unlike the Murphy Technology approach, however, this strategy was able to recoup its peak-to-trough losses and achieve new highs within 40 months of its trough.
The O’Shaughnessy Tiny Titans strategy saw a maximum drawdown of 67.5%, which took 19 months to reach between August 2007 and February 2009. It then took 56 months to hit new highs.
For comparison, the median drawdown for all AAII stock screening strategies is 57.0%. The maximum drawdown for the S&P 500 is 52.6%, which transpired between November 2007 and February 2009. It took the index 49 months from that trough to achieve new highs.
The columns near the rightmost side of Tables 2 and 4 present the average number of passing stocks and the turnover percentage for each of the AAII stock screening strategies. For many of the approaches, patterns depend on the market cycle. For example, the High Relative Dividend Yield methodology has generated, on average, 35 stocks per month since the start of 1998. However, as dividend yields have fallen as the overall market value has increased, the screen has seen its average number of monthly passing companies fall such that only 19 companies have passed, on average, each month this year.
Overall, the Value on the Move PEG With Historical Growth approach has the highest average number of passing companies each month at 73. At the other end of the spectrum, the Kirkpatrick Value strategy has the lowest average number of passing companies each month at three. The median average of passing companies for the 59 AAII screening strategies is 21.
The average monthly turnover percentage indicates the percentage of stocks passing the screen in each month that are different from the previous month. The four Estimate Revisions strategies rank in the top five for highest monthly turnovers, ranging from 89.3% to 93.3%. These approaches look for companies that have had upward or downward earnings revisions over the past month. Not many companies will continuously pass them, since that would suggest that analysts are continuously revising the estimates of a specific company upward or downward month after month.
Also, keep in mind that, as a rule, value-oriented strategies tend to have lower turnover and growth-oriented approaches tend to have higher turnover.
The AAII stock screening strategy with the lowest turnover is the Dogs of the Dow approach, with an average monthly turnover of 7.9%. This strategy looks for those 10 stocks that are part of the Dow Jones industrial average that have the highest dividend yield. Since the initial stock universe is only 30, the stocks that pass this screen month to month are relatively constant.
The median average monthly turnover for AAII’s stock screening strategies is 33.2%.
The stock screening strategies are intended to be an educational tool to show what types of filters work over varying market conditions. They are not intended to be a buy or recommended list. At best they can be considered idea generators. You should analyze the passing stocks further before deciding whether or not to commit real dollars to them. Furthermore, since market conditions change, it is important to be adequately diversified.
One way to achieve sufficient diversification is to select stocks from multiple stock screening methodologies. However, it is not enough to simply choose those strategies that have the best long-term performance. Instead, it is useful to understand the forces influencing both the overall market and a strategy’s performance, and how changing economic conditions can impact both the market and individual stocks. Examining the characteristics of an investment methodology may reveal some practical problems you might face when trying to translate quantitative stock screening into real-world portfolio building.
Something else to keep in mind is that once you decide on which methodologies to follow, you cannot just let the quantitative screens choose your stocks.
Screening is a multi-step process. For some investors, this means first applying quantitative filters such as the screens we have discussed here to help you arrive at a set of candidates that all share the same base set of characteristics. This does not necessarily mean they are all good investments. It is important then to perform at least cursory qualitative analysis to decide whether they are right for your stock portfolio.
“What Works”: Key New Findings on Stock Selection, by James O’Shaughnessy, October 2013
Micro-Cap Stocks Are Less Widely Followed, Offer Benefits, an interview with Michael Corbett, June 2016
Five Common Traits of Successful Value Screens, by John Bajkowski, July 2014
AAII InvestoGraphic
AAII Stock Ideas
AAII Stock Ideas

Dave Gilmer from WA posted over 7 years ago:
You need to log in as a registered AAII user before commenting.
Log InCreate an account