


Related
Exchange-Traded Funds
by James B. Cloonan | May 2016

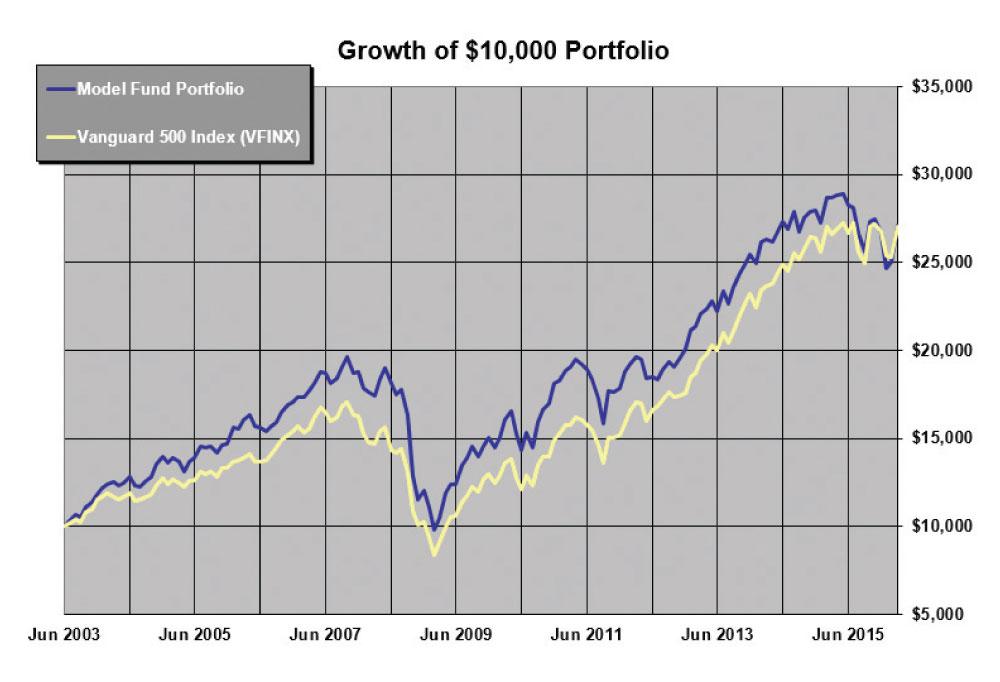
The Model Fund Portfolio is up 1.5% year-to-date.
This compares to 1.3% for the S&P 500 index, as measured by the Vanguard 500 Index fund  (VFINX).
The All-ETF Portfolio, a subset that contains only the exchange-traded funds in the Model Fund Portfolio, is up 3.1% year-to-date compared to 1.3% for the SPDR S&P 500 ETF (SPY).
These results and longer-term performance can be seen in Figure 1 and Tables 1, 2, and 3.
We are still in a weak period for small and value stocks but they have started to rebound a bit, as can be seen in the exchange-traded funds Guggenheim S&P MidCap 400 Pure Value (RFV) and Guggenheim S&P SmallCap 600 Pure Value (RZV). Over the past year Vanguard REIT Index ETF (VNQ) has been the best performer in the portfolio.
The very oil-dependent frontier markets, represented in the model portfolio by iShares MSCI Frontier 100 ETF (FM), have started to bounce back. I feel these funds have been overpunished and will get stronger.
Aston/Fairpointe Mid Cap N fund (CHTTX) reopened to new investors. I hope this will permit a return to their excellent stock-picking. Those of you who were not able to purchase this mutual fund previously can do so now. I feel that their year of underperformance was greatly influenced by its closing to new investors and not having inflows to fund new stock purchases.
There are no changes in either the Model Fund Portfolio or the alternative All-ETF Portfolio at this time, but please see the box below for changes to come.
I still have no great insight on the short-term market. The large number of pundits saying “take some money off the table” and/or “the recent move upward is a slight recovery in a bear market” makes me a bit hopeful about the short and intermediate term.
In the long term, I am always bullish.
We still have a long time before the election and months before we even know who is in the final running.
We will be discussing the Model Fund Portfolio and the All-ETF Portfolio again in the August AAII Journal, and you can follow their progress at here in the meantime.
|
|
|
Annual Return (%) |
|
|
|
|
|||||
| Type | Fund (Ticker) | Market Cap Size | YTD Return (%) | 1-Yr | 5-Yr | 10-Yr | Since 6/30/2003 | Fund Assets ($ Mil) | Exp Ratio (%) | Std Dev (36 Mo. Ann’l) (%) | Worst 3-Yr Cal Period (%) |
| MF |
Aston/Fairpointe Mid Cap N (CHTTX)* |
Large-Cap | 3.6 | -9.2 | 8.4 | 9.2 | 10.6 | 1,618.10 | 1.11 | 15.3 | -7.9 |
| MF |
Fidelity Capital & Income (FAGIX) |
** | 0.6 | -4.2 | 4.8 | 7.5 | 8.3 | 10,014.40 | 0.72 | 6.3 | -7.2 |
| MF | Fidelity OTC (FOCPX) | Large-Cap | -8.7 | -3.4 | 11.8 | 10.2 | 11.4 | 9,124.50 | 0.83 | 16.3 | -9.3 |
| ETF | First Trust US IPO (FPX) | Large-Cap | -1.9 | -6.3 | 15.6 | nmf | nmf | 579.1 | 0.6 | 14 | -2.3 |
| ETF | Guggenheim S&P 500 Equal Weight (RSP) | Large-Cap | 2.9 | -1.4 | 11 | 7.6 | 9.9 | 8,968.60 | 0.4 | 11.6 | -11.4 |
| ETF |
Guggenheim S&P MidCap 400 Pure Value (RFV) |
Mid-Cap | 7.5 | -5.2 | 8.58 | 6.8 | nmf | 91.8 | 0.35 | 16 | -4.3 |
| ETF |
Guggenheim S&P SmCap 600 Pure Value (RZV) |
Small-Cap | 5 | -9 | 8.02 | 5 | nmf | 164.2 | 0.35 | 18.8 | -8 |
| ETF | iShares MSCI Frontier 100 (FM) | Large-Cap | -1.3 | -14.7 | nmf | nmf | nmf | 420.1 | 0.79 | 13.5 | 3.4 |
| ETF |
Vanguard REIT Index (VNQ)*** |
Large-Cap | 6.3 | 3.9 | 11.7 | 6.66 | 11 | 30,149.60 | 0.12 | 15.6 | -11.9 |
| Avg of Funds in Actual Model Fund Portfolio† | 1.6 | -5.5 | 10 | 7.6 | 10.3 | 6,792.30 | 0.59 | 11.5 | -6.5 | ||
| Actual Fund Portfolio Performance†† | 1.5 | -5.5 | 7.3 | 5.4 | 8.1 | — | — | 11.8 | -6.4 | ||
| Optional Investment: | |||||||||||
| ETF | iShares Barclays 1-3 Year Treasury Bond (SHY) | Bonds | 0.9 | 0.8 | 0.7 | 2.4 | 2.7 | 11,437.40 | 0.15 | 0.7 | 0.3 |
| Comparison: | |||||||||||
| MF |
Vanguard 500 Index (VFINX) |
Giant-Cap | 1.3 | 1.7 | 11.4 | 6.9 | 8.1 | 26,317.00 | 0.17 | 11.2 | -8.4 |
|
nmf= no meaningful figure Source: Morningstar, Inc. Data as of 3/31/2016. |
|||||||||||
Table 2. Model Fund Portfolio Annual Performance
| Average Annual Return (%) | Cumulative Growth of $10,000 ($) | |||
| Model Fund Portfolio |
Vanguard 500 Index (VFINX) |
Model Fund Portfolio |
Vanguard 500 Index (VFINX) |
|
| 2003* | 18.6 | 15.0 | 11,858 | 11,503 |
| 2004 | 17.7 | 10.8 | 13,955 | 12,742 |
| 2005 | 5.4 | 4.8 | 14,711 | 13,350 |
| 2006 | 16.1 | 15.6 | 17,086 | 15,436 |
| 2007 | 10.2 | 5.4 | 18,820 | 16,267 |
| 2008 | -35.9 | -37.0 | 12,071 | 10,245 |
| 2009 | 24.9 | 26.5 | 15,080 | 12,959 |
| 2010 | 20.3 | 14.9 | 18,136 | 14,892 |
| 2011 | -1.7 | 2.0 | 17,827 | 15,186 |
| 2012 | 12.6 | 15.8 | 20,075 | 17,589 |
| 2013 | 26.7 | 32.2 | 25,436 | 23,250 |
| 2014 | 9.9 | 13.5 | 27,962 | 26,388 |
| 2015 | -4.5 | 1.3 | 26,711 | 26,719 |
| 2016 YTD** | 1.5 | 1.3 | 27,103 | 27,069 |
| Since Incep** | 8.1 | 8.1 | 27,103 | 27,069 |
|
*June 30 to December 31, 2003. **Through March 31, 2016. Portfolio was started on June 30, 2003. |
||||
Table 3. Alternative All-ETF Portfolio
| Annual Return (%) | |||||
| Fund (Ticker) | Weight* | YTD Return (%) | 1-Yr | 3-Yr | Since 12/31/2012 |
| First Trust US IPO ETF (FPX) | 20% | -1.9 | -6.3 | 13.3 | 16.9 |
| Guggenheim S&P 500 Equal Weight (RSP) | 20% | 2.9 | -1.4 | 11.3 | 14.4 |
|
Guggenheim S&P MidCap 400 Pure Val (RFV) |
20% | 7.5 | -5.2 | 7.5 | 11.8 |
|
Guggenheim S&P SmCap 600 Pure Val (RZV) |
20% | 5 | -9 | 7.5 | 10.2 |
| iShares MSCI Frontier 100 (FM) | 10% | -1.3 | -14.7 | 0.4 | 2.8 |
|
Vanguard REIT Index (VNQ) |
10% | 6.3 | 3.9 | 10.3 | 12.2 |
| Weighted Avg of ETFs in Portfolio† |
|
3.2 | -5.5 | 9 | 12.1 |
| Actual ETF Portfolio†† |
|
3.1 | -5.4 | 8.6 | 11.7 |
|
Comparison: SPDR S&P 500 (SPY) |
1.3 | 1.7 | 11.7 | 14.2 | |
|
* Weights were adjusted at the close of 9/30/2014. †A weighted average return of the ETFs in the current All-ETF Portfolio. ††Performance of actual All-ETF Portfolio, including reinvested dividends. Source: Morningstar, Inc. Data as of 3/31/2016. |
|||||
As I planned for at least semi-retirement, I couldn’t help but think about the 37 years since I started AAII, and what has happened to the stock market and to the approaches and methods of investing during that time. Lower commissions, tighter bid/ask spreads, no-load funds, exchange-traded funds, index funds, and other new products have all changed the shape of the investment landscape. While our investing has been improved by these advances, I believe that investment strategy—which I feel is even more important—has not advanced as far as it could have and should have.
I am proud of the contribution AAII has made toward helping over a million individual investors move from an unstructured approach to investing, which I call Level 1 investing, to a more structured approach that incorporates contemporary portfolio theory and practice, which I call Level 2 investing.
Looking back over past progress and based on real-world experience, I feel that we can move forward to a new level of investing strategy and I have written a book in that vein called “Investing at Level3.” It departs quite a bit from conventional wisdom, but I believe it could lead to twice the assets at retirement over an investment lifetime as compared to current best practice.
More information about the book can be found here, but I mention it here because the All-ETF Portfolio will be changed over the coming months to reflect the basic passive portfolio approach I describe in “Investing at Level3.”
—Jim Cloonan
Model Fund Portfolio: Selection Rationale
The fund selection rationale consists of two distinct approaches. The first approach is to select actively managed funds where the managers have shown a long-term ability to outperform the market after allowing for additional portfolio risk, regardless of the sector invested in. A fund must have the following characteristics to be considered for the Model Fund Portfolio:
The above rules apply to new fund selections. Funds will not automatically be eliminated if they later violate the rules without considering other factors.
The second methodology selects investment approaches that have provided excess returns or reduced portfolio risk to investors over the long term and then searches for the best traditional fund or exchange-traded fund (ETF) in that area. Factors to be considered are:
(FAGIX), which invests in distressed securities.
Exchange-Traded Funds
AAII Model Portfolios

Portfolio Strategies

Ted Pickett from VirginiaIn posted over 10 years ago:
William Krygsman from IL posted over 10 years ago:
Donald Myers from AZ posted over 10 years ago:
You need to log in as a registered AAII user before commenting.
Log InCreate an account