


Related

Portfolio Strategies

The S&P 500 index down 5.0% in January??? Small-cap value stocks, usually strongest in January, down even more at –9.3% [as measured by the Guggenheim S&P SmallCap 600 Pure Value (RZV)]??? All this coming off the worst pre-election year since the great depression???
Let’s hope the next break with history is in the bullish direction.
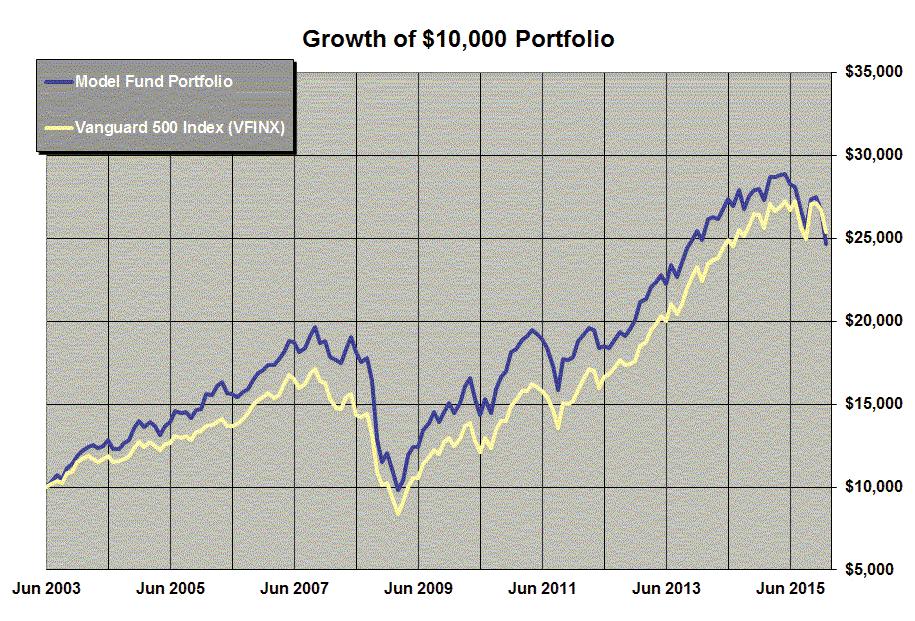
Year to date, the Model Fund Portfolio was down 7.7% and the All-ETF Portfolio was down 7.0% as of January 31, 2016. Those results and longer-term performance can be seen in Figure 1 and Tables 1, 2 and 3.
I have discussed the value of real estate investment trusts (REITs) before, but the performance of the Model Fund Portfolio over the last 12 years illustrates how effective they can be. Very long-term equity REITs return about the same as the rest of the market, but they move at different times and provide excellent diversification without having to sacrifice return. In the Model Fund Portfolio, REITs are represented by the Vanguard REIT Index fund (VNQ): It has an average annual return of 10.3% since the portfolio’s inception, and lost only 3.3% year to date as of January 31, 2016.
The other significantly different return was that of iShares MSCI Frontier 100 (FM). The impact of lower oil prices combined with general foreign economy weakness hit the exchange-traded fund hard in 2015. That impact seems to have lessened.
There are no changes in either the Model Fund Portfolio or the All-ETF Portfolio for this quarterly review period.
Several AAII members have pointed out that many employee defined-contribution retirement plans do not permit use of exchange-traded funds. I think companies still feel that ETF tradability makes them unsuitable—or at least that is what they say. The fact that fees for non-index ETFs are lower than for the equivalent mutual funds might be a factor. The only recourse for this situation is to complain to the retirement fund administrator through your benefits department. If enough people voice an opinion, there may be a change.
Somewhat on the other side of the argument is the fact that with the growth of actively managed ETFs, the difference between market value and book value of the funds is widening. When that occurs, a whole new decision factor appears and these ETFs have to be viewed as an investor would view closed-end funds.
I should write “Guessing Forward.” I don’t think I or anyone else can make sense out of the last year. Bad things make the market go up and good things push it down. There is a lot of uncertainty about the market, the economy (here and abroad) and politics, and uncertainty is usually not bullish. However, the elimination of uncertainty can be very bullish.
If I had to choose a single indicator, my favorite would be “what are the talking heads saying?” and they almost all (in mid-February) are saying it is a bear market and that investors should reduce equity holdings. That gives me real hope that a market recovery is not far off.
We will publish our next Model Fund Portfolio update in the May issue of the AAII Journal, and by then it should be clearer. We may even know who the real candidates for president are. In the meantime, you can keep abreast of the Model Fund Portfolio here.
| Annual Return (%) |
|
||||||||||
|---|---|---|---|---|---|---|---|---|---|---|---|
| Type | Fund (Ticker) |
Market
Cap
Size
|
YTD
Return
(%)
|
1-
Yr
|
5-
Yr
|
10-
Yr
|
Since
6/30/2003
|
Fund
Assets
($ Mil)
|
Exp
Ratio
(%)
|
Std
Dev
(36 Mo.
Ann’l)
(%)
|
Worst
3-Yr
Cal
Period
(%)
|
| MF | Aston/Fairpointe Mid Cap N (CHTTX)* |
Large-Cap
|
-9.0
|
-15.4
|
6.8
|
7.6
|
9.6
|
1,487.1
|
1.11
|
14.7
|
-7.9
|
| MF |
Fidelity Capital & Income  (FAGIX) (FAGIX) |
**
|
-3.2
|
-5.1
|
4.4
|
7.3
|
8.1
|
9,756.2
|
0.72
|
6.0
|
-7.2
|
| MF | Fidelity OTC (FOCPX) |
Large-Cap
|
-12.7
|
-3.1
|
12.0
|
9.8
|
11.2
|
8,737.6
|
0.83
|
15.9
|
-9.3
|
| ETF | First Trust US IPO (FPX) |
Large-Cap
|
-7.4
|
-3.1
|
15.7
|
nmf
|
nmf
|
639.0
|
0.60
|
13.7
|
-2.3
|
| ETF | Guggenheim S&P 500 Equal Weight (RSP) |
Large-Cap
|
-5.6
|
-5.3
|
10.1
|
6.9
|
9.3
|
8,438.7
|
0.40
|
11.0
|
-11.4
|
| ETF | Guggenheim S&P MidCap 400 Pure Value (RFV) |
Mid-Cap
|
-7.8
|
-12.5
|
6.3
|
nmf
|
nmf
|
87.8
|
0.37
|
14.5
|
-4.3
|
| ETF | Guggenheim S&P SmCap 600 Pure Value (RZV) |
Small-Cap
|
-9.3
|
-13.6
|
6.2
|
nmf
|
nmf
|
124.6
|
0.36
|
17.6
|
-8.0
|
| ETF | iShares MSCI Frontier 100 (FM) |
Large-Cap
|
-7.2
|
-18.4
|
nmf
|
nmf
|
nmf
|
425.3
|
0.79
|
13.3
|
3.4
|
| ETF | Vanguard REIT Index (VNQ)*** |
Large-Cap
|
-3.3
|
-7.3
|
10.3
|
6.3
|
10.3
|
27,007.0
|
0.12
|
14.6
|
-11.9
|
| Avg of Funds in Actual Model Fund Portfolio† |
|
-7.3
|
-9.3
|
9.0
|
7.6
|
9.7
|
5,868.4
|
0.59
|
10.8
|
-6.5
|
|
| Actual Fund Portfolio Performance†† |
|
-7.7
|
-9.6
|
6.1
|
4.7
|
7.4
|
|
|
11.1
|
-6.4
|
|
| Optional Investment: | |||||||||||
| ETF | iShares Barclays 1-3 Year Treasury Bond (SHY) |
Bonds
|
0.6
|
0.5
|
0.7
|
2.4
|
2.7
|
12,580.5
|
0.15
|
0.7
|
0.3
|
| Comparison: | |||||||||||
| MF | Vanguard 500 Index (VFINX) |
Giant-Cap
|
-5.0
|
-0.8
|
10.7
|
6.4
|
10.8
|
24,799.3
|
0.17
|
10.8
|
-8.4
|
|
nmf= no meaningful figure. |
|||||||||||
Table 2. Model Fund Portfolio Annual Performance
|
|
Average Annual Return (%) |
Cumulative Growth of $10,000 ($) | ||
|
|
||||
|
|
Model Fund Portfolio |
Vanguard 500 Index (VFINX) |
Model Fund Portfolio |
Vanguard 500 Index (VFINX) |
|
|
||||
|
|
||||
| 2003* | 18.6 | 15.0 | 11,858 | 11,503 |
| 2004 | 17.7 | 10.8 | 13,955 | 12,742 |
| 2005 | 5.4 | 4.8 | 14,711 | 13,350 |
| 2006 | 16.1 | 15.6 | 17,086 | 15,436 |
| 2007 | 10.2 | 5.4 | 18,820 | 16,267 |
| 2008 | -35.9 | -37.0 | 12,071 | 10,245 |
| 2009 | 24.9 | 26.5 | 15,080 | 12,959 |
| 2010 | 20.3 | 14.9 | 18,136 | 14,892 |
| 2011 | -1.7 | 2.0 | 17,827 | 15,186 |
| 2012 | 12.6 | 15.8 | 20,075 | 17,589 |
| 2013 | 26.7 | 32.2 | 25,436 | 23,250 |
| 2014 | 9.9 | 13.5 | 27,962 | 26,388 |
| 2015 | -4.5 | 1.3 | $26,711 | $26,719 |
| 2016 YTD** | -7.7 | -5.0 | $24,656 | $25,389 |
| Since Incep** | 7.4 | 7.7 | $24,656 | $25,389 |
|
*June 30 to December 31, 2003. |
||||
Table 3. Alternative All-ETF Portfolio
| Fund (Ticker) | Weight* | YTD Return (%) | Annual Return (%) | ||
| 1-Yr | 3-Yr | Since 12/31/2012 | |||
| First Trust US IPO ETF (FPX) | 20% | -7.4 | -3.1 | 13.1 | 13.1 |
| Guggenheim S&P 500 Equal Weight (RSP) | 20% | -5.6 | -5.3 | 10.1 | 10.1 |
| Guggenheim S&P MidCap 400 Pure Val (RFV) | 20% | -7.8 | -12.5 | 4.6 | 4.6 |
| Guggenheim S&P SmCap 600 Pure Val (RZV) | 20% | -9.3 | -13.6 | 3.8 | 3.8 |
| iShares MSCI Frontier 100 (FM) | 10% | -7.2 | -18.4 | -1.4 | -1.4 |
| Vanguard REIT Index (VNQ) | 10% | -3.3 | -7.3 | 8.4 | 8.4 |
| Weighted Avg of ETFs in Portfolio† |
|
-7.1 | -9.5 | 7.0 | 7.0 |
| Actual ETF Portfolio†† |
|
-7.0 | -9.2 | 6.7 | 6.7 |
| Comparison: Spider S&P 500 (SPY) | -5.0 | -0.7 | 11.2 | 11.2 | |
|
* Weights were adjusted at the close of 9/30/2014. †A weighted average return of the ETFs in the current All-ETF Portfolio. ††Performance of actual All-ETF Portfolio, including reinvested dividends. Source: Morningstar, Inc. Data as of 1/31/2016. |
|||||
Model Fund Portfolio: Selection Rationale
The fund selection rationale consists of two distinct approaches. The first approach is to select actively managed funds where the managers have shown a long-term ability to outperform the market after allowing for additional portfolio risk, regardless of the sector invested in. A fund must have the following characteristics to be considered for the Model Fund Portfolio:
The above rules apply to new fund selections. Funds will not automatically be eliminated if they later violate the rules without considering other factors.
The second methodology selects investment approaches that have provided excess returns or reduced portfolio risk to investors over the long term and then searches for the best traditional fund or exchange-traded fund (ETF) in that area. Factors to be considered are:
(FAGIX), which invests in distressed securities.
Portfolio Strategies

Portfolio Strategies

Peter from MD posted over 10 years ago:
Doug E. from NY posted over 10 years ago:
You need to log in as a registered AAII user before commenting.
Log InCreate an account