


Wayne Thorp leads a class in AAII's new Essential Investing Video Course. Go to https://www.aaii.com/ves for more information and to subscribe.


Ralph Wanger, the founder of Wanger Asset Management and the former manager of the Acorn Fund (now the Columbia Acorn Fund), is a consistent promoter of small-stock investing.
His investing style of holding small companies with financial strength, entrepreneurial managers, and understandable businesses allowed him to generate annualized returns of 16.3% with the Acorn Fund between 1970 and 2003, while the S&P 500 index gained 12.1% a year over that period.
Wanger outlined his approach in his 1997 book “A Zebra in Lion Country: Ralph Wanger’s Investment Survival Guide.” This article focuses on AAII’s “revised” Wanger stock screen, which is an adaptation of the principles outlined in Wanger’s book.
Wanger believes that smaller-cap companies offer under-exploited opportunities because they tend to be beyond the focus of full-time investors. However, he also recognizes that investing in smaller-cap companies tends to be riskier than large-cap investing. Therefore, he performs a careful examination to find established companies whose management has proven their abilities over time and that have a sound balance sheet and a strong position in their industry.
On a monthly basis, AAII.com lists the companies passing the Wanger screen and tracks the performance of these stocks in a hypothetical portfolio.
Figure 1 illustrates that the Wanger screen has produced performance that easily exceeds that of large-cap companies over our study period, which started in January of 1998. In addition, the Wanger screen has outperformed indexes of small- and mid-cap stocks over the period, albeit by smaller margins.
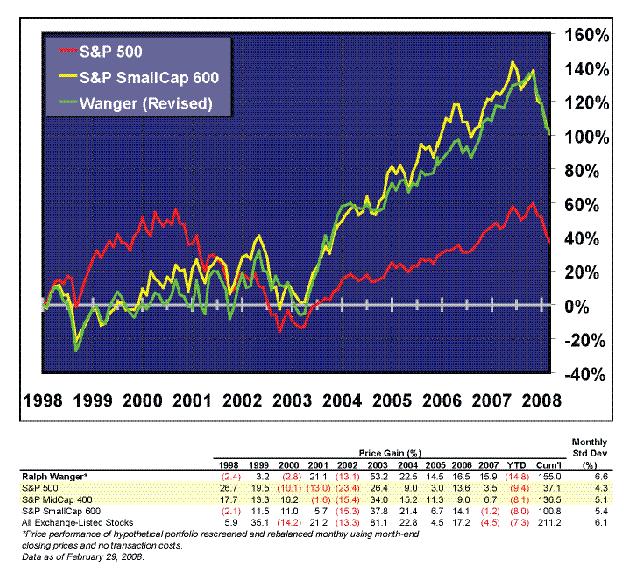
As of the end of February 2008, the Wanger screen has generated a monthly cumulative return 155%, for an average annual return of 9.6%, while the S&P 500 has gained a cumulative total of 37.1%.
Table 1 highlights the characteristics of the companies currently passing the Wanger screen, compared to the typical exchange-listed company.
The median current price-earnings ratio (current share price divided by earnings per share for the last 12 months) is only slightly lower than that of the typical exchange-listed firm. In contrast, the median price-to-book ratio for the Wanger stocks is roughly one-third higher than that of exchange-listed stocks.
In terms of historical earnings growth, the stocks currently passing the Wanger screen have easily outpaced the market. If you believe that top-line growth powers bottom-line growth, the Wanger screen’s requirement of positive and increasing sales over the last three years that also exceeded industry benchmarks may be a contributing factor.
Table 1. Ralph Wanger Portfolio Characteristics
| Portfolio Characteristics (Median) |
Ralph Wanger Approach |
Exchange- Listed Stocks |
| Price-earnings ratio (X) | 15.5 | 16.0 |
| Price-to-book-value ratio (X) | 2.2 | 1.6 |
| Price-earnings-to-EPS growth (X) | 0.5 | 0.8 |
| EPS 5-yr. historical growth rate (%) | 32.1 | 14.6 |
| EPS 3-5 yr. estimated growth rate (%) | 17.6 | 14.3 |
| Market cap ($ million) | 540.7 | 358.0 |
| Relative strength vs. S&P (S&P=0) (%) | 17.0 | –9.0 |
| Monthly Observations | ||
| Average no. of passing stocks | 31 | |
| Highest no. of passing stocks | 56 | |
| Lowest no. of passing stocks | 9 | |
| Monthly turnover (%) | 27.1 | |
On a forward-looking basis, analysts do not believe the Wanger stocks will maintain their impressive earnings growth. However, they do believe their prospects are somewhat better than the universe of exchange-listed stocks.
The companies passing the Wanger screen are larger than typical exchange-listed stocks, although not much more so. A median market capitalization of $540 million puts this portfolio of passing companies on the low end of the small-cap spectrum.
On a performance basis, the stocks currently passing the Wanger screen stand out when compared to the universe of exchange-listed stocks. Over the last 52 weeks, the Wanger stocks’ median price performance has exceeded that of the S&P 500 by 17%.
As of March 7, 2008, 36 companies passed the AAII Wanger screen. This is slightly above the historical average of 31. The monthly turnover of the Wanger screen is among the lowest of the screens AAII tracks at 27.1%.
Table 2 is a listing of the companies currently passing the Wanger screen. These companies represent a diverse collection of sectors and industries—from aerospace and footwear to food processing and software.
The AAII Wanger screen isolates companies with a market capitalization between $100 million and $2 billion. Only 10 of the current passing companies have a market cap over $1 billion, with Phillips-Van Heusen (PVH) leading the way at over $1.8 billion.
Table 2. Companies Passing the Ralph Wanger Screen
| Company (Exchange: Ticker) | Price ($/Shr) | Mkt Cap ($ Mil) | Oper Marg 12 Mo (%) | Oper Marg 3 Yr Avg (%) | Sales Grth 3 Yr (%) | Total Liab to Assets Q1 (%) | Curr Rat Q1 (X) | PE to EPS Grth (%) | PE (X) | PE Avg 7 yr (X) | Rel Strgth Idx* (%) | Description |
| Deckers Outdoor (M: DECK) | 99.53 | 1,294.50 | 23.5 | 20 | 27.9 | 19.3 | 4.2 | 0.2 | 19.6 | 20.9 | 22 | sport & luxury footwear |
| EZCORP, Inc. (M: EZPW) | 10.94 | 452.3 | 15.3 | 12.4 | 17.8 | 14.7 | 4.4 | 0.2 | 11.6 | na | 2 | pawn shop loans |
| Life Partners Hldgs (N: LPHI) | 13.35 | 159.7 | 67.8 | 36.3 | 14.2 | 38.6 | 2.3 | 0.2 | 9.7 | na | -61 | life settlement insur |
| MPS Group, Inc. (N: MPS) | 10.89 | 1,039.10 | 6.1 | 5.8 | 15 | 19.3 | 2.3 | 0.2 | 12.7 | na | -5 | business services |
| Men’s Wearhouse (N: MW) | 21.3 | 1,115.10 | 13.1 | 9.7 | 10.6 | 34.2 | 2.6 | 0.2 | 6.3 | 18.6 | -51 | men’s suits retailer |
| Phillips-Van Heusen (M: PVH) | 33 | 1,864.10 | 12.8 | 10.5 | 10 | 50.4 | 3.1 | 0.2 | 10.6 | na | -31 | branded apparel |
| Global Sources (M: GSOL) | 11.5 | 535.6 | 13.4 | 12.7 | 19.5 | 42.3 | 2.2 | 0.2 | 16.7 | na | -22 | B2B media co. |
| Bolt Technology (M: BOLT) | 17.15 | 147.8 | 32 | 22.4 | 50.5 | 12.3 | 5.8 | 0.3 | 11.1 | na | -24 | geophysical equip & prods |
| Forrester Research (M: FORR) | 26.56 | 613.2 | 10.7 | 10.5 | 15.5 | 35.5 | 2.4 | 0.3 | 32.8 | 168.6 | 28 | tech & market research |
| Res-Care, Inc. (N: RSCR) | 19.72 | 575.1 | 6.2 | 5.7 | 10.6 | 49.6 | 1.7 | 0.3 | 14.7 | na | 3 | services for disabled & poor |
| ALLETE, Inc. (M: ALE) | 35.02 | 1,079.70 | 15.9 | 13.4 | 6.1 | 54.8 | 1.6 | 0.4 | 11.3 | 45.4 | -7 | energy servs & real estate |
| CAM Commerce Sols (M: CADA) | 36.18 | 148.8 | 24.9 | 16.7 | 10.9 | 16.8 | 6.2 | 0.4 | 28.3 | na | 4 | commerce solutions for retail |
| Cherokee Inc. (M: CHKE) | 33.53 | 298.9 | 74 | 71.4 | 28.3 | 27.6 | 2.7 | 0.4 | 8.5 | 13.4 | 2 | branded apparel & footwear |
| Heidrick & Struggles Int’l (M: HSII) | 31.59 | 545.8 | 12.3 | 9.1 | 17.6 | 49.8 | 1.6 | 0.4 | 10.6 | na | -5 | exec search & consult servs |
| ICO, Inc. (M: ICOC) | 7.65 | 209.2 | 7.2 | 5.5 | 17.5 | 60.3 | 1.6 | 0.4 | 10.2 | na | -30 | specialty resins & polymers |
| Moldflow Corp. (N: MFLO) | 17.54 | 211.7 | 15.1 | 13.5 | 4.7 | 21.5 | 4.9 | 0.4 | 20.9 | na | 23 | software for mfg solutions |
| National Presto Indus (M: NPK) | 49.92 | 341.3 | 11.8 | 11.5 | 34.3 | 18.7 | 4.3 | 0.4 | 12.2 | 20.8 | 4 | housewares & defense prods |
| Rofin-Sinar Tech (N: RSTI) | 40.27 | 1,190.60 | 18.2 | 17 | 14.1 | 31.5 | 2.8 | 0.4 | 21.1 | 17.1 | 30 | lasers for welding & cutting |
| AMCOL Int’l Corp. (N: ACO) | 28.6 | 860 | 10.1 | 9.4 | 17.2 | 45.8 | 3 | 0.5 | 15.5 | 16.9 | -1 | minerals & oilfield servs |
| Dycom Industries (M: DY) | 12.18 | 495.8 | 5.6 | 5.2 | 9.2 | 42.3 | 2.4 | 0.5 | 12.8 | na | -53 | specialty contracting servs |
| Integral Systems (N: ISYS) | 27.13 | 255.3 | 16.2 | 13 | 12.5 | 19.3 | 2.7 | 0.5 | 15.6 | 37.1 | 31 | satellite ground sys & equip |
| Robbins & Myers (A: RBN) | 33.7 | 581 | 13.8 | 6.1 | 5.9 | 48 | 1.6 | 0.5 | 10.7 | na | 50 | equip & sys for energy |
| SL Industries (M: SLI) | 19.76 | 115.4 | 7.5 | 7.1 | 18.9 | 44 | 2 | 0.5 | 12.2 | na | -1 | power electronics & commun |
| TASER Int’l (N: TASR) | 10.78 | 682.6 | 20.3 | 4.4 | 14.2 | 12.4 | 7.7 | 0.5 | 46.9 | na | -17 | control devices for security |
| Tennant Co. (N: TNC) | 35.61 | 657.8 | 8.3 | 7.1 | 9.4 | 33.9 | 2.5 | 0.5 | 17.1 | 32.1 | 0 | floor & surface maintain |
| Esterline Tech Corp. (M: ESL) | 51.99 | 1,528.80 | 19 | 9.1 | 27.3 | 45.3 | 2.4 | 0.6 | 12.8 | 15.9 | 19 | specialized mfg for aerospace |
| Gulf Island Fabric’n (M: GIFI) | 28.46 | 404.6 | 9.8 | 9.6 | 39.6 | 29.6 | 1.7 | 0.6 | 13.1 | 18.5 | -7 | offshore drilling platforms |
| NVE Corp. (M: NVEC) | 23.44 | 108.7 | 45.8 | 23.9 | 11.2 | 3.9 | 7.4 | 0.6 | 17.2 | na | -20 | spintronic devices |
| Analogic Corp. (M: ALOG) | 61.02 | 817.3 | 6.2 | -0.1 | 3.9 | 13.2 | 6.8 | 0.7 | 28.8 | 84.1 | -1 | health & security sys |
| Electro Scientific (N: ESIO) | 15.63 | 435.9 | 10.4 | 8.8 | 6.6 | 15 | 5.4 | 0.7 | 17.6 | na | -23 | mfg systems for electronics |
| OM Group, Inc. (N: OMG) | 59.66 | 1,793.80 | 19.2 | 11.6 | 14 | 30 | 2.5 | 0.7 | 16.3 | na | 37 | specialty chemicals |
| AZZ Inc. (M: AZZ) | 34.82 | 421.8 | 13.5 | 8.2 | 24.1 | 33.1 | 2.5 | 0.8 | 15.5 | 16.1 | 49 | electrical equip |
| Key Technology (M: KTEC) | 31.1 | 172.7 | 7.9 | 4.4 | 10.1 | 31 | 2.9 | 0.8 | 24.5 | na | 19 | process automation systems |
| Mitcham Industries (N: MIND) | 16.56 | 162 | 18 | 14.7 | 29.7 | 19.7 | 2.5 | 0.8 | 19.3 | na | 5 | seismic equip leasing |
| Darling Int’l (M: DAR) | 12.93 | 1,052.20 | 12.5 | 7.5 | 26.3 | 42.8 | 1.4 | 0.9 | 23.1 | na | 83 | food rendering & recycling |
| Foundry Networks (M: FDRY) | 11.24 | 1,686.30 | 13.7 | 11.7 | 14.1 | 14.3 | 8.2 | 0.9 | 21.6 | 143.6 | -30 | network switching & routing |
|
*S&P index = 0 Exchange Key: A = American Stock Exchange, M = NASDAQ, N = New York Stock Exchange Source: AAII’s Stock Investor Pro/Reuters Research, Inc. Data as of March 7, 2008.
See the AAII Stock Screens area of AAII.com for more information.
|
||||||||||||
This screen also compares a company’s operating margin (operating income divided by sales) to its historical norms as well as industry benchmarks. When analyzing ratios such as this, you cannot compare companies across industries—certain industries have historically low margins. Among the companies in Table 2, Cherokee Inc. (CHKE) has the highest current operating margin of 74%. The company licenses its trademarks, including Cherokee, Sideout, and Molly Malloy, for men’s, women’s, and children’s apparel. In contrast, Dycom Industries (DY), a provider of specialty contracting services, has the lowest current operating margin at 5.6%.
The AAII Wanger screen also requires companies to have positive sales growth over the last three years as well as have a 12-month sales growth rate that matches or exceeds its three-year growth rate. Of the companies currently passing this screen, Bolt Technology (BOLT), has achieved an average annual sales growth rate of 50.5% over the last three years. The company develops and manufactures geophysical equipment used in offshore seismic oil and gas exploration.
Quantitative screens such as the Wanger approach represent a starting point in the investing process. They allow you to isolate companies with similar quantifiable characteristics. However, it is important to perform additional due diligence on any company that passes a stock screen such as this. The end goal is to find stocks that match your investing tolerances and constraints.
| What It Takes: Ralph Wagner’s Small-Cap Criteria |
|
Discussion
FREE REPORT

Richard from Iowa posted over 10 years ago:
Wayne Thorp from IL posted over 10 years ago:
You need to log in as a registered AAII user before commenting.
Log InCreate an account