


Related

Portfolio Strategies
Even with last year’s volatility, no rebalancing was required. Low inflation caused the withdrawal amounts to increase only slightly.

Charles Rotblut leads a class in AAII's new Essential Investing Video Course. Go to https://www.aaii.com/ves for more information and to subscribe.
The volatility experienced in the stock market was not severe enough to prompt year-end rebalancing in 2015.
More notable, however, was what happened with portfolio withdrawals: Retirees who adjust their withdrawals based on the rate of inflation would have only seen a very minimal increase in what they could withdraw by adhering to William Bengen’s 4% rule or similar types of strategies.
These conclusions are based on the latest update to my ongoing analysis on rebalancing. The analysis follows hypothetical portfolios based on AAII’s moderate asset allocation model (www.aaii.com/asset-allocation). This model calls for allocating 20% to large-cap stocks, 20% to mid-cap stocks, 10% to small-cap stocks, 15% to international stocks, 5% to emerging market stocks and 30% to bonds; see the box here for an illustration of the three models. The portfolios are rebalanced annually when one (or more) of the allocations is off target by five percentage points or more.
Rather than rely on index returns, hypothetical portfolios with $100,000 starting values were created using Vanguard index funds to show the results an investor could have realized in a tax-favored account (e.g., a traditional IRA or a Roth IRA), excluding any transaction costs. The use of Vanguard funds restricted the starting date for the analysis to 1988, when full-year return data for some of the funds used was first available. This period includes three recessions, two bear markets (one that was extraordinarily severe) and two lengthy bull markets.
Three scenarios were modeled. The no-rebalancing scenario solely allowed the returns of the five funds representing each asset class (international and emerging stocks are represented by a single fund) to determine the portfolios’ allocations. No action was taken to readjust the allocations. The rebalanced scenario adjusted the allocations whenever one of the fund’s allocations drifted off target by more than five percentage points. The panic scenario assumes an investor shifted the entire portfolio’s allocation into bonds for 12 months whenever the S&P 500 index fell by more than 20% in a calendar year. This update will focus on the non-rebalancing and the rebalanced scenarios, though Table 1 shows the results for all three scenarios.
Under each scenario, two hypothetical portfolios were created. No withdrawals were taken out of the first one (the “non-withdrawal” portfolio). The second, the “withdrawal” portfolio, assumed a retiree cashed out 4% of his or her portfolio balance at the end of 1988 and then increased the withdrawal amount each year in accordance with the rate of inflation. The 4% inflation-adjusted withdrawal rate is the maximum amount that can be taken from a portfolio over a 30-year period with a high probability of not running out of money. It is based on research by William Bengen, with several other studies supporting his general approach.
A more thorough explanation of the rebalancing process and why it might be an option for investors who find themselves unnerved by turbulent market conditions can be found in the May 2014 AAII Journal (“The Danger of Getting Out of Stocks During Bear Markets”).
Models were also created assuming start dates of January 2000 and January 2007, near the end of the last two bull markets. The longer-dated of these two models shows that a hypothetical retiree who started taking withdrawals in 2000 and never rebalanced would now face losing all of his exposure to small-cap stocks.
Spreadsheets for all three models—with start dates of 1988, 2000 and 2007, respectively—with full details for all of the updated data are included with the online version of this article on AAII.com.
Table 1. Performance of the Three Strategies
|
|
Rebalance at 5% Thresholds |
No Rebalancing |
Panic and Sell When S&P 500 Falls > 20% |
|
|
|||
| Portfolio Strategy | |||
|
Non-Withdrawal Portfolio Results (1988–2015) |
|||
| Ending Portfolio Value | $1,151,368 | $1,203,796 | $749,953 |
| Total Return | 1051.4% | 1103.8% | 650.0% |
| Standard Deviation | 12.3% | 14.0% | 12.2% |
| Annualized Return | 9.1% | 9.3% | 7.5% |
| Largest Drawdown | ($204,880) | ($253,424) | ($183,385) |
| Largest Annual Loss | (26.9%) | (32.8%) | (30.0%) |
| Ending Equity Allocation | 69.9% | 86.0% | 77.6% |
| Ending Fixed-Income Allocation | 30.1% | 14.0% | 22.4% |
|
Withdrawal Portfolio Results (1988–2015) |
|||
| Ending Portfolio Value | $569,259 | $625,372 | $356,502 |
| Total Return | 469.3% | 525.4% | 256.5% |
| Standard Deviation | 12.0% | 13.6% | 12.0% |
| Annualized Return | 6.4% | 6.8% | 4.6% |
| Largest Drawdown | ($124,995) | ($155,228) | ($116,982) |
| Largest Annual Loss | (28.1%) | (34.0%) | (31.4%) |
| Total Withdrawals | $194,719 | $194,719 | $194,719 |
| Ending Equity Allocation | 69.4% | 87.1% | 76.7% |
| Ending Fixed-Income Allocation | 30.6% | 12.9% | 23.3% |
The returns realized under the rebalanced scenario relative to the no-rebalancing scenario portfolio varied based on whether or not withdrawals were taken. The difference was due to how the allocations in the non-withdrawal and the withdrawal portfolios have evolved under each scenario.
The non-withdrawal portfolio fared better last year under the rebalanced scenario. The portfolio lost 1.1% when rebalancing was employed versus a decline of 1.3% with no rebalancing. The difference was due to the respective exposure to mid- and small-cap stocks under each scenario. Under the rebalanced scenario, the non-withdrawal portfolio started 2015 with a 31.3% allocation to mid- and small-cap stock funds. In contrast, under the no-rebalancing scenario, the portfolio had a 53.7% allocation to these funds. Domestically, shares of smaller-sized companies tended to fare worse than their large-cap peers last year.
When withdrawals were made, returns were better under the no-rebalancing scenario. The withdrawal portfolio lost 2.5% when not rebalanced, but lost 2.8% when rebalanced on a post-withdrawal basis. Under the no-rebalancing scenario, the portfolio started 2015 with a 23.5% allocation to domestic large-cap stocks and a mere 3.0% allocation to international stocks. Under the rebalancing scenario, the withdrawal portfolio’s allocations were adjusted back to their target at the end of 2014. This adjustment led to the portfolio starting 2015 with a 20% allocation to domestic large-cap stocks and a 20% allocation to international stocks. The adjustment caused the withdrawal portfolio under the rebalancing scenario to have a smaller allocation to the best-performing fund [Vanguard 500 Index fund  (VFINX)] and a larger allocation to the worst-performing fund [Vanguard International Value fund (VTRIX)]. Put another way, the no-rebalancing scenario’s higher return was realized by allowing the portfolio to abandon the investor’s allocation decision.
Since the model’s start date of 1988, the long-term annualized return for the non-withdrawal portfolio is 9.3% when not rebalanced and 9.1% when rebalanced. The long-term annualized return for the withdrawal portfolio is 6.8% when not rebalanced and 6.4% when rebalanced. Though the long-term returns are slightly lower, both portfolios have experienced approximately 12% less volatility (as measured by standard deviation) when rebalanced in response to one or more of the asset class allocations straying more the five percentage points off target. The difference shows the trade-off facing investors: Choose a higher absolute return or give up some upside to reduce volatility.
The purpose of rebalancing is to readjust a portfolio back to targeted goals. Since security prices fluctuate even under calm conditions and some transaction costs can be incurred, rebalancing works best with preset guidelines specifying when to do it. Vanguard advises annual or semiannual rebalancing when the allocations of major asset classes are off target by five or 10 percentage points. This balances the advantages of rebalancing with the costs of doing so. It also allows room for those assets with upward price moment, while setting up barriers to prevent the portfolio from being excessively tilted to one asset class relative to the intended allocation targets. (In its 2012 study, Vanguard suggested annual rebalancing may lessen the tax costs.)
This use of preset guidelines can prompt an investor to do nothing even when stocks, or another asset class, incur increased downside (or upside) volatility. In the specific case of the models discussed here, last year’s stock market volatility was not severe enough to warrant any adjustment at the end of 2015. Rather, the models suggest simply holding tight and not making any changes.
The timing of the data should be taken into consideration. The models use end-of-year data, meaning the hypothetical investor following these models would have checked his portfolio at the end of 2015. Had the portfolio been checked at the end of September 2015 or, say, early in February 2016, the decision of whether to rebalance may have been different.
This raises the question of how often a portfolio should be checked. Checking a portfolio only on preset dates offers simplicity and routine and can lead to greater discipline over the long term. Part of the allure of rebalancing is that it allows the portfolio to be monitored less frequently. With preset dates for checking the portfolio (e.g., once every 12 months) and an actionable plan to follow should allocations stray too far off target, there is no need to react to prevailing market trends. Furthermore, limiting the amount of interaction gives the portion of the portfolio experiencing upward momentum room to run.
Strategically checking to see if the portfolio needs to be rebalanced based on market movement may potentially lead to higher returns. This would be the case if stock allocations are adjusted near the top of a bull market and/or near the bottom of a correction or a bear market. An alternate method would be to use benchmarks (e.g., checking the portfolio when an asset class increases or decreases by a preset percentage amount, such as a 10% move in the S&P 500) or some form of technical analysis (e.g., the 200-day moving average). The dangers would be potentially more transactions (and higher overall transaction costs) as well as the possibility of worse returns. Returns would be hurt if strategic rebalancing prevented the portfolio from taking advantage of some short-term momentum or proved to be more ill-timed than simply relying on a regular calendar date (e.g., December 31).
Strategic rebalancing also adds an additional layer of complexity to the process. A simple strategy followed correctly will produce higher long-term returns than a more complex strategy that is not correctly followed and/or not adhered to over the long term.
Retirees who follow an inflation-adjusted strategy (e.g., the 4% rule) to determine how much they can withdraw from their savings received only a modest raise last year. The small increase had nothing to do with the decision to rebalance or not, but rather with a lack of inflation as measured by the government. The consumer price index’s (CPI) year-over-year increase as of November 2015 was just 0.44% (based on data from the St. Louis Federal Reserve’s FRED database). Retirees relying on the statistic would have been prompted to increase their withdrawal amount by just 0.44%.
Here’s why. William Bengen’s 4% rule (and variants of it) assume a retiree will withdraw an amount equal to 4% of their portfolio’s value during the first year of retirement. The withdrawal amount is then adjusted upward each year afterward in accordance with the rate of inflation. Higher inflation means a bigger increase; low inflation means a smaller increase. When inflation is near flat levels, nearly no adjustment is made.
This presents a potential double blow to many retirees. Not only did their withdrawal amounts barely budge this year, but their Social Security benefit checks also remained largely unchanged.
Inflation is relative to the individual. While one person may not perceive much upward aggregate pricing pressure in the goods and services they buy, others may feel it because they spend their money on a different basket of goods and services. Thus, the magnitude of price increases reported by widely followed indicators, such as the CPI, may differ from what an individual actually experiences (or senses that they are experiencing).
Retirees have the flexibility of adjusting their withdrawal rates based on the performance of their portfolios and changes to their perceived life expectancies. The models discussed in this article do not incorporate such a level of flexibility. Care must be used when deviating from the 4% rule, since increasing the withdrawal rate too much can lead to a smaller-than-desired portfolio balance in the future.
An alternative to the 4% rule is to use the Internal Revenue Service’s required minimum distribution (RMD) tables for tax-deferred accounts. The RMD amount is based on both a life expectancy factor and a person’s portfolio balance. In a low-inflation environment, it may become easier for the RMD amount to surpass the withdrawal amount suggested by the 4% rule because the suggested inflation adjustments are smaller. Keep in mind that the RMD only applies to tax-deferred retirement accounts; Roth IRAs are exempt from the RMDs. Retirees holding both a traditional IRA (or similar type of account) and a Roth IRA should consider their cumulative retirement savings when deciding how much they can safely withdraw.
The rationale for discussing RMDs versus the 4% withdrawal rule is due to the length of the model. The primary model used to test rebalancing has a 1988 start date. A hypothetical investor who was 65 in 1988 would be 93 now. Based on the IRS’ tables, his RMD would exceed the calculated withdrawal amount for both the rebalanced and the non-rebalanced portfolios if all retirement savings are held in an individual retirement account (IRA) or an account with similar tax rules. Thus, this is a variable that is not being considered by the models. Detailed return data is in the online spreadsheets for those who want to do their own customizations.
There is also the question of whether or not there should be a cap on the number of years the model runs for. In two years, this model will cover 30 years of data. One possibility, obviously, is to let the model just keep running. Another is to limit it to 25 or 30 years, replacing an older year with a newer year.
My current preference is to do the former (not set a cap on the maximum number of years). The spreadsheets on AAII.com contain not only the return data, but detailed instructions on how the worksheets were created. This allows any AAII member to adjust the time periods as they see fit. By letting it run, I’m giving the model ongoing continuity. The spreadsheets also already offer models covering shorter time periods (with start dates of 2000 and 2007).
An allocation problem has surfaced in the model starting in 2000. Under the no-rebalancing scenario, the withdrawal portfolio is on the verge of seeing its small-cap allocation completely depleted. The portfolio ended 2015 with an allocation of just $174 to small-cap stocks after accounting for withdrawals. (The starting allocation on January 1, 2000, was $10,000.) Next year’s withdrawal will completely engulf this nominal balance. (The model assigns withdrawal amounts equally among the five mutual funds.) After next year, the withdrawal portfolio will be managed without any small-cap allocation under the no-rebalancing scenario.
A proportionately smaller starting allocation (small-cap stocks received an initial 10% weighting) and allocation drift are to blame. By not periodically rebalancing, the balance in the small-cap fund was not replenished during market downturns. Add in the outflows related to annual withdrawals, and the portfolio’s balance in small caps is on the verge of depletion.
The withdrawal portfolio under the rebalancing scenario does not have this problem. Its small-cap allocation is nearly $12,000 as of the end of 2015. In addition to reducing volatility, rebalancing preserves diversification. Preserving the initially intended allocation can help avoid unintended consequences in the future.
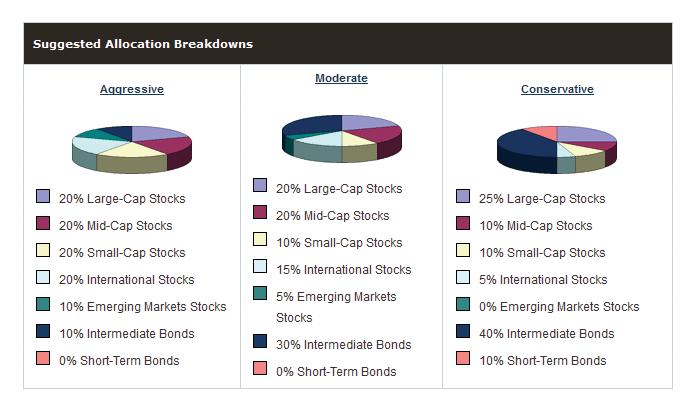
AAII’s Asset Allocation Models webpage follows three hypothetical portfolios: aggressive, moderate and conservative. The models are designed to help you match your risk level with appropriate asset classes. Shown here are the suggested allocation breakdowns for each model. Charles Rotblut’s rebalancing series uses the moderate allocation model for his hypothetical portfolios. The Asset Allocation Models webpage also calculates performance figures for each model over various periods of time; performance is updated monthly and based on popular investment benchmarks.
The Asset Allocation Models can be followed at www.aaii.com/asset-allocation.
Complete Data for All Portfolios and Variations
Download the Excel spreadsheets by clicking on each link:
Portfolio Strategies
Portfolio Strategies

Portfolio Strategies

Robert Stevens from wa posted over 10 years ago:
Ray Jenkins from CO posted over 10 years ago:
Margaret L. Hagen from NY posted over 10 years ago:
Charles Rotblut from IL posted over 10 years ago:
You need to log in as a registered AAII user before commenting.
Log InCreate an account