


Related

Portfolio Strategies
By allowing some fluctuation in the allocations, the models tracked have, on average, required rebalancing just once every three years.

Charles Rotblut leads a class in AAII's new Essential Investing Video Course. Go to https://www.aaii.com/ves for more information and to subscribe.
There was a reward for investors who stuck with their long-term portfolio strategies last year: positive returns.
Despite the stock market’s dip, the drop and then rise in bond yields, and all of the surprising headlines, asset prices rose for 2016. Domestic stocks, international stocks and long-term government bonds all posted gains.
The difference in returns among the various asset classes was not enough to prompt rebalancing in the models I’ve been tracking. Rather, investors using a strategy of 70% stocks/30% bonds would have been able to leave their portfolios unchanged for a third consecutive year. This lack of need for any action is one of the benefits of rebalancing. I’ll elaborate more about the frequency of portfolio adjustments momentarily.
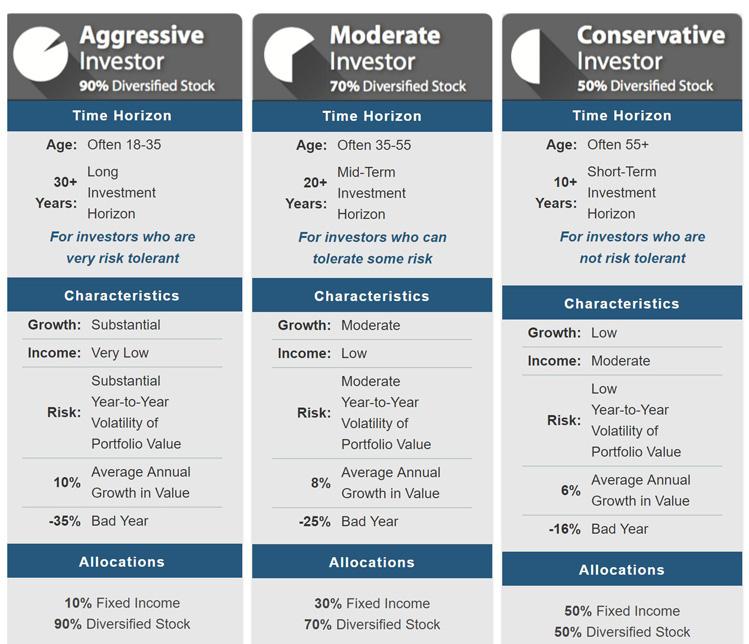
First some background, and the latest results. Since 2011, I’ve been conducting an ongoing analysis of hypothetical portfolios based on AAII’s moderate asset allocation model (www.aaii.com/asset-allocation). This model calls for allocating 70% to a diversified collection of stocks and 30% to bonds. For the stock portion, the target allocation I’ve used is 20% in large-cap stocks, 20% in mid-cap stocks, 10% in small-cap stocks and 20% in international developed country and emerging market stocks. See Figure 1 for an illustration of the investor characteristics of the three models.
The hypothetical portfolios use Vanguard funds to replicate the returns an investor could have realized. A start date of 1988 was used because it was the first full year that return data was available for some of the funds used in the models. The models are updated annually using end-of-year return data. More details about the construction of the models can be found at the end of this article. Online spreadsheets with the full data and a thorough explanation of the calculations are linked in the online version of this article.
All four of the equity funds used in the model (large-cap, mid-cap, small-cap and international) outperformed the bond fund last year, as 2016 ended up being a good year for stocks. This fact favored portfolios with larger allocations to stocks over portfolios with smaller allocations to stocks. As such, it is not surprising to see the non-rebalanced portfolios outperform the rebalanced portfolios.
The non-rebalanced non-withdrawal portfolio realized 10.6% total return in 2016 versus an 8.2% total return for the rebalanced non-withdrawal portfolio. The difference is attributable to the 87.1% equity allocation the non-rebalanced portfolio has. This is 15.6 percentage points higher than the equity allocation of the rebalanced portfolio. By not rebalancing, the allocation to stocks has been allowed to rise over time. (The outperformance of stocks relative to bonds causes the portfolio dollars allocated to stocks to increase at a faster rate than those allocated to bonds.) This upward drift is beneficial during periods when stocks do well, but harmful when stocks underperform.
It’s important to consider the reason for rebalancing when reviewing these figures. Rebalancing is a strategy for preserving a portfolio’s allocation. As such, it will result in lower returns over the long term by preventing the allocation of the best-performing asset class (stocks) from drifting too much off target over time. The lower returns can be acceptable if relatively smaller fluctuations in portfolio values are desired. The rebalanced, non-withdrawal portfolio is 12% less volatile than the non-rebalanced, non-withdrawal portfolio.
The net effect is a long-term 9.3% annualized return for the non-rebalanced, non-withdrawal portfolio and a 9.1% annualized return for the rebalanced, non-withdrawal portfolio (Table 1). A little in annualized returns is given up in exchange for the smaller fluctuations in the portfolio’s value. For investors, this presents the choice of seeking higher return but enduring larger swings in wealth, or seeking lower returns but experiencing smaller swings in wealth. The trade-off between returns and volatility will always be dependent on both the assets and the portfolio allocation chosen.
Table 1. Performance of the Three Strategies
| Portfolio Strategy Rebalance at 5% Thresholds | No Rebalancing | Panic and Sell When S&P 500 Falls > 20% | |
|
Non-Withdrawal Portfolio Results (1988 - 2016) |
|||
| Ending Portfolio Value | $1,246,221 | $1,332,360 | $819,834 |
| Total Return | 1146.2% | 1232.4% | 719.8% |
| Standard Deviation | 12.1% | 13.7% | 12.0% |
| Annualized Return | 9.1% | 9.3% | 7.5% |
| Largest Drawdown | ($204,880) | ($253,424) | ($183,385) |
| Largest Annual Loss | (26.9%) | (32.8%) | (30.0%) |
| Ending Equity Allocation | 71.5% | 87.1% | 79.0% |
| Ending Fixed-Income Allocation | 28.5% | 12.9% | 21.0% |
|
Withdrawal Portfolio Results (1988 - 2016) |
|||
| Ending Portfolio Value | $605,792 | $685,080 | $379,967 |
| Total Return | 505.8% | 585.1% | 280.0% |
| Standard Deviation | 11.8% | 13.4% | 11.8% |
| Annualized Return | 6.4% | 6.9% | 4.7% |
| Largest Drawdown | ($124,995) | ($155,228) | ($116,982) |
| Largest Annual Loss | (28.1%) | (34.0%) | (31.4%) |
| Total Withdrawals | $203,937 | $203,937 | $203,937 |
| Ending Equity Allocation | 70.8% | 88.2% | 78.1% |
| Ending Fixed-Income Allocation | 29.2% | 11.8% | 21.9% |
The lower return from not rebalancing should not only be considered in the context of not rebalancing; it should also be measured against the results from panicking. Regardless of whether a start date of January 1988, January 2000 or January 2007 is chosen, the models clearly show that panicking is one of the most harmful actions an investor can take. The loss of relative wealth from getting out during a bear market and not immediately getting back in when stock prices rebound is long-lasting. Staying out of the market for just one calendar year following a 20% or greater drop in the S&P 500 index has resulted in a rate of return nearly 20% lower than what would have been realized by rebalancing. (The S&P 500 fell by more than 20% in 2002 and 2008.) Put another way, the forfeiture of wealth for someone who panicked is both significant and lasting.
During the 29-year period the primary models cover, rebalancing has been required approximately once every three years. For the non-withdrawal portfolio, there have been three three-year periods when rebalancing was not required (1993–1995, 1999–2001 and 2014–2016) and one four-year period when rebalancing was not required (1988–1991). It’s a similar trend for the withdrawal portfolio, with slight differences in the years rebalancing occurred. No rebalancing was required during three three-year periods: 1993–1995, 1999–2001 and 2011–2013.
For both portfolios, rebalancing was only required on back-to-back years once. Both portfolios were rebalanced at the end of 2002 and 2003. The need to adjust during and following the last bear market was different. The portfolios were rebalanced at the end of 2008, a few months before the end of the financial crisis, and at the end of 2010.
Whether or not rebalancing is required during any given year—or during on any other chosen time interval—is influenced by the bands used. A band establishes the boundaries within which an asset class (e.g., large-cap stocks, bonds, etc.) or individual securities are allowed to move away from the targeted allocation. A strict approach to rebalancing requires more frequent adjustment. Some strategies, such as the Guggenheim S&P 500 Equal Weight ETF  (RSP), rebalance quarterly. Other strategies rebalance much less frequently.
A strict and frequent rebalancing strategy ensures the portfolio’s allocations remain close to target. This is advantageous if the goal is to constantly maintain a specific weighting of assets within the portfolio. Such is the approach followed by the aforementioned Guggenheim exchange-traded fund. Quarterly rebalancing makes sense for the Guggenheim strategy, since its goal is to ensure that no single security has an excessive weighting. Outside of an ETF, frequent rebalancing can lead to higher transaction costs and, if done in a traditional brokerage or mutual fund account, short-term capital gains. It also requires additional time and effort on the part of the investor.
Arguably, the biggest downside to frequent rebalancing is momentum. Rebalancing requires taking profits from assets that are doing well and investing in them in assets that are underperforming. As such, dollars are shifted away from the best-performing asset. The more often a portfolio is rebalanced, the less opportunity an investor will have to fully benefit from the exposure to the currently “hot” asset class. Rebalancing less frequently allows an investor to capture some of the upward momentum. (It’s impossible to capture all of the upward momentum on a consistent basis.)
A band-based approach strikes a good compromise. It allows assets with upward momentum to continue rising without profits being taken off the table too soon. At the same time, it prevents any single asset class from having too much weight within the portfolio. It’s a compromise between taking advantage of short-term momentum and not allowing the portfolio’s allocation to stray too far off target. A key to remember is that the purpose of rebalancing is to systematically maintain the portfolio allocation over the long term, not to orient the portfolio to what’s currently doing well. Leaving some wiggle room instead of sticking to an overly strict approach helps maintain the long-term strategy while allowing for some benefit from being exposed to shorter-term upward momentum.
How wide or narrow the bands should be is a subject open for debate. Vanguard found annual or semiannual rebalancing works well with 5% to 10% bands in a 2011 study (“Best Practices for Portfolio Rebalancing,” May 2011 AAII Journal.) Adviser and author William “Bill” Bernstein suggests using different bands for each asset class. A band could be tighter for large U.S. and European stocks and wider for emerging market stocks, and “a lot wider” for precious metal stocks (“Investing to Avoid the Consequences of Being Wrong,” September 2016 AAII Journal). Bernstein acknowledged the complexity of such a strategy, cautioning investors to stay “quantitatively grounded” and knowing how to write “complicated spreadsheets.”
At the same time, there is the issue of frequency. Vanguard suggests checking on an annual or semiannual basis to see if rebalancing is required. Bernstein suggests waiting two or three years to rebalance since asset classes can exhibit momentum for more than a year, but usually not longer than that. Note that the models used here have been rebalanced, on average, approximately once every three years.
Those rebalancing in a taxable account should be sure not to rebalance any more frequently than once every 12 months to ensure that short-term gains are not inadvertently triggered. Those wanting to identify the shares sold for rebalancing using a strategy other than first in, first out (FIFO) or, in the case of mutual funds and direct reinvestment plans, average cost basis should notify their broker or fund company in writing in advance of making the transaction. (See the “The Individual Investor’s Guide to Personal Tax Planning 2016” in the December 2016 AAII Journal for more information.)
Rebalancing every year in a taxable account will result in more frequent but potentially smaller realized capital gains. Rebalancing less frequently will result in less frequent but potentially larger realized capital gains. The latter approach will result in a higher total return on a pretax basis. Investors needing to access funds from the portfolio to cover the tax bill could allocate proceeds from dividends and distributions to free up cash, though using portfolio dollars to pay taxes will leave less to grow and compound.
Similarly, those who use rebalancing in a tax-sheltered account, such as a traditional IRA, can allocate dividends and distributions to fund required minimum distributions (RMDs) and other retirement withdrawals. The models discussed in this article use year-end total return data and do not break out income distributed by the funds. The focus of these models is rebalancing, not identifying the ideal way to take withdrawals from a portfolio.
Those wanting to incorporate rebalancing into funding withdrawals have two primary options. The first is used in the models: take the withdrawals first and then determine whether or not rebalancing is needed. The second option is to check to see if rebalancing is needed first. If it is needed, the withdrawals are taken from the proceeds of the trimmed asset classes. This latter option requires choices to be made on the part of the investor about how to go about taking the proceeds. An investor could proportionately trim from each of the overweight asset classes in the order of which asset class is most overweighted, or reduce all of the overweight asset classes back to their target, to create a pool of cash to withdraw from. The flip side, however, is that these approaches add a layer of complexity to the process over simply taking the withdrawals proportionately before decisions are made about whether or not rebalancing is needed. For many investors, a more simplistic approach is easier to follow. A compromise may be to allocate all dividends and distributions to cash first and then make the decisions about freeing up any additional cash needed for withdrawals afterward.
Rather than rely on index returns, hypothetical portfolios with $100,000 starting values were created using Vanguard index funds to show the results an investor could have realized in a tax-favored account (e.g., a traditional IRA or a Roth IRA), excluding any transaction costs. The use of Vanguard funds restricted the starting date for the analysis to 1988, when full-year return data for some of the funds used was first available. This period includes three recessions, two bear markets (one that was extraordinarily severe) and two lengthy bull markets.
Three scenarios were modeled. The no-rebalancing scenario solely allowed the returns of the five funds representing each asset class (international and emerging stocks are represented by a single fund) to determine the portfolios’ allocations. No action was taken to readjust the allocations. The rebalanced scenario adjusted the allocations whenever one of the fund’s allocations drifted off target by more than five percentage points. The panic scenario assumes that an investor shifted the entire portfolio’s allocation into bonds for 12 months whenever the S&P 500 index fell by more than 20% in a calendar year. This update focuses on the non-rebalanced and the rebalanced scenarios, though Table 1 shows the results for all three scenarios.
Under each scenario, two hypothetical portfolios were created. No withdrawals were taken out of the first one (the “non-withdrawal” portfolio). The second, the “withdrawal” portfolio, assumed a retiree cashed out 4% of his or her portfolio balance at the end of 1988 and then increased the withdrawal amount each year in accordance with the rate of inflation. The 4% inflation-adjusted withdrawal rate is the maximum amount that can be taken from a portfolio over a 30-year period with a high probability of not running out of money. It is based on research by William Bengen, with several other studies supporting his general approach.
A more thorough explanation of the rebalancing process and why it might be an option for investors who find themselves unnerved by turbulent market conditions can be found in the May 2014 AAII Journal (“The Danger of Getting Out of Stocks During Bear Markets”).
Models were also created assuming start dates of January 2000 and January 2007, near the end of the last two bull markets. The longer-dated of these two models shows that a hypothetical retiree who started taking withdrawals in 2000 and never rebalanced would now face losing all of his or her exposure to small-cap stocks.
See below for spreadsheets for all three models—with start dates of 1988, 2000 and 2007—that give full details for all of the updated data.
Complete Data for All Portfolios and Variations
Download the Excel spreadsheets by clicking on each link:
Portfolio Strategies
Portfolio Strategies
Portfolio Strategies

Thomas Donohue from VA posted over 9 years ago:
Charles Rotblut from IL posted over 9 years ago:
Merrell Denison from OR posted over 9 years ago:
Charles Rotblut from IL posted over 9 years ago:
Harry Rich from OH posted over 9 years ago:
Charles Rotblut from Illinois posted over 9 years ago:
You need to log in as a registered AAII user before commenting.
Log InCreate an account