

Related

Portfolio Strategies
While a conservative allocation lasts 35 years at a 3% withdrawal rate, higher withdrawal rates require greater exposure to stocks.
by Craig Israelsen | May 2016
This article evaluates portfolio survival during the retirement years when money is being periodically withdrawn from an investment portfolio.
The time frame of this study is the 90-year period from January 1, 1926, to December 31, 2015. Four asset classes are represented in the study: U.S. large-cap stocks, U.S. small-cap stocks, U.S. bonds and U.S. cash.
The performance of U.S. large-cap stocks was represented by the S&P 500 index, U.S. small-cap stocks by the Ibbotson Small Stock Index from 1926–1978 and the Russell 2000 Index from 1979–2015, U.S. bonds by the Ibbotson U.S. Intermediate Government Bond Index from 1926–1975 and the Barclay’s Capital Aggregate Bond Index from 1976–2015, and U.S. cash was represented by 90-day U.S. Treasury bills.
The measure of success in this study is whether or not a retirement portfolio can survive intact for at least 35 years, which simulates a retiree from age 65 to age 100. Two retirement portfolio models were utilized in this analysis: a 25% stock/75% fixed income portfolio and a 65% stock/35% fixed income portfolio. The 25/75 portfolio is a conservative retirement model that consisted of 15% large-cap stocks, 10% small-cap stocks, 55% bonds and 20% cash. The 65/35 portfolio is more aggressive and consisted of 40% large-cap stocks, 25% small-cap stocks, 25% bonds and 10% cash. Both portfolios were rebalanced annually. Over this 90-year period, there were 56 rolling 35-year periods to analyze.
One of the critical variables that determines the success or failure of a retirement portfolio is the initial withdrawal rate. In this study, four withdrawal rates were evaluated: 3%, 4%, 5% and 6%. For example, if a retirement portfolio has a starting balance of $1 million and a 3% initial withdrawal rate is applied, the first year’s withdrawal will be $30,000. The annual withdrawal was assumed to take place at the end of the year (thus providing the needed funds for the next year).
The various withdrawal rates in this study (3% through 6%) simulate the varying financial circumstances of different retirees. Some retirees will have adequate retirement cash flow from their investment portfolio if using a 3% withdrawal rate, whereas others may need to withdraw up to 6% or possibly even more.
A second variable that is also very influential in the success or failure of a retirement portfolio is the cost-of-living adjustment (COLA). For purposes of this analysis, the COLA was set at 3%. The logic for this assumption comes from the fact that the average annual rate of inflation (the consumer price index) has been 2.91% over the 90-year period from 1926–2015. Thus, using the example above, the withdrawal in the second year would be $30,000 × 1.03, or $30,900. The withdrawal in the third year would be $31,827, and so on. [A summary of each annual withdrawal based on the four different initial withdrawal rates is provided here.] A starting balance of $1 million was assumed.
This analysis tested each retirement portfolio to determine how often it survived each of the 56 rolling 35-year periods under the four different withdrawal rate assumptions. The results are presented in Table 1 and Figures 1, 2 and 3.
As shown in Table 1, both the 25/75 retirement portfolio and the 65/35 retirement portfolio survived at least 35 years in all 56 rolling-year periods from 1926 through 2015 under the assumption of a 3% initial withdrawal rate and a 3% cost-of-living adjustment.
Table 1. Portfolio Survival Rates at Varying Withdrawal Rates
| The table below shows the frequency at which a portfolio lasted 35 years using 35-year rolling periods from 1926 through 2015. | ||
| Initial Withdraw Rate From Portfolio (3% COLA Assumed) | 25/75 Retirement Portfolio* Success Rate | 65/35 Retirement Portfolio** Success Rate |
| 3% | 100% | 100% |
| 4% | 93% | 98% |
| 5% | 59% | 91% |
| 6% | 34% | 88% |
|
*15% U.S. large-cap stocks, 10% U.S. small-cap stocks, 55% U.S. bonds and 20% cash. **40% U.S. large-cap stocks, 25% U.S. small-cap stocks, 25% U.S. bonds and 10% cash. |
||
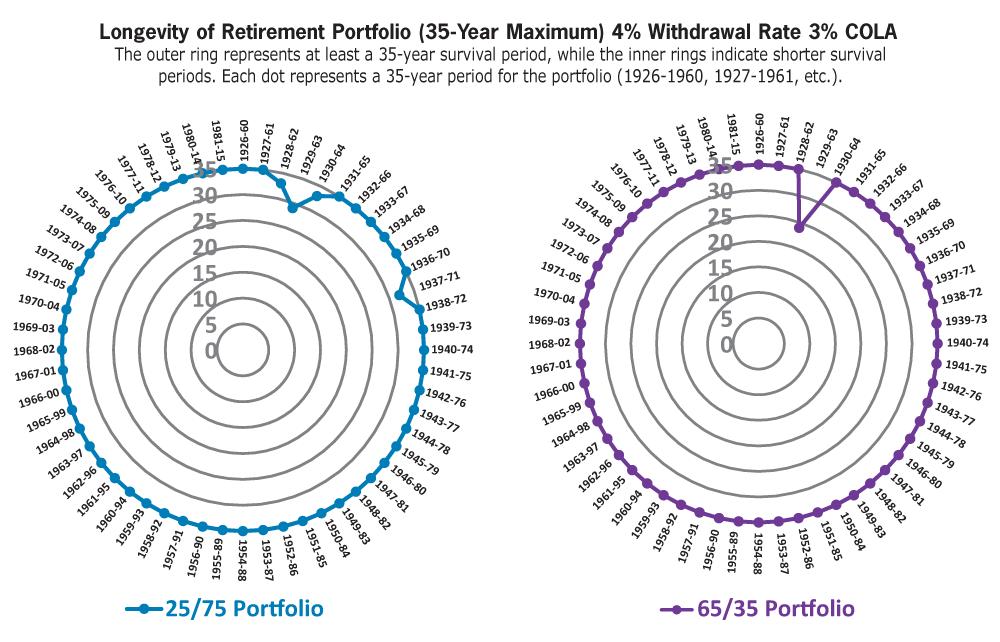
Assuming a 4% initial withdrawal rate and a 3% cost-of-living adjustment, the 25/75 portfolio survived at least 35 years in 93% of the rolling periods while the 65/35 portfolio had a 98% success rate. Figure 1 presents the results in “tree ring” graphs: Each dot in the graphs represents a 35-year period using historical returns, with the first period being 1926–1960. The second period was 1927–1961, and so on. The outer edge of the graph represents a 35-year survival period—the goal of the retiree. The inner rings represent successively shorter survival periods in five-year increments (30 years, 25 years, 20 years, and so on).
It should be noted that in many cases, the two portfolios lasted longer than 35 years. This analysis truncated the longevity of the portfolio at 35 years to simplify the graphing of the results. Of more interest was determining when, and how often, the retirement portfolio failed to last 35 years. This analysis considered a 35-year survival period a “success” and did not graph the full length of the portfolio’s survival.
The 65/35 portfolio survived in all 35-year periods but one: 1929–1963. During that specific period the 65/35 model lasted 24 years before running out of money. The U.S. stock market crash associated with the Great Depression began in 1929. The annual returns of the 65/35 portfolio between 1929 and 1932 were, respectively, –14.2%, –17.6%, –30.3%, and –2.3%. When a retirement portfolio suffers several large negative returns “out of the gate” (in the starting years of the retirement period), it is very difficult for the portfolio to recover, inasmuch as the retiree’s annual withdrawals exacerbate the market-induced losses. This is known as sequence-of-returns risk. Portfolios that include equity (and equity-like) asset classes tend to be more susceptible to sequence-of-returns risk. Conversely, portfolios that have larger allocations to fixed-income asset classes face less sequence-of-returns risk, but often cannot generate a sufficiently large enough return to last for 35 years. The 25/75 portfolio lasted 29 years during that same time period beginning in 1929.
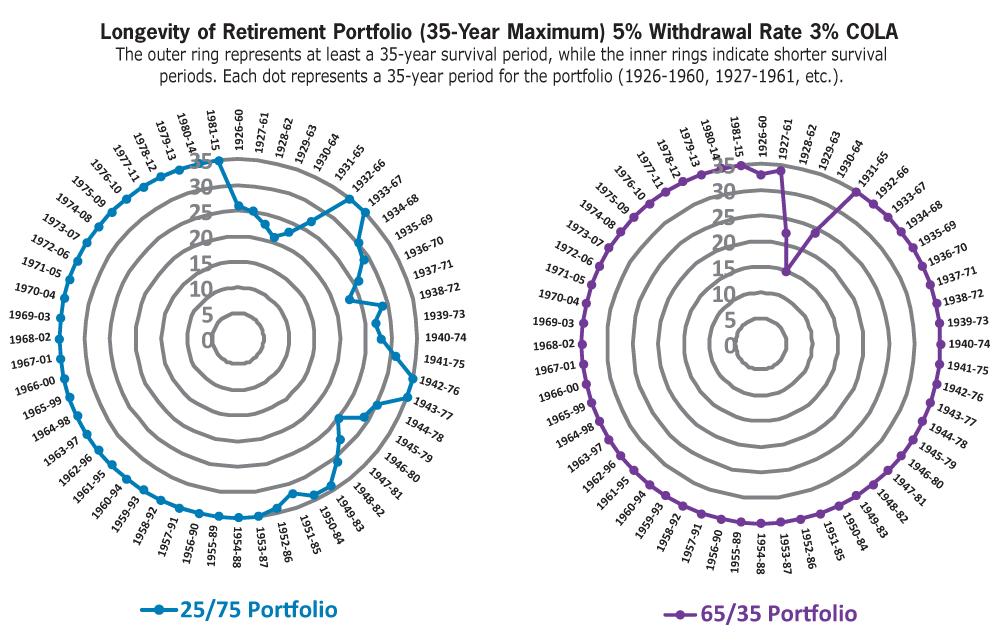
At a withdrawal rate of 5%, the 25/75 portfolio survived at least 35 years in 59% of the rolling 35-year periods. Figure 2 illustrates the results graphically. It is instructive to note that the 25/75 portfolio was able to last at least 35 years only in more recent time periods (starting with the 35-year period that began in 1953). This is due to bond returns that began perking up in the mid-1960s, followed by dramatically higher bond returns beginning in the early 1980s as the Federal Reserve’s discount rate began its descent. The 65/35 portfolio survived in 51 of the 35-year periods, a success rate of 91%. The benefits of a diversified retirement portfolio that has a larger allocation to equities is clearly evident at higher withdrawal rates when compared against the more conservative 25% stock/75% fixed income portfolio.
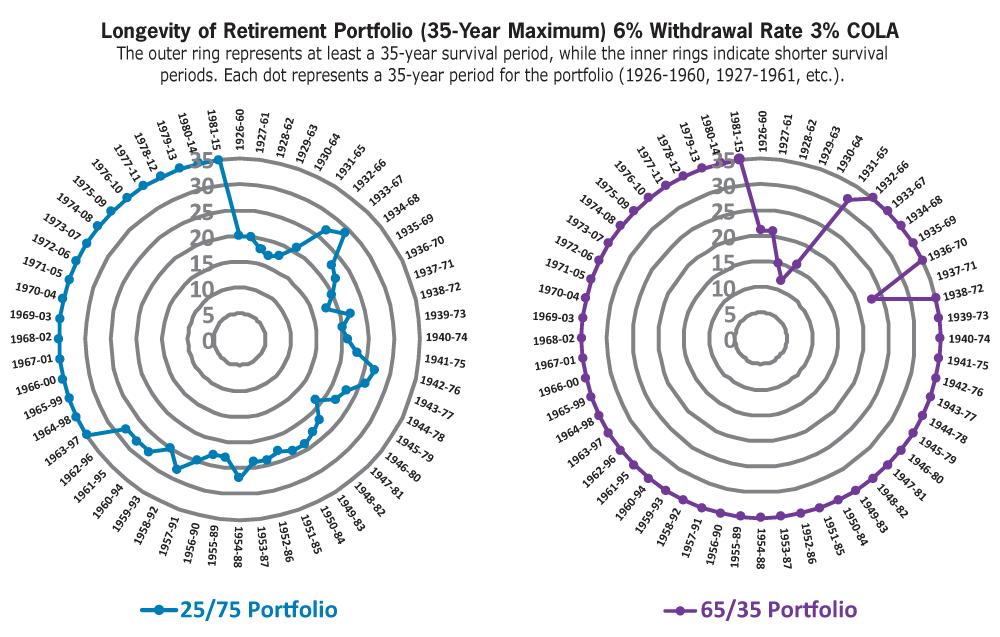
Finally, I subjected the two retirement portfolios to a 6% initial withdrawal rate and a 3% cost-of-living adjustment over all 56 rolling 35-year periods. The 25/75 portfolio survived in only 34% of the periods. As can be seen in Figure 3, starting with the 1963–1997 period, the 25/75 portfolio survived for at least 35 years in every case. Again, that is a function of the buoyant bond returns that began in the early 1980s. Remember that the 25/75 portfolio has a 55% allocation to U.S. bonds.
Consider the following: The average annualized return for U.S. bonds during the 34-year period from 1948–1981 was 3.8%, versus 8.2% over the 34-year period from 1982–2015 (using the returns of the Ibbotson U.S. Intermediate Government Bonds Index from 1948–1975 and the Barclay’s Capital Aggregate Bond Index from 1976–2015). That dramatic difference allowed the 25/75 portfolio to sustain a high withdrawal rate of 6%, but only in more recent 35-year periods. It is unlikely that bond returns over the next several decades will be able to support a 6% withdrawal rate in a 25/75 portfolio.
The 65/35 portfolio handled a 6% initial withdrawal rate surprisingly well, surviving in 88% of the rolling 35-year periods. However, its worst period (1929–1963) resulted in complete depletion within 12 years. This was worse than the 25/75 portfolio during that same time frame (the 25/75 portfolio lasted 17 years). This is a classic example of a worst-case sequence of returns at the start of retirement.
We think you’d like this related webinar! Craig Israelsen’s Retirement Portfolio Analysis: A Multi-Decade Review
This analysis of retirement portfolios over rolling 35-year periods clearly demonstrates the superiority of a moderate risk 65% stock/35% fixed income portfolio during retirement in comparison to a conservative 25% stock/75% fixed income portfolio. As interest rates increase in the future, the performance tailwind that U.S. bonds have experienced over the past 3½ decades will certainly turn to a headwind, with a potential downside of bonds retreating to the levels experienced between 1948 and 1981.
This does not suggest that bonds be abandoned as a component of a retirement portfolio. Rather, it suggests that bonds should be surrounded by a variety of additional asset classes that may thrive during times when bonds may be languishing.
To that point, a wide variety of asset classes are now available for use in a diversified retirement portfolio that were not available during the 90-year period of this study, such as Treasury Inflation-Protected Securities (TIPS), international bonds, natural resources, real estate investment trusts (REITs), emerging stocks, U.S. mid-cap stocks, and many others.
Diversification is a tenet of investing that extends across the life-span—from young investors in their early 20s to retirees in their late 80s.
Portfolio Strategies

Portfolio Strategies


William Hungiville III from FL posted over 10 years ago:
Bryant Vann from VA posted over 10 years ago:
Jim Snide from OH posted over 10 years ago:
Daniel O'Brien from IL posted over 10 years ago:
John Rogers from CO posted over 10 years ago:
John Blevens from CA posted over 10 years ago:
Herbert Schechter from MN posted over 10 years ago:
Richard Cloutier from Georgia posted over 10 years ago:
Robert Greving from TN posted over 10 years ago:
Victor Stankevich from NC posted over 10 years ago:
David Levine from NC posted over 10 years ago:
G. Michael Frey from OH posted over 10 years ago:
Gary Jaffe from CA posted over 10 years ago:
George Carter from WA posted over 10 years ago:
Dave Gilmer from WA posted over 10 years ago:
Dave Gilmer from WA posted over 10 years ago:
Rick Haas from Michigan posted over 10 years ago:
Bob Atwell from AZ posted over 10 years ago:
You need to log in as a registered AAII user before commenting.
Log InCreate an account