


Related

Small Cap Value Investing
The weakness in micro-cap stocks continues.
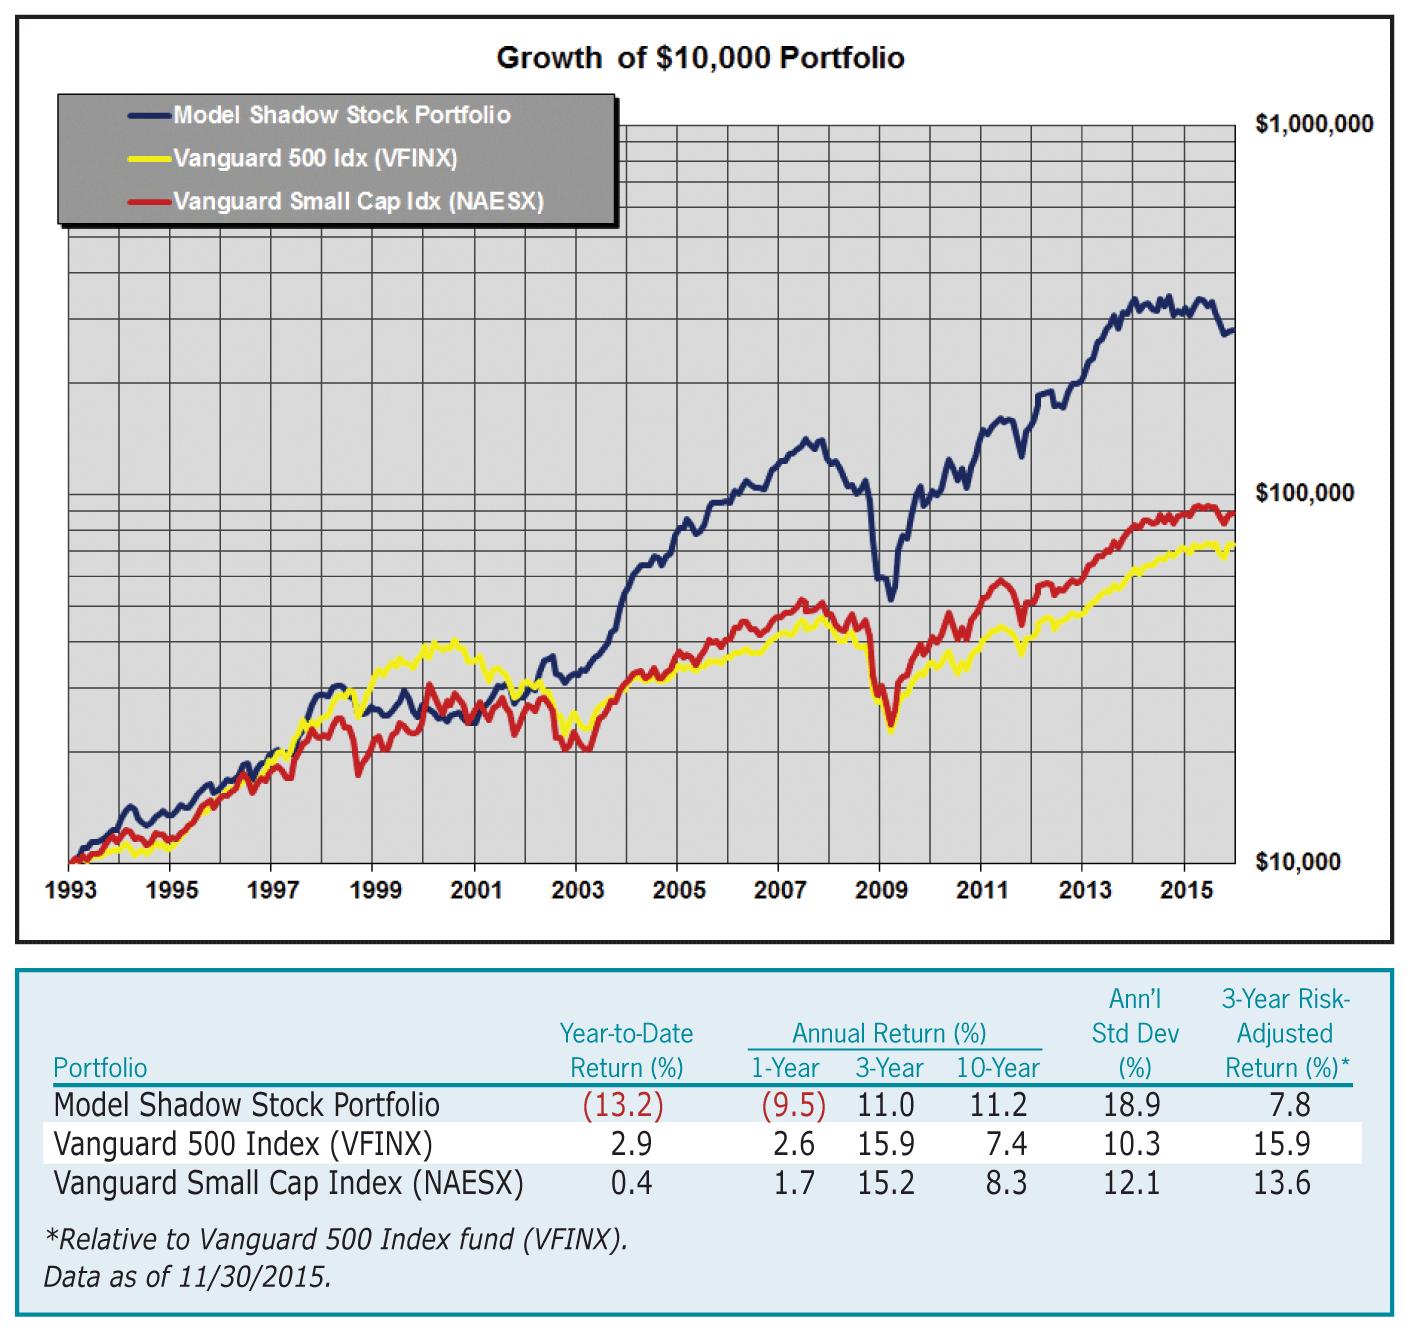
As of November 30, 2015, the Model Shadow Stock Portfolio was down 13.2% year to date, compared to a 2.9% gain for the S&P 500 index as measured by the Vanguard 500 Index fund  (VFINX). Even if there is a Santa Claus rally, it seems likely 2015 will be one of the worst years for the portfolio. The results for longer periods can be seen in Figure 1 and Table 3.
As I look back at the weak performance, it seems very earnings-related—overall, earnings have been below expectations. I have the feeling that this is true of much of the equity market, but it seems to have impacted the smallest stocks the most. Perhaps smaller stocks react primarily on company performance, while the larger-cap stocks are impacted by geopolitical happenings, Federal Reserve activity, economic predictions and other external events.
There are no rule changes, but I do want to make an adjustment in the section on stock order guidance.
Previously, when I have discussed the need for liquidity, I suggested that the average daily dollar volume of a stock should be at least four times the size of the position you wish to create. I now feel that this should be increased to 10 times the desired position size.
For example, if you wish to establish a position of $10,000 in a stock, then you should restrict choices to stocks with $100,000 average daily volume. This will make getting in and getting out of the stock much more efficient.
Along those lines, I require an average daily volume of $300,000 for the stocks I select for the Model Shadow Stock Portfolio. This is why the number of stocks passing my screen is less than the number of stocks that qualify under the basic rules.
Perhaps you saw the article on AAII’s Model Shadow Stock Portfolio in the November 7, 2015, Wall Street Journal by Jason Zweig. He mentioned there might be biases that impact how well investors using Shadow Stock holdings might do relative to the portfolio’s actual performance.
|
|
Current Price ($) |
52-Week |
Market Cap ($ Mil) |
P/E Ratio (X) |
P/B Ratio (X) |
Div Yield (%) |
Notes |
|||
|
|
High ($) |
Low ($) |
||||||||
| Company (Ticker) | ||||||||||
| Alamo Group, Inc. (ALG) | 57.18 | 64.45 | 43.98 | 653.2 | 15.2 | 1.84 | 0.6 | |||
| CDI Corp. (CDI) | 6.84 | 19.24 | 6.50 | 134.8 | nmf** | 0.56 | 7.6 | |||
| CSS Industries Inc. (CSS) | 29.01 | 33.00 | 24.11 | 262.0 | 16.3 | 1.00 | 2.5 | qualified as of 11/30/2015 | ||
| Ducommun Inc. (DCO) | 16.74 | 33.45 | 15.40 | 185.5 | nmf | 0.74 | 0.0 | earnings probation (2015q3) | ||
| Ennis, Inc. (EBF) | 19.99 | 20.74 | 12.51 | 516.0 | nmf** | 1.75 | 3.5 | |||
| Flexsteel Industries (FLXS) | 47.98 | 48.59 | 27.25 | 362.6 | 16.0 | 1.88 | 1.5 | |||
| Global Power Equip (GLPW)† | 4.62 | 14.15 | 3.49 | 79.3 | nmf | nmf | nmf | |||
| Hardinge Inc. (HDNG) | 9.73 | 13.09 | 7.97 | 124.9 | 28.6 | 0.74 | 0.8 | |||
| Hooker Furniture Corp. (HOFT) | 27.40 | 28.20 | 15.18 | 296.2 | 19.9 | 1.99 | 1.5 | |||
|
Key Tronic Corp. (KTCC) |
7.86 | 12.49 | 7.66 | 84.2 | 13.3 | 0.85 | 0.0 | qualified as of 11/30/2015 | ||
| Kimball Electronics (KE) | 11.46 | 17.01 | 9.26 | 336.4 | 13.3 | 1.06 | 0.0 | |||
| L S Starrett Co. (SCX) | 11.06 | 21.95 | 10.06 | 78.5 | 18.7 | 0.75 | 3.6 | |||
| LMI Aerospace, Inc. (LMIA) | 10.18 | 14.79 | 9.20 | 135.0 | nmf** | 1.11 | 0.0 | |||
| Marlin Business Services (MRLN) | 17.48 | 19.29 | 11.17 | 217.5 | 12.6 | 1.43 | 3.2 | |||
| PC Connection, Inc. (PCCC) | 22.32 | 29.50 | 19.20 | 590.2 | 13.1 | 1.52 | 0.0 | |||
| PCM Inc. (PCMI) | 9.20 | 10.70 | 8.50 | 109.4 | nmf** | 0.89 | 0.0 | |||
| RCM Technologies, Inc. (RCMT) | 5.06 | 7.33 | 4.16 | 62.1 | 13.7 | 1.46 | 0.0 | |||
| Renewable Energy Group (REGI) | 9.01 | 12.80 | 7.06 | 395.0 | 25.7 | 0.56 | 0.0 | |||
| REX American Resources (REX) | 62.85 | 70.94 | 43.50 | 434.0 | 7.7 | 1.47 | 0.0 | |||
|
Rocky Brands Inc. (RCKY) |
11.36 | 23.11 | 10.65 | 86.0 | 8.9 | 0.61 | 3.9 | qualified as of 11/30/2015 | ||
| Salem Media Group Inc. (SALM) | 5.66 | 8.00 | 4.38 | 144.1 | 24.6 | 0.70 | 4.6 | qualified as of 11/30/2015 | ||
| Seneca Foods Corp. (SENEA)* | 27.54 | 31.63 | 25.06 | 281.2 | 14.3 | 0.76 | 0.0 | qualified as of 11/30/2015 | ||
| Shoe Carnival, Inc. (SCVL) | 19.48 | 30.00 | 17.36 | 398.9 | 13.4 | 1.10 | 1.3 | |||
| SigmaTron International (SGMA) | 6.33 | 9.12 | 5.02 | 26.4 | 17.1 | 0.45 | 0.0 | |||
|
Townsquare Media Inc. (TSQ)* |
11.43 | 14.35 | 8.60 | 204.1 | 31.8 | 0.56 | 0.0 | qualified as of 11/30/2015 | ||
| TravelCenters of America LLC (TA) | 9.94 | 18.10 | 9.15 | 381.7 | 6.1 | 0.66 | 0.0 | |||
| Ultra Clean Holdings (UCTT) | 5.07 | 10.29 | 4.60 | 163.5 | 18.1 | 0.76 | 0.0 | |||
| Universal Stainless & Alloy (USAP) | 10.80 | 28.41 | 8.60 | 76.7 | nmf | 0.41 | 0.0 | earnings probation (2015q3) | ||
| Vishay Precision Group (VPG) | 12.03 | 17.95 | 10.25 | 158.4 | nmf** | 0.86 | 0.0 | |||
| VOXX International (VOXX) | 5.74 | 9.85 | 4.79 | 138.9 | nmf** | 0.36 | 0.0 | |||
|
Willis Lease Finance (WLFC) |
17.49 | 22.10 | 15.11 | 144.0 | 34.3 | 0.62 | 0.0 | qualified as of 11/30/2015 | ||
|
nmf = no meaningful figure *Added to portfolio 12/1/2015. **Trailing four-quarter GAAP earnings negative, but adjusted earnings positive. †Global Power is in the process of an ongoing review of its historical financial information and will be restating its 2013 and 2014 financial statements. Source: AAII’s Stock Investor Pro/Thomson Reuters. Data as of 11/30/2015. |
||||||||||
Approaching Size Limit: Stocks are sold if their market capitalization goes above three times the initial maximum criterion and there is a stock to replace it. The current market capitalization maximum for initial screening is $300 million. Stocks are marked “approaching size limit” if their current market cap exceeds 2½ times the initial criterion, or $750 million.
Approaching Value Limit: Stocks are sold once their price-to-book-value ratio goes above three times the initial criterion and there is a stock to replace it. The current initial price-to-book ceiling is 1.00. Stocks are marked “approaching value limit” if their current price-to-book-value ratio exceeds 2½ times the initial criterion, or 2.50.
Earnings Probation: If the last 12 months’ earnings from continuing operations are negative, the stock is put on probation; if a subsequent quarter has negative earnings prior to 12-month earnings becoming positive, the stock is sold. The date in parentheses is the fiscal quarter during which the company first reported negative trailing 12-month earnings.
Qualified as of: Stock still qualified as a buy when the screen was run with current data. Stocks that don’t currently qualify as a buy are held until they meet one of the sell rules.
See the Model Shadow Stock Portfolio area of AAII.com for more information.
I have discussed this before, but it seems a good time to revisit the subject. I see three factors that can impact your results if you emulate the portfolio.
Overall, we still feel that the best way to use the model portfolio is as a starting point from which you can develop your own individual approach.
Table 1 lists the current holdings in the Model Shadow Stock Portfolio, and Table 2 shows the fourth-quarter transactions. Olympic Steel (ZEUS) was sold because it violated earnings probation.
Table 2. Fourth-Quarter 2015 Transactions
|
Sell |
|
| Company (Ticker) | Reason |
| Olympic Steel, Inc. (ZEUS) | negative earnings |
|
Buy |
|
| Company (Ticker) | Maximum Price to Pay |
| Seneca Foods Corp. (SENEA) | $36.24 |
|
Townsquare Media Inc. (TSQ) |
$20.41 |
We bought two new stocks with the proceeds: Seneca Foods Corp. (SENEA) and Townsquare Media Inc. (TSQ).
We had 15 qualifying stocks after applying our $300,000-a-day volume requirement. Two of these stocks were already owned: Key Tronic Corp. (KTCC) and Rocky Brands Inc. (RCKY). There were no Chinese stocks this time, which we suggest avoiding due to their data uncertainty.
We basically narrowed it down to the stocks with the lowest price-to-book-value ratios (P/Bs), with a few decisions based on liquidity.
Table 3. Model Shadow Stock Portfolio: Annual Performance
|
|
Average Annual Return (%) | Cumulative Growth of $10,000 ($) | ||||
|
|
Model Shadow Stock Portfolio |
Vanguard 500 Index (VFINX) |
Vanguard Small Cap Index (NAESX) |
Model Shadow Stock Portfolio |
Vanguard 500 Index (VFINX) |
Vanguard Small Cap Index (NAESX) |
|
|
||||||
|
|
||||||
| Year | ||||||
| 1993 | 32.3 | 9.9 | 18.7 | 13,230 | 10,989 | 11,870 |
| 1994 | 2.0 | 1.2 | -0.5 | 13,492 | 11,118 | 11,810 |
| 1995 | 20.7 | 37.4 | 28.7 | 16,291 | 15,282 | 15,204 |
| 1996 | 22.3 | 22.9 | 18.1 | 19,927 | 18,775 | 17,959 |
| 1997 | 44.3 | 33.2 | 24.6 | 28,756 | 25,010 | 22,375 |
| 1998 | -8.9 | 28.6 | -2.6 | 26,188 | 32,168 | 21,790 |
| 1999 | 0.0 | 21.1 | 23.1 | 26,187 | 38,945 | 26,831 |
| 2000 | -7.7 | -9.1 | -2.7 | 24,163 | 35,418 | 26,116 |
| 2001 | 21.4 | -12.0 | 3.1 | 29,325 | 31,160 | 26,926 |
| 2002 | 10.8 | -22.1 | -20.0 | 32,506 | 24,259 | 21,535 |
| 2003 | 73.1 | 28.5 | 45.6 | 56,268 | 31,174 | 31,360 |
| 2004 | 43.7 | 10.8 | 19.9 | 80,843 | 34,530 | 37,587 |
| 2005 | 17.9 | 4.8 | 7.4 | 95,353 | 36,180 | 40,376 |
| 2006 | 29.4 | 15.6 | 15.6 | 123,363 | 41,832 | 46,687 |
| 2007 | -1.8 | 5.4 | 1.2 | 121,166 | 44,083 | 47,227 |
| 2008 | -50.8 | -37.0 | -36.0 | 59,582 | 27,764 | 30,217 |
| 2009 | 72.3 | 26.5 | 36.1 | 102,665 | 35,120 | 41,130 |
| 2010 | 45.4 | 14.9 | 27.7 | 149,238 | 40,358 | 52,529 |
| 2011 | 6.3 | 2.0 | -2.8 | 158,701 | 41,155 | 51,067 |
| 2012 | 33.3 | 15.8 | 18.0 | 211,588 | 47,666 | 60,274 |
| 2013 | 61.0 | 32.2 | 37.6 | 340,599 | 63,009 | 82,966 |
| 2014 | -5.8 | 13.5 | 7.4 | 320,844 | 71,516 | 89,105 |
| YTD | -13.2 | 2.9 | 0.4 | 278,593 | 73,572 | 89,459 |
| Since Incep | 15.6 | 9.0 | 10.0 | 278,593 | 73,572 | 89,459 |
| Data as of 11/30/2015. | ||||||
Willis Lease Finance (WLFC) has offered to buy back shares on a variation of a Dutch auction basis. We are not participating since we have no reason to sell the stock at this time.
Global Power Equipment Group (GLPW) has still not provided corrected updates on their financials for 2013 and 2014. The New York Stock Exchange (NYSE) has given them an extension until March 31, 2016, before considering delisting the stock. The company appears to be working out problems with lenders. We will not take any action at this time.
We have had a number of requests to provide the changes in the portfolio sooner than we do now and are looking into the possibility for next year.
The market situation remains the same, with a number of positive and negative influences. Action by the Fed will likely have occurred by the time you read this. We enter a presidential election year, and the Republican candidate is still a mystery. The world situation is volatile and there is domestic unrest. Through all of this, I think corporate earnings will, as they should, determine the direction of the market for the coming year.
The next Model Shadow Stock Portfolio update will be in April 2016. Happy new year, and keep up with the Model Portfolios at AAII.com.
Stock purchases must meet these criteria:
Stocks are sold if any of the following occur:
Small Cap Value Investing

John Read from London, UK posted over 10 years ago:
Bur Davis from WA posted over 10 years ago:
Hoyt Dale from AR posted over 10 years ago:
You need to log in as a registered AAII user before commenting.
Log InCreate an account