

Wayne Thorp leads a class in AAII's new Essential Investing Video Course. Go to https://www.aaii.com/ves for more information and to subscribe.

Article Highlights:
- This strategy is based on nine trading rules designed to identify stocks with traits similar to past winners.
- Passing stocks have a price-to-book ratio no higher than 1.5, as well as year-over-year, quarterly and annual earnings growth.
- A cap on the number of shares outstanding that a passing company can have orients the strategy toward smaller-capitalization stocks.
For most of us, stock screening is about finding stocks with strong future prospects.
In other words, we are trying to find future winners.
The question then becomes, what does it take for a stock to become a winner? The investing landscape is littered with studies that attempt to answer this question. Many of these studies try to pinpoint winning characteristics that can be used to identify future stock market winners.
One of the most well-known stock studies was undertaken by William O’Neil, who initially analyzed the common traits of the 500 biggest stock market winners dating back to 1953. The results of this study formed the basis of O’Neil’s CAN SLIM screening methodology. Due to its strong performance, AAII started testing it in 1998, along with variations based on O’Neil’s subsequent books. Today, the CAN SLIM screening approaches have become favorites among our members. However, this is not the only stock selection methodology we track that focuses on the winning characteristics of stocks.
In the article “Investment Characteristics of Stock Market Winners,” from the September 1989 issue of the AAII Journal, Marc Reinganum examined the common traits of a group of winning stocks. Based on Reinganum’s research, AAII developed the Stock Market Winners stock screening strategy.
Defining a “Winner”
Reinganum’s research stems from a publication by William O’Neil & Co. titled “The Greatest Stock Market Winners: 1970–1983.” Reinganum examined 222 stocks highlighted in the publication to establish the characteristics that were common to these stocks prior to their rise to prominence.
Based on his analysis, Reinganum came up with nine trading rules to help identify potential future winners. These rules were:
-
Price-to-book-value ratio less than 1.0;
-
Accelerating quarterly earnings;
-
Positive five-year growth rate in earnings;
-
Positive pretax profit margins;
-
Relative price strength of at least 70;
-
Relative strength rank in the current quarter that is greater than the rank in the previous quarter;
-
O’Neil Datagraph rating of at least 70 (this is a weighted combination of earnings, market capitalization, relative strength and other factors, where 1 is the lowest and 99 is the highest rating);
-
Current stock price that is within 15% of its two-year high; and
-
Fewer than 20 million shares outstanding.
AAII’s Stock Market Winners screening strategy attempts to quantify as many of these rules as possible, given the data available in AAII’s fundamental stock screening and research database program Stock Investor Pro. This approach is built into the software, and its criteria are listed in the “What it Takes” box.
What It Takes: Stock Market Winners Criteria
-
The price-to-book-value ratio is less than or equal to 1.5;
-
Quarterly earnings per share from continuing operations has increased relative to the same quarter the year before for each of the last two fiscal quarters;
-
The year-over-year growth rate in earnings per share from continuing operations for the latest fiscal quarter is greater than the year-over-year growth rate in earnings for the prior quarter;
-
The average annual growth rate in earnings per share from continuing operations over the last five years is greater than zero;
-
The weighted relative price strength over the past four quarters is higher than 70% of all U.S.-traded stocks;
-
The pretax margin over the trailing 12 months (last four quarters) is positive;
-
The current share price is within 15% of the highest price at which the stock has traded over the last two years;
-
The average number of shares outstanding for the latest fiscal quarter is no greater than 20 million.
Performance
Figure 1 shows selected performance and risk statistics for AAII’s Stock Market Winners approach and for several market indexes for comparison. Year to date as of March 29, 2018, the strategy has bucked the trend of the broader market and generated a price gain of 5.2%. Since the beginning of 1998, the methodology has had an average annual gain of 20.9%, significantly outperforming the small-, medium- and large-cap indexes over that period.
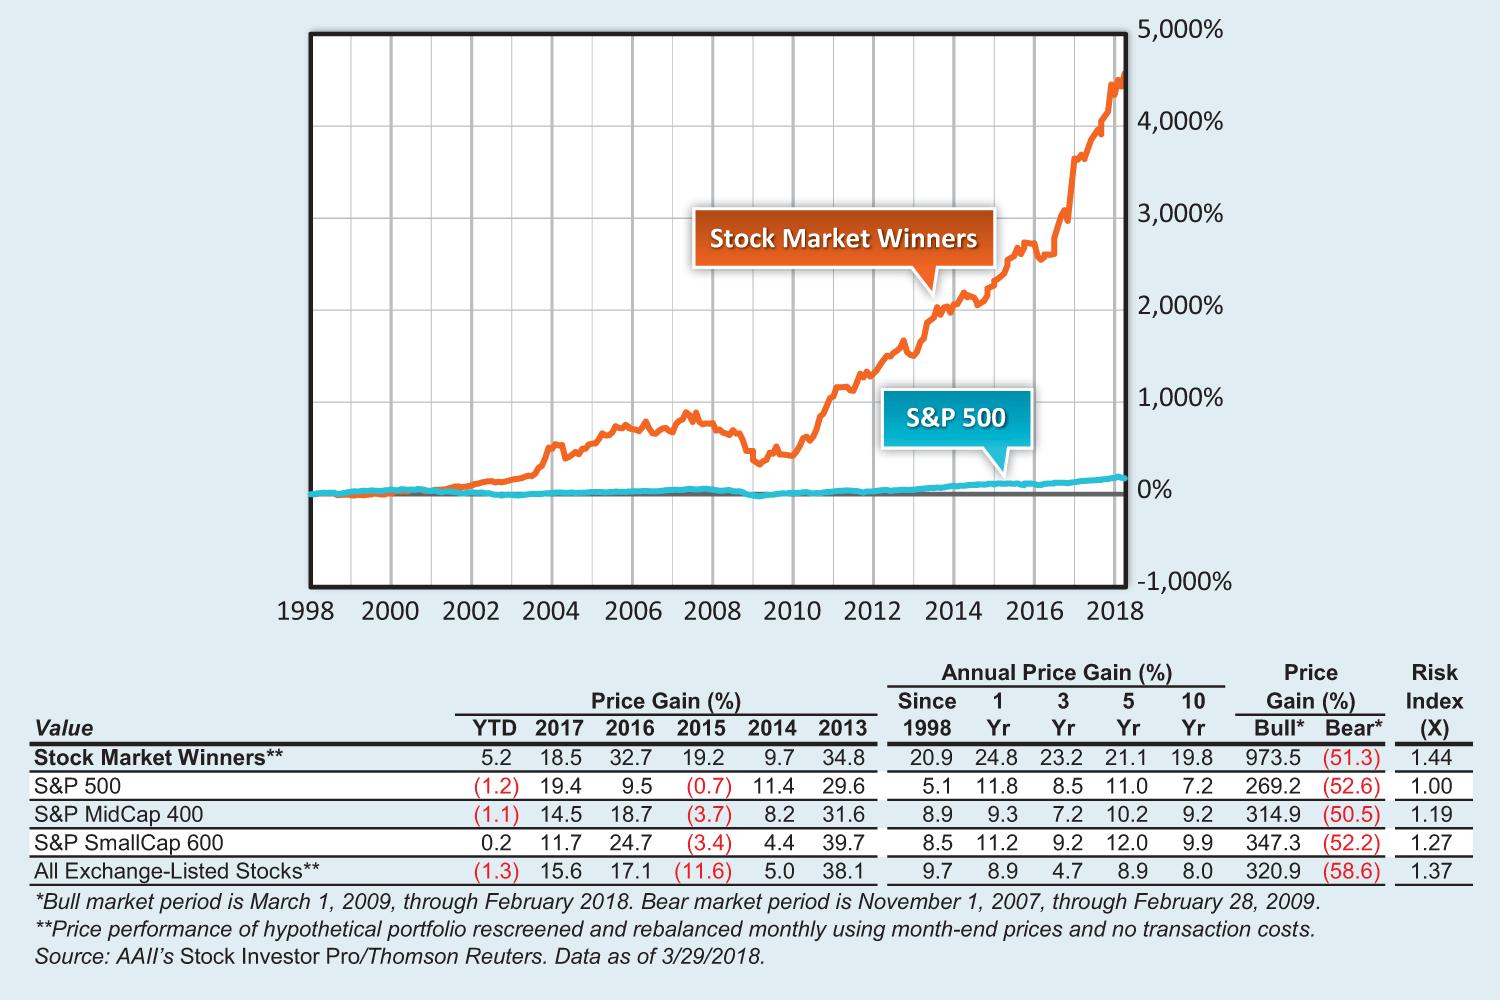
Looking at the overall risk of the strategy, we see that its risk index is 1.44, making it 44% riskier than the S&P 500 index since the beginning of 1998. This lowers its risk-adjusted return to 16.8% a year, which is still better than the S&P indexes and the typical exchange-listed stock.
Over the last bear market, which ran from the end of October 2007 through the end of February 2009, the Stock Market Winners approach lost 51.3%, which was on par with the broader market indexes. However, over the ensuing bull market, which ran through the end of February of this year, the methodology gained an impressive 973.5%, more than tripling the return of the typical exchange-listed stock over the same period.
Profile of Passing Companies
The characteristics of the 10 stocks passing the AAII Stock Market Winners strategy as of March 29, 2018, are presented in Table 1. Historically, 12 companies, on average, have passed the criteria each month since the start of 1998. Over that period, the approach has twice not had any passing companies—at the end of August and November 2009—and had a maximum number of 60 passing at the end of March 2001. Furthermore, the Stock Market Winners approach has one of the highest monthly turnover rates of any screening strategy AAII tracks—on average, 57.8% of the portfolio is replaced each month.
Table 1. Stock Market Winners Portfolio Characteristics
| Portfolio Characteristics (Median) | Stock Market Winners | Exchange-Listed Stocks |
|---|---|---|
| Price-earnings ratio (X) | 14.2 | 21.4 |
| Price-to-book-value ratio (X) | 1.25 | 2.02 |
| Price-to-sales ratio (X) | 2.04 | 2.22 |
| Price-to-cash-flow ratio (X) | 57.0 | 36.5 |
| EPS 5-yr. historical growth rate (X) | 20.7 | 5.8 |
| EPS 3-5 yr. estimated growth rate (X) | — | 12.0 |
| Market cap. ($ million) | 75 | 908 |
| 26-wk relative strength vs. S&P 500 (%) | 14.7 | -5.7 |
| Price as % of 52-wk high | 97.5 | 82.0 |
| Monthly Observations | ||
| Average no. of passing stocks | 12 | |
| Highest no. of passing stocks | 60 | (Mar. 2001) |
| Lowest no. of passing stocks | 0 | (Aug., Nov. 2009) |
| Monthly turnover (%) | 57.8 | |
| Source: AAII’s Stock Investor Pro/Thomson Reuters. Data as of March 29, 2018. | ||
The passing companies are listed in Table 2. The majority of the companies currently meeting the criteria are in the financial sector. Six of the 10 companies are in the regional banks industry (as designated by Thomson Reuters), while another, Independence Holding Co. (IHC), is in the life insurance industry.
Table 2. Companies Passing the AAII Stock Market Winners Strategy
| Company (Ticker) | Price- to- Book Ratio (X) | EPS Growth | Pretax Margin 12m (%) | Avg Shrs Out (Mil) | Rel Strgth Wtd 4 Qtrs (%) |
Price as % 2-yr High (%) |
Share Price (3/29) ($) | Industry | ||
|---|---|---|---|---|---|---|---|---|---|---|
| Q5 to Q1 (%) | Q6 to Q2 (%) | 5 Yr (%) | ||||||||
EACO Corp.  (EACO) (EACO) |
1.41 | 83.2 | 9.8 | 11.1 | 4.5 | 4.86 | 91 | 100.0 | 10.49 | Electron Instru & Con’ls |
|
Equity BancShares (EQBK) |
1.42 | 833.6 | 30.0 | 21.5 | 30.2 | 13.56 | 73 | 96.1 | 39.16 | Regional Banks |
| ES Bancshares Inc. (ESBS) | 1.00 | 476.7 | 44.7 | 57.8 | 22.1 | 3.31 | 73 | 93.6 | 5.10 | Regional Banks |
| First Advantage Bcp (FABK) | 1.31 | 324.7 | 84.4 | 61.0 | 29.3 | 3.61 | 70 | 98.3 | 25.07 | Regional Banks |
| Hibernia Bancorp Inc. (HIBE) | 1.22 | 125.0 | 53.9 | 17.8 | 2.7 | 0.80 | 82 | 99.1 | 31.50 | Regional Banks |
|
IEH Corporation (IEHC) |
1.29 | 48.0 | 5.7 | 6.0 | 14.1 | 2.30 | 80 | 97.5 | 8.90 | Electron Instru & Con’ls |
| Independence Holding (IHC) | 1.16 | 329.8 | 35.6 | 24.5 | 8.8 | 14.01 | 91 | 98.0 | 35.65 | Insurance (Life) |
| New Ulm Telecom Inc. (NULM) | 1.27 | 114.0 | 87.1 | 11.1 | 19.5 | 5.16 | 83 | 94.7 | 16.80 | Communications Servs |
| Parkway Acquisition (PKKW) | 1.14 | 207.3 | 10.6 | 95.6 | 24.8 | 5.02 | 76 | 99.9 | 12.99 | Regional Banks |
| Porter Bancorp, Inc. (PBIB) | 1.20 | 599.7 | 28.0 | 19.5 | 17.5 | 6.11 | 73 | 88.1 | 13.70 | Regional Banks |
| Source: AAII’s Stock Investor Pro/Thomson Reuters. Data as of March 29, 2018. | ||||||||||
Unlike O’Neil’s CAN SLIM approach, which focuses on earnings and price momentum with no value elements, the cornerstone of the Stock Market Winners strategy is a price-to-book-value ratio of no more than 1.5. Based on current market valuation, this limits the universe of eligible companies to the bottom 36% of U.S.-listed stocks. This is slightly higher than the maximum value used in Reinganum’s original study, in order to allow for a larger pool of potential candidates. Regional bank ES Bancshares Inc. (ESBS) has the lowest price-to-book-value ratio among these companies at 1.00.
Because of the screen’s restrictive value-oriented rule, it is not surprising that the current group of passing companies has a lower median price-earnings multiple (14.2) than the typical exchange-listed stock (21.4), as well as a lower median price-to-book-value ratio (1.25 versus 2.02).
Low price-to-book-value screens typically identify neglected stocks, but many of these stocks deserve to be neglected. Therefore, secondary or conditioning screens are needed to help separate those stocks that deserve to be ignored from those that may be poised for a turnaround.
Some of these conditioning filters in the Stock Market Winners methodology focus on quarterly earnings momentum. The first requires year-over-year growth in earnings per share for each of the last two fiscal quarters. Comparing one quarter to the same quarter a year prior eliminates the seasonality in earnings that many companies experience.
Equity BancShares Inc. (EQBK), a bank holding company, saw its earnings jump 833.6% for the quarter ended December 31, 2017. (The company releases results for the quarter ending March 31, 2018, on April 20—after our publication deadline for this issue.) Whenever such a large percentage increase is reported, it is a good idea to examine the scale of earnings. Upon further investigation, we found that earnings from continuing operations grew from $0.04 per share for the quarter ended December 31, 2016, to $0.39 per share for the quarter ended December 31, 2017. The company has benefited from growth in its loan and securities balances and increases in service charges and fees and in debit card income.
Furthermore, the Stock Market Winners approach requires that the year-over-year growth in earnings from continuing operations for the latest fiscal quarter be greater than the year-over-year earnings growth of the previous quarter.
This short-term earnings growth seems to have carried over to the longer term, as the current passing companies have a median five-year average earnings growth rate of 20.7%, compared to 5.8% for the typical exchange-listed stock. Bank holding company Parkway Acquisition Corp. (PKKW) has the highest average annual growth in earnings over the last five years at 95.6%. The company has seen its annual earnings from continuing operations rise from a loss of $0.03 per share in 2012 to positive earnings of $0.77 per share in 2017. On the other end of the spectrum is IEH Corporation (IEHC), a designer and manufacturer of printed circuit connectors, which has seen earnings grow at an average rate of 6.0% over the last five years.
Another component of the Stock Market Winners strategy is price momentum. To this end, the screen makes use of a weighted relative strength measure that emphasizes more recent price performance. This measure gives the most recent quarterly price change relative to the S&P 500 a weight of 40% and a 20% weighting to each of the previous three quarters. In order to meet the criteria of the Stock Market Winners strategy, a stock must have a weighted relative strength value that is higher than 70% of all stocks.
Independence Holding Company is one of two stocks with the highest weighted relative strength among the 10 companies meeting the Stock Market Winners criteria as of March 29, 2018, at 91%. Over the last 52 weeks, Independence Holding’s shares have outperformed the S&P 500 by over 62%, gaining 81.4%. The stock’s 39.3% gain over the last 26 weeks outpaced the S&P 500 index by more than 32%.
First Advantage Bancorp (FABK) is just above the cutoff with a weighted relative strength rank of 70%. Over the last 52 weeks the stock has outperformed the S&P 500 by nearly 7% while beating the index by more than 11% over the last 26 weeks.
The Stock Market Winners strategy also requires that the current stock price be within 15% of its two-year high. All but one of the companies currently satisfying the Stock Market Winners criteria are trading within 10% of their two-year highs. EACO Corp. (EACO) is at the top, as it closed at its two-year high on March 29, 2018.
Lastly, Reinganum’s research revealed that 90% of the firms in his study had fewer than 20 million shares outstanding before their price increase. Therefore, this is the limit instituted for AAII’s Stock Market Winners screening strategy. All but two of the passing companies had less than seven million shares outstanding for their latest fiscal quarters. Hibernia Bancorp Inc. (HIBE) had the lowest number of shares outstanding at 800,000.
Limiting the number of shares outstanding (and not excluding stocks trading over the counter, or OTC) leads this approach to isolate very small firms in terms of market capitalization (shares outstanding multiplied by price per share). The stocks currently meeting the Stock Market Winners criteria have a median market capitalization of only $75 million, whereas the typical exchange-listed stock has a market cap of over $900 million. For the 10 companies currently satisfying the Stock Market Winners criteria, Equity BancShares has the highest market cap at $569.2 million while ES Bancshares, which trades over the counter, has the smallest market capitalization at $11.4 million.
Conclusion
By creating a stock selection strategy based on characteristics that have worked well in the past, we are assuming that the factors will remain relevant going forward, which is by no means guaranteed.
No matter how well a stock screening approach has performed historically, it is important to remember that stock screening is only the first step in the analysis process. Once you have winnowed the stock universe down to a more manageable set of companies, it is important to perform additional due diligence on the remaining companies to verify their financial strength as well as to determine how well they match your risk tolerances and investment time horizon.
For comprehensive coverage of the screening strategies tracked by AAII, see the AAII Stock Ideas section of our website.

Related

First Cut Stocks
Stocks With Low Price-to-Book Ratios
Related

Growth Investing
Investing in Proven Growth Using CAN SLIM Revised
Discussion
FREE REPORT

Get your free copy of our special
report analyzing the tech stocks
most likely to outperform the
market.
Bill Renaud from TX posted over 8 years ago:
Martin Bernstein from FL posted over 8 years ago:
Krishna Emandi from TX posted over 8 years ago:
Greg Fitz from VA posted over 6 years ago:
You need to log in as a registered AAII user before commenting.
Log InCreate an account