



The founder of MyPlanIQ.com shows how to use his online portfolio management platform to build a well-rounded retirement portfolio.
When it comes to retirement investments, it’s paramount to construct a portfolio that can deliver a reasonable return with acceptable risk. This is where asset allocation comes into play. One should carefully choose funds that represent specific asset classes being targeted within a portfolio. Furthermore, one can reduce risk by carefully weighting allocations to each asset class and choosing asset classes that have a low correlation (meaning they haven’t historically moved in the same direction).
The criteria to choose asset classes should be:
- Returns: These asset classes should deliver reasonable long-term returns.
- Risk: They are more or less uncorrelated. Ideally, they can hedge each other. Individually, they should pose as little risk as possible for a given level of return.
Asset allocation (weighting in different assets) is the one of the main factors that affect a portfolio’s overall return and risk. In a study of hundreds of U.S. pension funds by Gary Brinson, Randolph Hood and Gilbert Beebower, it was found that asset allocation is responsible for over 90% of variations in portfolio return. Even though it’s still arguable how much asset allocation impacts a portfolio’s return, it’s very intuitive and compelling that asset weighting (allocation) is one of the main determining factors. Therefore, investors should take asset allocation seriously.
Long-Term Asset Class Returns
There are two major asset classes that a balanced asset allocation portfolio should possess: equities (stock ownership) and debts (bonds). Other major asset classes worth considering are so-called alternative assets. In the following, we look at these assets in more detail.
Equities
Equities represent fractional stock ownership. Owning stocks means that you become a shareholder who can claim part of the underlying company. A shareholder shares the company’s profit or loss. It’s a direct participation in the success or failure of a business. In an article at our website MyPlanIQ.com, we stated that equities should deliver extra returns over cash or bonds (also known as the risk premium) in the long term. The main reason is that whilestocks have historically given investors (their owners) a better return over the long term, they tend to be more risky than fixed-income assets. While the investor wants the higher return that equity securities provide, he must be compensated for this additional risk. An additional risk to equity securities is that if the company goes bankrupt, bond investors would be paid first.
Essentially, higher-risk investments have a higher risk premium, and are therefore expected to deliver higher returns over the long term.
In a globally diversified portfolio, there are three main equity assets:
- The first is U.S. stocks. U.S. stocks have consistently shown 5% to 6% extra annualized returns over inflation (the real return—i.e., nominal return minus inflation). In fact, for the past 90 years until 2015, Figure 1 shows U.S. stocks delivered 6.6% annualized real return, or 9.5% annualized nominal return.
- The second major economic bloc is Europe and Japan, also known as the foreign developed markets. These stock markets have also delivered similar long-term returns as the U.S. For example, in Figure 2, for the past 116 years until 2015, U.K. equities (one of the largest economies in this bloc) delivered 5.0% annualized real return, or 8.9% annualized nominal return.
- The third major economic bloc is the emerging markets. For the past 30 years, emerging markets like India, China, Taiwan, Brazil, eastern European countries and Singapore have grown rapidly. Depending on the definition, the aggregate emerging market economy accounts for around one-third of world gross domestic product (GDP). In Table 1, one can see that emerging market equity has delivered a reasonable return, though it was hurt recently.
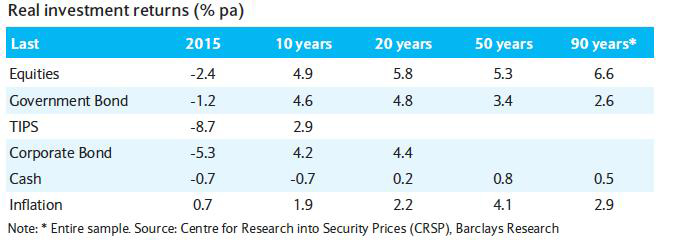
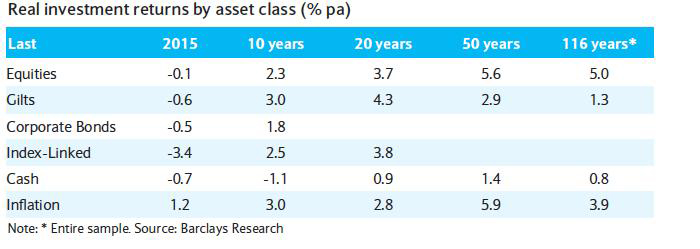
Table 1. Major Stock and Bond Returns (as of 3/3/2017)
| Ticker (Fund Name) | Annual Return | |||||
|---|---|---|---|---|---|---|
| 1 Yr | 3 Yr | 5 Yr | 10 Yr | 15 Yr | Since 12/31/96 | |
| VTSMX (Vanguard Total Stock Mkt Idx Inv) | 23.0% | 10.3% | 13.8% | 7.9% | 7.6% | 8.1% |
| NAESX (Vanguard Small Cap Index Inv) | 27.1% | 7.6% | 13.6% | 8.5% | 9.6% | 9.2% |
| VGTSX (Vanguard Total Intl Stock Index Inv) | 15.2% | 1.1% | 4.1% | 1.6% | 6.2% | 4.7% |
| VEIEX (Vanguard Emerging Mkts Stock Idx) | 22.3% | 3.0% | -0.4% | 3.0% | 9.1% | 5.8% |
| VGSIX (Vanguard REIT Index Inv) | 10.5% | 10.9% | 11.1% | 5.1% | 10.6% | 9.6% |
| VBMFX (Vanguard Total Bond Market Index Inv) | 0.7% | 2.1% | 1.9% | 4.0% | 4.3% | 5.0% |
Bonds
Bonds are debt (loan) contracts that allow a lender to get the principal back when the contracts mature, in addition to interest received over the life of the bond. Bonds are thus called fixed income. In general, bonds are more stable than stocks, even though they are also subject to the risk of default or missed interest payment. If investors want to sell bonds before they mature in a secondary market, they are also subject to interest rate risk, as bond prices can fall or rise depending on the prevailing interest rate at the time of selling. As rates rise, prices decline and vice versa.
Bonds are an essential asset class that offers stability when stock prices fall. In a falling stock market, demand of “safer” investments such as bonds rises, and thus bonds can compensate for the loss of stock investments. Bonds have been in a secular bull market since the early 1980s, and many investors fear that once the bull market ends, they will suffer great loss in their fixed-income investments. However, historical evidence indicates that the situation is less dire. Even in a bond bear market, bonds can still offer positive nominal returns as the interest rates begin to slowly rise, capital losses are compensated by interest payments, and investors periodically repurchase new bonds as the older bonds mature.
Alternative Assets
In the past 10 years, many new investment instruments have become available; other useful asset classes have found a way to help diversify and enhance portfolios. At MyPlanIQ.com, we believe real estate investment trusts (REITs) are particularly useful for retirement investments. A REIT invests in real estate or properties that primarily derive income from rental. Furthermore, it can incur capital appreciation or loss if the price of underlying properties increases or decreases at liquidation. By law, a REIT must distribute at least 90% of its earnings as dividends to its investors. For this reason, REITs have often been attractive investments for income investors. However, even for overall capital growth, REITs have delivered comparable total return (dividend reinvested) in the long term. In Table 1, the Vanguard REIT Index Fund (VGSIX) has had the best total returns in the past 15 and 20+ years. Based on NAREIT, from Dec. 31, 1978 through March 31, 2016, total returns for exchange-traded U.S. equity REITs have averaged 12.9% per year compared to just 11.6% per year for stocks.
However, REITs can be volatile. In fact, the Vanguard REIT Index Fund had a 71% maximum drawdown during the financial crisis in 2008–2009, compared with 55% of the S&P 500 index tracking Vanguard 500 Index Fund (VFINX). It also underperformed VFINX in the past 10 years.
David Swensen, the Yale endowment manager, and many other well-known investors have pointed out that REITs can be a good portfolio diversifier that enhances overall returns. For example, Swensen recommends 20% REIT exposure in an individual portfolio (see our article: P David Swensen Yale Individual Investor Portfolio Annual Rebalancing).
Another prominent alternative asset class is commodities. However, for average investors, we don’t recommend it unless you follow a well-defined sound investment strategy.
Equity Sub-Asset Classes
Within the major asset classes, one can invest in sub-assets to boost returns. For stocks, investors should consider getting exposure to the following sub-asset classes if they are available.
Small-Capitalization Stocks
Small companies that have market capitalizations less than $2 billion are considered small capitalization (sometimes this threshold varies). In general, these companies grow faster than larger companies, and tend to offer better returns in the long term. In Table 1, small-cap index fund NASEX outperformed large-cap index fund VFINX for the past 10, 15 and 20+ years by about 1%–2%.
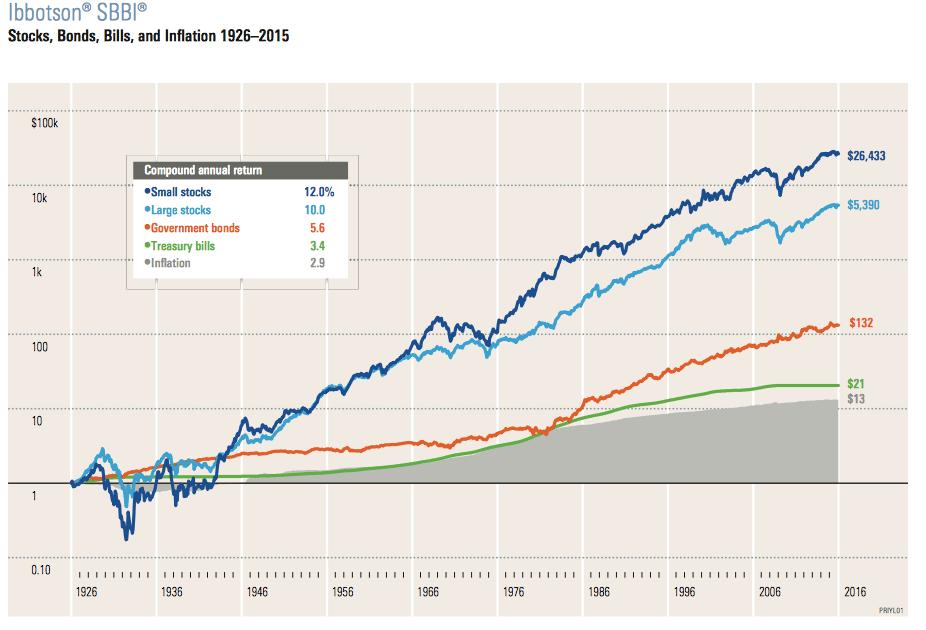
Ibbotson has tracked the long-term performance of small-cap stocks. In Figure 3, it shows that small-cap stocks outperformed large stocks by 2% from 1926 to 2015.
Dividend-Paying Stocks
Another stock sub-asset class worth considering is dividend stocks. In the long term, dividend stocks have had a similar total return compared with broad stock market indexes. However, they offer more steady dividend income and have historically had less volatility. In Table 2, one can see that dividend stocks are very comparable with the S&P 500 over a long period.
Table 2. Dividend Stocks vs. S&P 500 (as of 3/3/2017)
| Ticker (Fund Name) | Annual Return | |||||
|---|---|---|---|---|---|---|
| 1 Yr | 3 Yr | 5 Yr | 10 Yr | 15 Yr | Since 3/31/93 | |
| VFINX (Vanguard 500 Index Investor) | 22.0% | 11.1% | 14.0% | 7.7% | 7.0% | 9.2% |
| VDIGX (Vanguard Dividend Growth Inv) | 15.3% | 9.8% | 12.6% | 8.7% | 7.8% | 8.2% |
Dividends are considered “sticky,” meaning that management is very hesitant to decrease the dividend once it has been implemented. Management knows that investors rely on the steady stream of income. Historically, if a dividend is decreased, the company’s stock has been severely punished.
Dividend-paying companies tend to be more mature, sustainable firms, which is a primary reason why dividend-paying stocks are less volatile than their non-dividend-paying counterparts.
Fixed-Income Sub-Asset Classes
Many investors overlook the importance of sub-asset classes in bonds. Some sub-asset classes of bonds can be very effective to help enhance returns or hedge losses from stock positions. MyPlanIQ believes it’s possible to actively manage exposures to these sub-asset classes to deliver returns above the market.
There are two main risk spectrums in bond investment: interest risk and credit risk. Interest rate risk is related to the maturity length of a bond: the longer the maturity, the higher the interest rate risk. Interest rates and bond prices have an inverse relationship: as interest rates rise, bond prices fall and vice versa.
Bonds are generally divided into three maturity groupings: short-term, intermediate-term and long-term. They are also often categorized based on what type of entity issues the bond: typical categories include government bonds or corporate bonds.
Credit risk is the risk of default on a debt that may arise from a borrower failing to make required payments. Credit risk is often measured by the bond credit ratings from Moody’s or Standard & Poor’s, and typically applies to corporate bonds (government bonds are considered “safer” and therefore have higher credit quality). U.S. Treasury bonds are considered of the highest credit quality, thus belonging to a separate class that differ from investment-grade corporate bonds.
In general, when referencing credit quality, one can divide bonds into investment-grade and high-yield. High-yield bonds offer higher returns but also possess higher risk. For example, the Vanguard High Yield Bond Index Fund (VWEHX) had a 6.3% annualized return for the past 10 years, better than the total bond market index fund’s (VBMFX) 4% return, but it lost 21% in 2008, compared with VBMFX’s 5.1% gain in that year.
Other important bond asset classes include inflation-protected bonds, emerging market bonds, foreign bonds and municipal bonds.
There are a wide spectrum of bonds to select from, and we believe a good active bond investment strategy can be used to outperform a bond index fund. For more details, see our article September 26, 2016: Fixed Income Investing: Actively Managed Funds vs. Index Funds.
Asset Allocation: Putting It Together
Once the asset classes are identified, the next step is to decide asset allocation (or weights to the asset classes) based on an investor’s risk profile. A simple way to decide asset allocation is to first decide how much should be invested in “safe” bond sub-asset classes that exclude riskier sub-classes such as high-yield bonds, emerging market bonds and long-term bonds. Once the “safe” allocation is decided, the rest is allocated to “risk” assets including stocks, alternative assets and risky bonds.
There is no right or wrong asset allocation for a given individual. Factors like an investor’s age, income and risk tolerance are important to help decide the risk allocation, in addition to long-term stock and bond performance and expected returns. MyPlanIQ.com first asks a user a series of simple questions and then uses a mean variance optimization (MVO) technique to decide the risk and “safe” allocations. Other robo-advisers also feature a questionnaire to evaluate and decide such allocations. Some of them will even disclose your recommended allocation without requiring you to open an account. Alpha Architect, AssetBuilder, Ally Invest, Betterment, Wealthfront and Schwab Intelligent Portfolios are among the robo-advisers that disclose what your recommended allocation would be without requiring you to open an account.
Allocations among risk asset classes (U.S. stocks, international stocks, emerging market stocks, REITs, etc.) and bonds can be determined in the above step or subsequently. Again, many online services including MyPlanIQ.com can help investors in this process.
It’s important to note that if there are sub-asset classes such as U.S. small-cap stocks in the plan, their allocations will be also decided based on their historical and expected correlation, risk and returns.
Asset allocation can be strategic or tactical. A strategic allocation does not change the asset allocations often and will only rebalance back to the target (or predetermined) allocations periodically. On the other hand, a tactical allocation is a dynamic allocation that can change or reduce risk allocation from time to time, depending on market conditions and other factors. It can reduce investment loss when markets are distressed.
There are pros and cons for both strategic and tactical asset allocation strategies. A hybrid so-called core satellite approach is to adopt both strategies in one’s overall investments so that the two portions can complement each other. You can find more asset allocation information at our site here.
AAII also offers asset allocation models.
Fund Selection: Index Funds or Actively Managed Funds
The next question for retirement investing is how to choose funds that represent the asset classes. Based on our extensive studies, we believe that, for average retirement investors, low-cost index funds should be used for stock (equity) assets. If it is possible to, good actively managed total return bond funds (intermediate-term bond funds) can be used for bonds to enhance returns. Here is a more detailed explanation.
Index Funds for Stock Assets
The two main reasons we believe low-cost index funds should be the first choice for stock asset classes are:
- Active stock funds rarely outperform index funds consistently, and
- Risk (stock) funds are heavily influenced by sectors and styles.
Active stock funds rarely outperform index funds consistently.
Though it has been a popular and hotly debated topic on the value of active stock funds, common sense and experience tell us that there have been way too many great stock funds that suffered from sudden downward performance. Sequoia (SEQUX) is one of the recent examples. Table 3 shows some recent “disgraceful” funds:
Table 3. Performance Comparison: Sample Actively Managed Value Funds (as of 9/16/2016)
| Ticker (Fund Name) | YTD Return | Annual Return |
Sharpe Ratio (10 Yr) |
|||
|---|---|---|---|---|---|---|
| 1 Yr | 3 Yr | 5 Yr | 10 Yr | |||
| SEQUX (Sequoia) | -10.8% | -26.3% | -0.8% | 8.1% | 5.9% | 0.29 |
| LMVTX (Legg Mason Cap Mgmt Value C) | 4.1% | 6.1% | 7.1% | 12.9% | 1.7% | 0.05 |
| FAIRX (Fairholme) | -1.0% | -12.2% | -3.7% | 6.9% | 4.7% | 0.18 |
| LLPFX (Longleaf Partners) | 15.3% | 11.6% | 2.4% | 8.6% | 3.8% | 0.14 |
| TAVFX (Third Avenue Value Instl) | 5.8% | 4.9% | 1.7% | 7.3% | 2.1% | 0.07 |
| DODGX (Dodge & Cox Stock) | 7.4% | 6.8% | 8.1% | 14.9% | 5.5% | 0.22 |
| VFINX (Vanguard 500 Index Investor) | 5.8% | 9.0% | 10.0% | 14.1% | 7.1% | 0.31 |
See detailed year-by-year comparison
The first two funds are well covered. Fairholme’s Bruce Berkowitz was named as the manager of the year by Morningstar. He was a rising value investing star before 2008. The next three funds are all managed by well-known value investors and have been recognized for a long time. Not only have these funds underperformed the Vanguard S&P 500  (VFINX), they underperformed by a big margin: as high as a 5.4% difference!
We also took a look at the performance of the domestic (U.S.) stock funds whose managers won at least once the coveted Morningstar Manager of the Year awards. Table 4 shows the funds whose managers won the award before year 2000.
Table 4. Performance Comparison: Morningstar’s Manager of the Year Funds
(as of 9/16/2016)
| Ticker (Fund Name) | Annual Return | Sharpe Ratio (10 Yr) | |||
|---|---|---|---|---|---|
| 1 Yr | 3 Yr | 5 Yr | 10 Yr | ||
| FKACX (Franklin Growth Opportunities C) | -3.4% | 7.2% | 10.8% | 7.7% | 0.3 |
| VIGRX (Vanguard Growth Index Inv) | 6.4% | 10.7% | 14.0% | 8.6% | 0.39 |
| FMAGX (Fidelity Magellan) | 4.3% | 10.0% | 13.5% | 5.6% | 0.22 |
| TAVFX (Third Avenue Value Instl) | 4.9% | 1.7% | 7.3% | 2.1% | 0.07 |
| PRNHX (T. Rowe Price New Horizons) | 5.8% | 9.4% | 16.7% | 11.4% | 0.47 |
| FPPTX (FPA Capital) | -0.1% | -2.1% | 3.7% | 5.0% | 0.21 |
| SKSEX (Skyline Special Equities) | -0.7% | 5.3% | 15.3% | 7.4% | 0.27 |
| NAESX (Vanguard Small Cap Index Inv) | 5.7% | 7.3% | 13.6% | 8.0% | 0.3 |
| NYVTX (Davis NY Venture A) | 5.7% | 7.7% | 12.2% | 5.3% | 0.21 |
| GABAX (Gabelli Asset AAA) | 4.9% | 4.7% | 10.8% | 7.2% | 0.32 |
| YACKX (Yacktman Svc) | 10.8% | 5.7% | 10.7% | 9.6% | 0.5 |
| CFIMX (Clipper) | 9.6% | 10.0% | 13.3% | 5.2% | 0.21 |
| VFINX (Vanguard 500 Index Investor) | 9.0% | 10.0% | 14.1% | 7.1% | 0.31 |
See detailed year-by-year comparison
Notice that some funds have different styles and should be compared with their respective benchmarks (highlighted). For example, PRNHX (T. Rowe Price New Horizons) is a small-cap stock fund and it should be compared with Vanguard Small Cap Index (NAESX).
These funds are the who’s who in the mutual fund industry of the last 20 to 30 years, long enough for a generation of investors to have patience in them. However, the majority of these funds have vanquished or underperformed significantly.
Again, Table 4 shows it’s hard to maintain consistent outperformance.
Larry Swedroe of the BAM Alliance has written a series of articles for the Advisor Perspectives newsletter on the persistence of outperformance of actively managed stock funds by looking at the performance of many well-known funds. Interested readers can read his latest article: Are the Returns of Jeremy Siegel’s “Superstar” Funds Likely to Persist?
Risk (stock) funds are heavily influenced by sectors and styles.
The other problem with active stock funds is so called “disappearing alpha”: Their performance is mostly influenced by their so-called factor weights instead of individual stock-picking ability. In academic studies, Fama and French’s four-factor model is the most famous. Basically, it states that the performance of a stock fund can be mostly explained (or decided) by the following factors:
- Beta or market exposure—how much correlated with a broad-based market index (such as S&P 500);
- Size—large capitalization or mid cap or small cap of a stock;
- Value—how expensive a stock is (value stocks vs. growth stocks); and
- Momentum—the recent price performance.
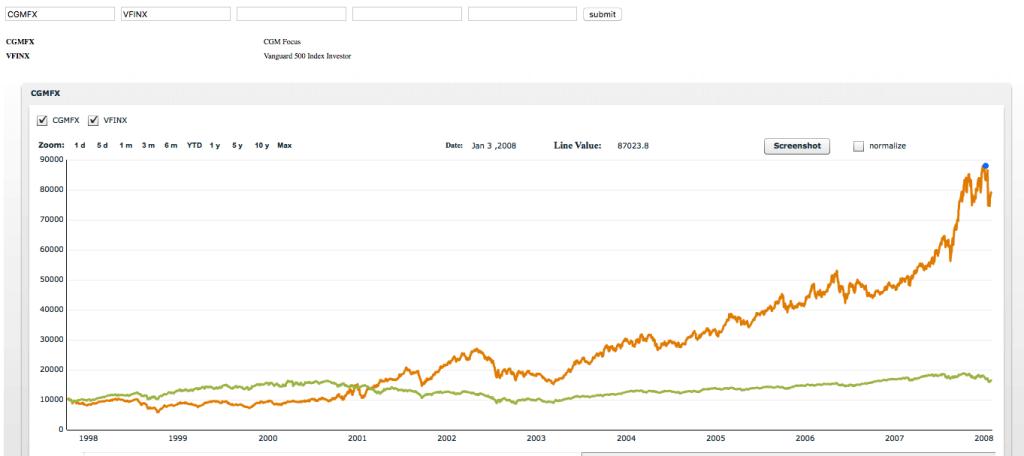
A famous example is CGM Focus (CGMFX). The fund had a fantastic run before 2008, averaging 23.5% annually since its inception in 1997. It outperformed S&P 500 by a large margin (see Figure 4). At times, investors were attracted by the fund’s stock-picking ability. However, a more elaborate analysis reveals that the outperformance was mostly due to its timely and outsized bets on various sectors. To some extent, it was more a sector rotation fund.
Unfortunately, just like other popular stock funds, this fund has lagged since then, as shown in Table 5.
Table 5. Performance Comparison: CGMFX (as of 8/31/2016)
| Ticker (Fund Name) | YTD Return | Annual Return |
Sharpe Ratio (10 Yr) |
|||
|---|---|---|---|---|---|---|
| 1 Yr | 3 Yr | 5 Yr | 10 Yr | |||
| CGMFX (CGM Focus) | -7.8% | -12.1% | 1.3% | 5.1% | 2.4% | 0.05 |
| VFINX (Vanguard 500 Index Investor) | 7.7% | 13.7% | 12.0% | 14.6% | 7.4% | 0.33 |
Actively Managed Total Return Bond Funds for Fixed Income
Unlike in stock investing, in principle, we prefer using a selected list of actively managed fixed-income bond funds instead of bond index funds. However, that does not mean we like any actively managed bond funds. In fact, there are only handful of bond funds that qualify as our candidate funds.
There are three main supports for this claim:
- Capitalization weighting in a bond index fund is questionable,
- Some actively managed bond funds can outperform index funds more consistently, and,
- More importantly, it’s possible to pick a winning total return bond fund periodically.
Capitalization weighting in a bond index fund is questionable.
The first objection to investing in a bond index fund is that it is not intuitive to use market value (capitalization) to decide how much an index fund should invest. For example, if a company borrows more, its bonds will have bigger capitalization, thus it will have bigger weight in an index fund. Similarly, if the government issues more debts, its bonds get more weight. This is exactly what has happened lately as the prices of U.S. Treasury bonds have risen so much. Even John Bogle, the champion of indexing, has voiced concerns on this.
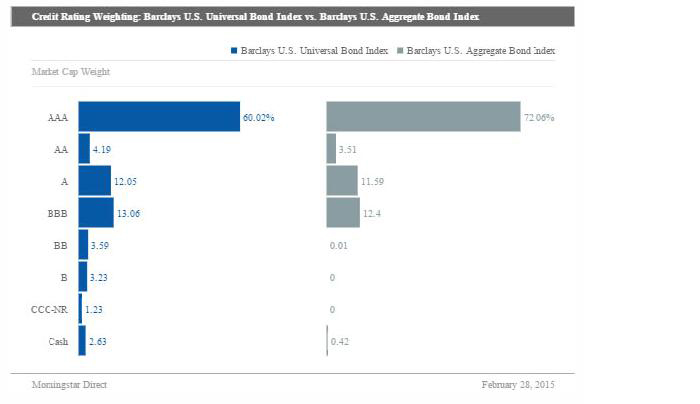
The other surprising fact is that the Barclays U.S. Aggregate Bond Index [the most popular bond index and the one that the biggest bond fund, Vanguard Total Bond Index Fund (VBMFX), and the ETFs AGG and BND are based upon] has no or very little (less than 1%) exposure in high-yield bonds, as shown in Figure 5 from this Morningstar article:
It’s also true that the total aggregate bond index has no exposure to municipal bonds or foreign bonds. Municipal bonds, though mostly used for taxable accounts, can actually outperform even taxable funds from time to time (even before tax). They deserve to have a place in your portfolio. See our article April 25, 2016: Tax Free Municipal Bond Funds & Portfolios on municipal bond fund-based portfolios.
The criticism of less exposure in high yields and other sectors can be remedied by investing in index funds in those sectors. However, the capitalization-weighting problem is certainly something hard to correct in a normal index fund.
Some actively managed bond funds can outperform index funds more consistently.
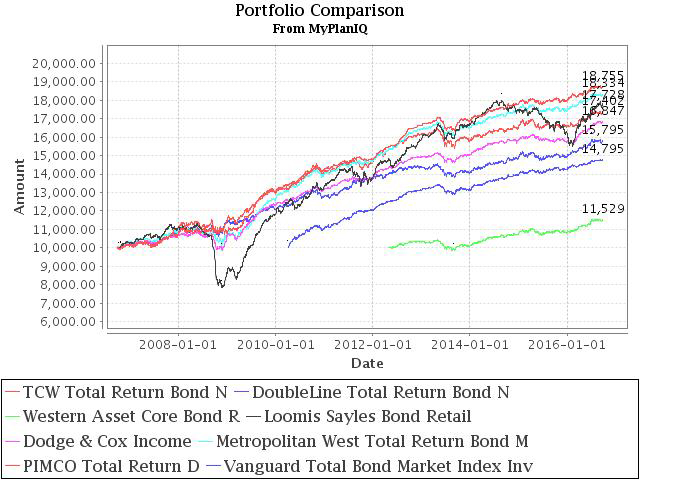
More importantly, unlike in stock investing, there are only a small amount of actively managed bond funds that have outperformed general bond index funds over a long period of time. Table 6 shows the 15-year performance of the list of candidate funds used in our fixed-income portfolios listed on the Brokerage Investors page. Figure 6 shows the growth of the funds in chart form.
Table 6. Performance Comparison: Total Return Bond Funds (as of 9/26/2016)
| Ticker (Fund Name) | YTD Return | Annual Return | ||||
|---|---|---|---|---|---|---|
| 1 Yr | 3 Yr | 5 Yr | 10 Yr | 15 Yr | ||
| TGMNX (TCW Total Return Bond N) | 4.4% | 4.1% | 4.1% | 4.6% | 6.5% | 6.1% |
| DLTNX (DoubleLine Total Return Bond N) | 3.7% | 3.4% | 4.1% | 4.2% | — | — |
| WABRX (Western Asset Core Bond R) | 6.4% | 6.0% | 4.7% | — | — | — |
| LSBRX (Loomis Sayles Bond Retail) | 9.4% | 7.8% | 2.8% | 5.5% | 5.9% | 8.4% |
| DODIX (Dodge & Cox Income) | 6.8% | 6.6% | 4.3% | 4.2% | 5.4% | 5.5% |
| MWTRX (Metropolitan West Total Return Bond M) | 5.1% | 4.9% | 3.9% | 4.5% | 6.3% | 5.6% |
| PTTDX (PIMCO Total Return D) | 4.5% | 4.8% | 3.2% | 3.7% | 5.7% | 5.5% |
| VBMFX (Vanguard Total Bond Market Index Inv) | 5.6% | 5.3% | 3.9% | 2.8% | 4.7% | 4.6% |
See detailed year-by-year comparison
Unlike stock funds, these bond funds have consistently outperformed bond market index fund such as the Vanguard Total Bond Market Index Fund (VBMFX). In fact, not only have they done better for the past 15 years (for those that have data), but each of them has also outperformed VBMFX since its inception, respectively.
As an example, the PIMCO Total Return (PTTDX) bond fund was a consistent winner before 2014. After its star manager Bill Gross left PIMCO, the fund suffered; it had worse one- and three-year returns than VBMFX. However, it still betters VBMFX by 1% in its 10-year annualized return. Another example is Loomis Sayles Bond Retail (LSBRX), the most aggressive among this set of total return bond funds. It tends to take oversized exposure to high-yield bonds to boost its return. This has helped its performance, though it was badly hurt in both 2008 and 2015 when low-quality bonds (high-yield bonds) had difficulty. However, this fund has a long outstanding performance record. Since its inception in 1997, its 7.6% annualized return is 2.2% higher than VBMFX’s 5.4%!
A similar but more conservative fund is Dodge & Cox Income (DODIX). It takes opportunistic bets on corporate bonds. It outperformed VBMFX by a smaller margin, but with much smaller risk.
In general, we believe that because of the relatively stable trends in the bond market, it’s easier for a manager to take advantage of the intermediate-term strength of bond segments (such as high yield, long corporate bonds, etc.).
It’s possible to pick a winning total return bond fund periodically.
At MyPlanIQ, we have shown that a portfolio that periodically picks the best total return bond fund from a set of funds with solid long-term record can outperform the bond index fund by a wide margin. We recommend our following articles on these portfolios:
- April 25, 2016: Tax Free Municipal Bond Funds & Portfolios
- October 26, 2015: Total Return Bond Fund Review
- June 15, 2015: Giving Up Bonds?
- September 22, 2014: Why Total Return Bond Funds?
- June 3, 2013: Total Return Bond Fund Portfolios For Major Brokerages
The representative portfolios listed on our Advanced Strategies page serve as the benchmarks, as shown in Table 7 (brokerage-specific portfolios can be found on the Brokerage Investors page).
Table 7. Performance Comparison: Portfolio
| Portfolio Name | YTD Return | Annual Return | Since 7/30/2000 | |||
|---|---|---|---|---|---|---|
| 1 Yr | 3 Yr | 5 Yr | 10 Yr | |||
| P Bond Funds Momentum Based on Upgrading Fixed Income Managers of the Year`s Funds Monthly | 8.2% | 8.5% | 5.8% | 6.5% | 7.8% | 9.4% |
| P Bond Funds Momentum Based on Upgrading Fixed Income Managers of the Year Quarterly | 8.1% | 7.8% | 4.8% | 6.2% | 7.5% | 8.9% |
| VBMFX (Vanguard Total Bond Market Index Inv) | 5.6% | 5.3% | 3.9% | 2.8% | 4.7% | 5.2% |
The two portfolios have had a more than 3.7% extra annualized return over VBMFX in the last 16 years. This outstanding performance (and ongoing performance) is the best testimony to our claim that it’s possible to utilize actively managed bond funds to achieve very reasonable return without much risk.
Fund Selection: Putting It Together
To summarize, we advocate low-cost index funds for stock assets and good total return bond funds for a fixed-income bond asset. This section discusses how to select funds.
If you are using a robo-adviser or an online service like MyPlanIQ.com, funds are usually chosen for you. MyPlanIQ.com selects funds based on their historical performance, expense and management. In an individual retirement account (IRA) where investors can select from a wide range of funds, we further pre-select some excellent funds as candidates. For example, for the fixed-income portfolios of an IRA or taxable account, MyPlanIQ only selects total return bond funds from a very limited pool of candidates. After the candidate funds are selected, algorithms decide fund selection at the time of rebalancing.
Researching Funds Online
If you decide to do it yourself completely, there are several websites that allow you to research mutual funds and exchange-traded funds (ETFs) online.
AAII publishes performance data on mutual funds and ETFs annually. AAII’s Computerized Investing outlines which websites you could use to search for mutual funds and ETFs online. The best sites are recommended for mutual fund and ETF data, mutual fund and ETF ratings and recommendations, and mutual fund and ETF screeners.
You also will likely have access to fund and ETF research through your brokerage account. If you are interested in seeing the low-commission funds or ETFs that a particular brokerage offers, most of the brokerages allow you to view this list without having an account.
For a 401(k)-type retirement plan, you can research funds in the investment options and decide which to choose at a rebalance time. For example, Vanguard lets you browse through mutual funds on their website.
Practical Considerations For IRAs and 401(k) Accounts
It’s very common for many users to have several accounts: 401(k) plans or employer-sponsored retirement accounts, IRAs and taxable accounts. We’ll look at IRAs and 401(k)-type accounts in more detail and offer some observations. For a related topic on how to allocate overall capital across multiple accounts, please refer to our article December 16, 2013: Tax Efficient Portfolio Planning.
Brokerages for IRAs
Many major brokerages still target active traders instead of portfolio builders. To the extent that we have investigated, we aren’t satisfied with what’s provided for individual investors who just want to construct a balanced asset allocation portfolio instead of trading ETFs and stocks. For example, so far, no brokerages other than Folio Investing provide a basket portfolio rebalance feature that allows investors to rebalance a portfolio at one time, instead of being forced to issue many sell and buy orders. The good news is that such a feature exists in many 401(k) accounts. However, if you limit yourself to only finding a brokerage that’s good for portfolio construction, some of our observations follow.
ETFs
You want to find a brokerage that provides ETFs commission-free or with low commission. If you deem Vanguard’s ETFs good enough for your portfolio construction, you might as well open an account in Vanguard brokerage. The other choice is TD Ameritrade, which provides most of Vanguard ETFs commission-free. If you still want to get some exposure to other ETFs, another choice is Merrill Edge, which allows you to have 30 commission-free trades in each month if you have over $50,000 in your combined Bank of America bank accounts and brokerage accounts. Other firms provide commission-free ETFs that are either very illiquid (such as Schwab’s many commission-free ETFs) or incomplete. Fidelity offers half-baked commission-free ETF trades that are only buy commission-free, but not sell commission-free. We think you would be better off in other brokerages that offer real commission-free trades.
For this purpose, we found that the Vanguard brokerage is probably the best that provides all Vanguard funds without transaction fees. Fidelity and Schwab also provide some good low-cost index funds (though they are not as complete as Vanguard’s). Other than these, many firms have only a limited selection of low-cost index funds, making it very hard to construct a low-cost portfolio. Furthermore, many brokerages have a minimum three-month holding period for a mutual fund; otherwise, they will charge a transaction fee. In TD Ameritrade’s case, it has an unusual six-month requirement, rendering itself almost not useful.
In summary:
- Vanguard brokerage: Offers commission-free Vanguard ETFs, which are relatively complete and extremely low cost.
- TD Ameritrade: provides most Vanguard ETFs commission-free.
- Merrill Edge: If you have over $50,000 in combined accounts, you are entitled to 30 commission-free ETF trades.
IRA or 401(k) Accounts
If you have a 401(k) plan from your current employer, you don’t have much choice as to which brokerage you will use and subsequently which funds they offer. Note, some 401(k) plans allow participants to choose a brokerage window to invest, but sometimes there are many restrictions in the brokerage window. However, if you have a 401l(k)/403(b) or other retirement accounts, you do have a choice whether to retain your old 401(k) account or just roll it over to an IRA or to your current 401(k) account when you leave a firm. Even if you have a 401(k) plan through your current employer, you can open an IRA (or Roth IRA) at a brokerage of your choice, in addition to having the 401(k) through your employer. Things to consider:
- 401(k) accounts might have some ultra-low-cost funds, especially index funds. Sometimes, for a large plan, your administrator can manage to negotiate extremely low fees for some funds (mainly for Collective Investment Trust funds, or CITs). However, considering today’s rock-bottom expenses of index ETF or index mutual funds, this has become less attractive.
- A 401(k) might allow you to access to some good funds that are not available to individual investors in a discount brokerage (where your IRA is most likely to reside). Examples include Dimensional Fund Advisor (DFA) funds that can only be purchased through financial advisers in a retail brokerage account or some load-waived share classes (such as institutional or class A) of funds.
- As stated, 401(k)s have a one-click feature to allow you to rebalance your account based on the percentage allocation. That makes your rebalancing trades much easier.
- If your employer offers to match your contributions in your 401(k), you should definitely take advantage of that (it’s free money!).
In general, even if these factors do exist for you, to simplify your life and consolidate your financial accounts (lots of people are really bogged down by too many accounts), it’s still a good practice to just pick a good low-cost brokerage for your IRA and move your old 401(k)s there. There many also be advantages to rolling your assets over into a Roth IRA account—an interesting topic not covered in this article.
How to Allocate Among IRAs and 401(k) Accounts
If you have both IRA and 401(k) accounts, you need to decide what asset classes or styles of portfolios to be held in what accounts. You must consider your entire portfolio together—meaning that, when determining your overall asset allocation, do not view each account separately. For general allocation between taxable and tax-deferred accounts, we outlined some suggestions in our article December 16, 2013: Tax Efficient Portfolio Planning. However, among tax-deferred IRA and 401(k) accounts, there are more points to consider:
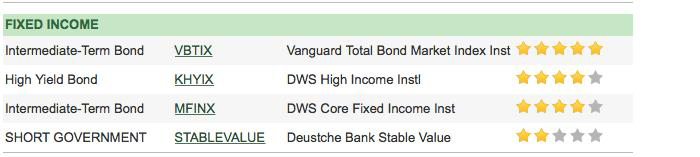
- IRAs can allow access to a relatively complete list of total return bond funds (see June 3, 2013: Total Return Bond Fund Portfolios For Major Brokerages on using these funds to construct a fixed-income portfolio) that are generally not available in a 401(k) plan. In fact, we have observed that many plans actually ignore or overlook the importance of having good choices of fixed-income funds. Most plans only feature a few fixed-income funds and leave investors not many choices to enhance the fixed-income side returns. For example, Figure 7 shows the fixed-income funds available in the Deutsche Bank Matched Savings Plan. In this case, a major investment bank has decided to only offer a bond market index fund, an active intermediate-term bond fund and a high-yield bond fund for all of its fixed-income lineup.
- IRAs in general have more asset class choices. If you choose a brokerage correctly, you can also choose funds with low expenses.
In general, we would suggest to first allocate your fixed-income portion as much as possible in an IRA if your 401(k) plan lacks good fixed-income funds (which is usually the case). Then try to leave the active or tactical portion as much as possible in IRAs, if the active or tactical portion uses index mutual funds or commission-free ETFs.
Often, you might have both strategic and tactical portfolios in your overall retirement investments. In this case, your strategic portfolio will have to be implemented in your 401(k) account(s).
Unfortunately, this suggestion seems to underutilize the good portfolio-level basket rebalance feature available in 401(k) plans, as the more active (tactical) portfolios would need this feature most. In this situation, investors just have to make the trade-off.
To summarize, even among retirement accounts, investors should try to consider how to allocate funds and assets by looking at the pros and cons in these types of accounts. From this discussion, one can see both discount brokerage-based IRAs and employer-sponsored [401(k)] accounts have weaknesses to avoid.
Summary
Choosing asset classes in your retirement investment portfolios is one of the most important steps. Exposure to both risk assets and fixed-income bonds is the key to constructing a balanced portfolio. Global assets can further increase diversification and even possibly boost returns. Investors should not underestimate the importance of fixed-income investing. A sound and active fixed-income strategy can enhance returns without incurring much risk.
Discussion
FREE REPORT

H Mercer from TX posted over 9 years ago:
John Zhong@MyPlanIQ from CA posted over 9 years ago:
John Zhong@MyPlanIQ from CA posted over 9 years ago:
You need to log in as a registered AAII user before commenting.
Log InCreate an account