

Wayne Thorp leads a class in AAII's new Essential Investing Video Course. Go to https://www.aaii.com/ves for more information and to subscribe.

Regular readers of Computerized Investing are undoubtedly aware of the 60 or so stock screens that AAII tracks on its website. These stock screens are based on quantitative rules applied to the universe of stocks in AAII’s Stock Investor Pro fundamental stock screening and research database program. There are several benefits of using a regimented fundamental stock screening approach to select stocks. First, it helps to remove emotion from the investment process. Second, it saves time, as with the click of a button you can instantaneously winnow down the investable stock universe from many thousands to, perhaps, only a dozen or two.
On the opposite end of the spectrum from fundamental analysis is technical analysis. This type of analysis focuses on price and volume behavior for an underlying security. Unlike fundamental analysis—which assumes that factors such as earnings and dividend growth, balance sheet strength and other fundamental elements impact a stock’s price—technical analysis is based on the premise that most, if not all, of the information regarding the underlying asset is captured in the price.
By analyzing trends in the price and volume over time, short-term investors and traders identify patterns and trends that they use to predict future price movements. Just as with fundamental stock screens, technicians develop “trading systems” to identify when to buy and sell stocks, exchange-traded funds (ETFs), or other securities. However, where fundamental screening focuses on elements such as ratios, multiples and growth rates, technical systems rely on “indicators” that are mathematical manipulations of price and volume data.
Do a Google search for “trading system” and you are bombarded with thousands of options, many offering seemingly spectacular performance results. However, if the performance of a trading system seems too good to be true, it probably is. It is very easy to optimize a trading system to fit the data of an underlying security over a defined period. Whether or not the system is successful outside of this backtesting period is a very different story. You need to read the fine print to see the factors underlying the results—including time period, estimated costs and optimization method, among others.
Furthermore, more and more online brokers are offering trading platforms for trading system development and testing as well as special commission structures for active traders.
While there are many trading systems that you can buy, you can just as easily develop, optimize and deploy your own trading system. This article is the first in a series discussing the steps required to build and test your own technical trading system.
What Is a Trading System?
While some may be intimidated by the notion of developing a “trading system,” the concept is actually rather straightforward. A trading system is simply a set of specific trading rules or parameters that determine the entry and exit points when trading a given security—stock, ETF, etc. These points, or signals, prompt the execution of a trade. Depending on the platform you are using, the entire process can be automated, right down to the system automatically placing the buy and sell trades directly with a broker.
Underlying any technical trading system is one or more technical indicators, and the movement or interaction of these indicators is what generates the trading signals. Again, an indicator is the mathematical manipulation of price or volume data, plotted on a chart. Perhaps the most basic example of a technical indicator is a simple moving average, which is the average of (usually) a security’s closing prices over a certain number of periods. So a 50-day simple moving average would illustrate the average closing price over the last 50 trading days.

Often, two or more technical indicators are combined to generate rules or signals that make up a trading system. For example, a basic moving average crossover system uses two moving averages—one short-term and one long-term—that generate the rules underlying the trading system. A buy signal would be generated when the short-term moving average crosses above the long-term average, while a sell signal would arise in the opposite case (when the short-term moving average crosses below the long-term average).
Figure 1 is an example of one such moving average crossover system. Here, we plotted five-day (short-term) and 20-day (long-term) moving averages for Google Inc.  (GOOG) for the six-month period ending November 22, 2013. The green buy arrows indicate when the five-day average (green dashed line) crossed above the 20-day average (solid red line) and the red sell arrows indicate when the five-day average crossed below the 20-day average.
Advantages
Following a technical trading system has advantages and disadvantages. Here are some reasons why technical trading systems are popular:
- They remove emotion from trading: Similar to fundamental stock screening, technical trading systems are intended to let the quant rules dictate what the trader does or doesn’t do. As a result, they remove emotion from the equation. Numerous behavioral finance studies have shown that investors and traders alike often make irrational decisions based on their emotions. By implementing and following a strictly mechanical trading system, traders are, in effect, taking the decision-making process out of their hands. By utilizing a trading system to its fullest potential and making it fully automated, we remove potential human inefficiencies and theoretically increase our profit potential.
- They can save time: After you’ve put in the leg work and developed, optimized and deployed your trading system (or purchased one from a third party), there isn’t much else for you to do, especially if the system is fully automated and all buy and sell trades are automatically routed through a broker. These days, trading systems are typically automated with computers so you just sit back and wait for the system to generate trading signals.
- Third-party providers can do the work for you: As we mentioned earlier, there are literally hundreds—if not thousands—of technical trading firms out there, each offering their own proprietary trading system that you can purchase and deploy for your own trading. Alternatively, you can pay a firm a fee to receive the signals generated by their proprietary trading systems. It pays to do your homework, however, as it is not uncommon for companies to report misleading or downright fraudulent performance figures.
Disadvantages
- Fraud is not uncommon: As just mentioned, perhaps one of the biggest drawbacks of a technical trading system is that it is very difficult to verify quoted performance results. Whereas a fundamental stock screening system may be generating a dozen or so passing companies at a given time, a technical trading system may be generating hundreds, if not thousands, of signals at a time. Therefore, results are reliant on the “basket” of securities being tested, the underlying assumptions (such as commissions, bid-ask spreads, long-only or long-short trading) and other factors. If the trading system is a “black box,” system, meaning it is proprietary, it is unlikely that the company will reveal the exact nature of the system, making verification of past performance impossible. As a result, some companies have been caught promoting trading systems using fraudulent performance data. Therefore, it is a good idea to do your homework regarding the company and its trading system before laying down any money. Be leery of companies that don’t offer a free trial, preventing you from testing the system yourself before buying in.
- Proprietary technical trading systems can be highly complex: Peter Lynch’s investing philosophy is applicable to technical trading systems as well—“invest in what you know.” Technical trading systems, especially proprietary systems, can be highly technical (pun intended) and complex. Just as with fundamental investing, a strong knowledge of technical analysis is imperative, as well as an understanding of the underlying criteria of a trading system. Learning about technical analysis takes time, as does any other type of investment analysis. Your level of familiarity with a given trading system will depend on whether you developed it yourself or how transparent the developer of the system is regarding the underlying parameters and assumptions of its system.
- Realistic assumptions must form the basis of any successful trading system: The assumptions you make will have a significant impact on the performance of the system over the backtesting period, as well as its success in real-world conditions. These assumptions can include transactions costs, which cover more than just commissions. There is also the difference between the price at which the signal is generated and the price at which the trade is executed; this is known as price slippage. In addition, time slippage denotes the time delay between when the signal is generated and when the trade is executed. Whether or not a trading system effectively handles slippage during the testing phase can have a significant impact on how closely its backtested results reflect real-world results.
- Developing, testing, optimizing and deploying a technical trading system takes time: Just as mutual funds and investment newsletters are so popular because few individual investors are able or willing to take the time to analyze individual stocks, so too are third-party technical trading systems so popular because few traders have the knowledge or time to develop their own systems. While there are plenty of software packages out there to help you backtest a strategy (refer to the comparison of technical analysis and charting software in this issue), you are only testing over historical data. You still need to paper trade a system going forward to judge its effectiveness. Furthermore, as we previously discussed, slippage may force you to “tweak” your trading system even after deploying it.
Picking a Market
For the sake of this series of articles, we will focus our attention on stocks and ETFs when discussing technical trading systems. These are the securities the majority of our readers feel most comfortable with and follow for their own investing. Furthermore, the sheer number of stocks and ETFs traded on U.S. exchanges makes them an attractive trading option. Within the equity market, however, there are some things to consider. Most important is liquidity. Some over-the-counter (OTC) and pink sheet issues lack sufficient liquidity, making them highly volatile when trying to buy or sell them. Furthermore, many of these issues trade with high bid-ask spreads, which significantly add to the cost of trading in them. Commissions can also have a significant impact on your performance when actively trading stocks and ETFs. This is why many brokerages offer “power” accounts for high-volume traders with lower commissions per trade.
The foreign exchange, or forex, market is also popular among technical traders. The primary appeal is the fact that it is the largest, most liquid trading market in the world. Also, unlike the equity markets, there are no commissions in the forex market. Instead, the transaction “cost” of trading foreign exchange is the bid-ask spread. This makes the forex market very attractive to high-volume traders.
Lastly, there is futures trading for equities, forex and commodities. The high amount of leverage typically used in the futures market is a main attraction for traders, along with increased liquidity and volatility. As a result, trading in the futures market is generally reserved for expert traders.
Types of Trading Systems
The last part of our discussion for this article deals with the type of trading systems you can use for trading equities, ETFs, forex or commodities. The two primary types of systems you will run across are trend-following or counter-trend systems.
Trend-Following Systems
The trend-following system is the most common method of trading. This type of system reacts to a significant price movement and buys in that direction. The rationale for this type of system is the hope that the trend will continue in the same direction.
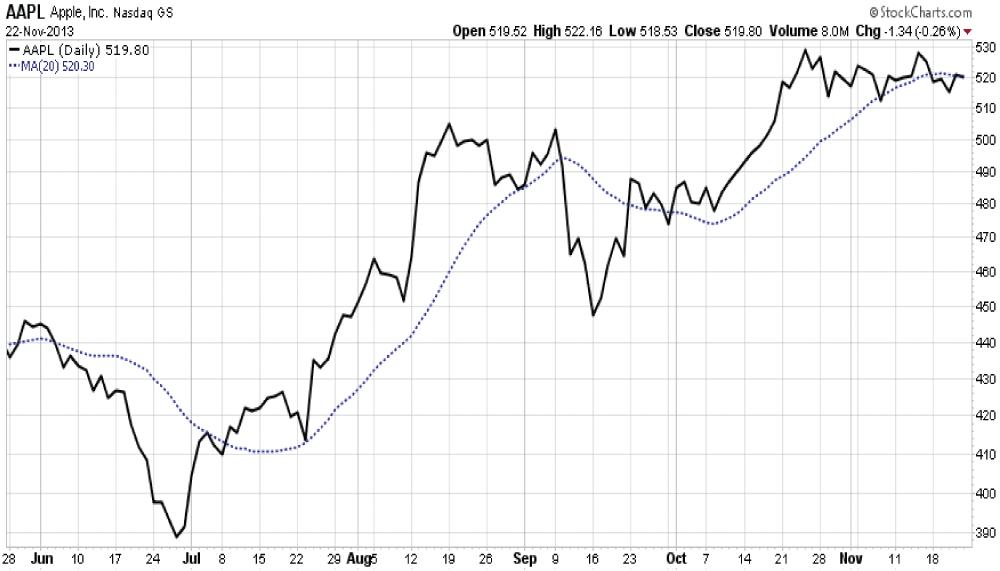
Probably the most common type of trend-following system uses moving averages. Moving averages are the very essence of a trend, offering a smoothed trend in price over a specified time period. Figure 2 offers a simplified moving average crossover system as compared with the one illustrated in Figure 1. In this example, we plot the closing price of Apple Inc. (AAPL) over the last six months along with a 20-day simple moving average (blue dotted line). Here, we are looking for crossovers between Apple’s share price and the 20-day moving average. A new trend is established when the price moves above or below the historical price average.
Another type of trend-following system is the breakout system. Similar to that of moving average systems, breakout systems are based on the notion that once a new high or low has been established the price will more than likely continue in the direction of the breakout. Figure 3 plots the closing price for AAPL over the last six months along with a Bollinger band overlay. Bollinger bands show the average of the high and low prices, with breakouts occurring when the price hits the edges of the bands. The upper blue band is the average of the high price over the last 20 days, while the lower band is the average low price over the last 20 days. The dotted blue line running between the two outer bands is the simple moving average of the closing price over the last 20 days.

Trend-following systems have some drawbacks. Chief among them are their lagging nature. Since they are following the trend, they are always lagging it. Therefore, they will never predict the exact top or bottom of a trend. Depending on how rapidly and severely the prevailing trend changes, this may result in significant profit losses. Furthermore, trend-following systems are prone to whipsaws, which occur when the moving average generates a false signal. Whipsaws can severely hurt a system’s profitability without effective stop-loss and risk management techniques. Lastly, trend-following systems, as their name suggests, are most successful in markets that are trending. If the underlying security were to enter a prolonged period of sideways or trendless trading, these systems will undoubtedly generate many short-term or even false signals (whipsaws).
Counter-Trend Systems
Counter-trend systems look to buy at the lowest low and sell at the highest high. Unlike trend-following systems, however, counter-trend systems are not self-correcting. When we think the indicator has reached an extreme high or low, signaling a possible trend reversal, it could continue hitting even higher highs or lower lows.
With a counter-trend system, traders look buy when momentum in one direction begins to fall off. Often this is calculated with oscillators such as stochastics or relative strength, with signals generated when the oscillator falls below a certain point. Irrespective of the type of counter-trend system you are using, the objective is still the same: buy low and sell high.
Just as with trend-following systems, counter-trend systems have their disadvantages. The point at which momentum begins to fade will vary depending on the underlying security and historical extremes. Perhaps most importantly, as we mentioned earlier, since counter-trend systems are not self-correcting, there is unlimited downside potential (there is no set time to exit positions).
Looking Forward
With this basic overview of technical trading systems, the types of markets in which they can be used, and the common types of trading systems, we have the laid the foundation for walking you through how to develop, test and deploy your own technical trading system. In the next issue of Computerized Investing, we will discuss the issues and considerations that go into designing and constructing a technical trading system.
Discussion
FREE REPORT

Jerry Mcmahan from OK posted over 12 years ago:
Kermit Prather from FL posted over 12 years ago:
MarkW from MD posted over 12 years ago:
James Hayes from CO posted over 12 years ago:
Roger Shantz from WA posted over 12 years ago:
Vernon Roberts from FL posted over 12 years ago:
Wayne Thorp from IL posted over 12 years ago:
Clement Moore from PA posted over 11 years ago:
Wayne Thorp from IL posted over 11 years ago:
You need to log in as a registered AAII user before commenting.
Log InCreate an account