


Free
App provides a multitude of charting, watchlist and trading tools for traders on the go. Eric Barden of Technician explains the app’s features.
ChartIQ, recognizing a need for charting tools for traders on the go, built Technician using its signature HTML platform in 2015. Technician was made to seamlessly operate and sync across mobile, tablet, and desktop devices to maximize flexibility. The redesigned application was launched in April 2016 and includes an iOS version, Android version and Web application.
Conducting Technical Analysis Within Charts via Mobile
Technician offers a wide range of studies and indicators, over 100 in total, to all of its users. The process of adding studies to charts is a simple process with only a few clicks.
After downloading the application, you have to sign in or create a free account. The Technician application has six different tabs: watchlist, chart, market, calendar, settings and help.
Users can create watchlists composed of stocks as well as exchange-traded funds (ETFs). The Technician application’s data is provided by Xignite. For more information on exchanges and indexes offered, click here.
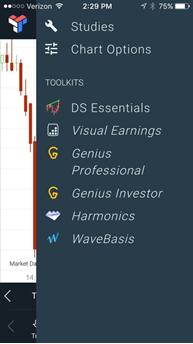
The Chart page allows you to select a holding to chart from one of your watchlists. Once a chart is brought up, clicking the More button in the lower right-hand corner of the screen brings up another menu. The More menu allows users to create studies, change their chart options or use toolkits. The toolkit options include DS Essentials, Visual Earnings, Genius Professional, Genius Investor, Harmonics and Wave Basis. Toolkits cost between $15 and $180 a month.
After selecting Studies, you can then select any study you would like to add to your chart by simply tapping the study’s name. Once done, hit the back button and the chart will appear with the studies included, either as an overlay, underlay or below in a studies box.
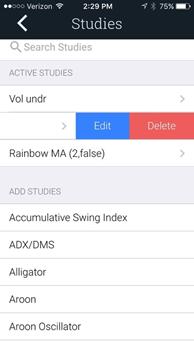
To edit your studies, go back into the Studies menu by tapping the study name and swiping left on the study, and then tapping the Edit button. Edits include changing colors, periodicity, fields, etc., based upon the unique features of the study.
To delete a study, go back into the Studies menu and swipe to the left to reveal the Delete button, which can be tapped to clear the study off the chart.
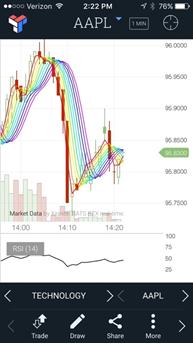
The bottom of the Chart page also includes options to trade, draw and share.
The Market tab shows the daily performance of the Dow Jones industrial average, S&P 500 index and the NASDAQ 100, accompanied by a small chart that shows performance over the last three months. Under the market performance numbers is a feed of market headlines followed by upcoming economic events and announcements and, lastly, current interest rates. Market data is provided by Xignite.
The Calendar tab shows an enlarged version of the upcoming economic events and announcements table. Users can filter between upcoming events over the next day, week or month regarding bonds, business surveys, central banks, consumer surveys, employment, growth, holidays, housing, inflation and miscellaneous.
Trading From the Chart via Desktop
With Technician, not only can traders easily identify opportunities through robust technical analysis capabilities, but they can also quickly capitalize on their findings by executing trades directly from their charts. Here is how to trade on the desktop version of Technician. Trade can be placed on the mobile app as well.
Connecting a Brokerage
To begin, traders need to click on the green Trade button on the right side of the screen. Traders who have not connected a Technician-affiliated brokerage to their Technician account see a screen informing them of available brokerages and the process for opening and connecting an account.
Traders who already have an account with a Technician-affiliated brokerage can tap “I already have an account” in the Trade panel. This takes them to their broker to log in before returning to Technician to complete the connection.
Once this initial connection is created between the broker and Technician, subsequent logins to Technician will simply require clicking on the Connect button in the Trade window and authenticating the account with the user’s brokerage credentials.
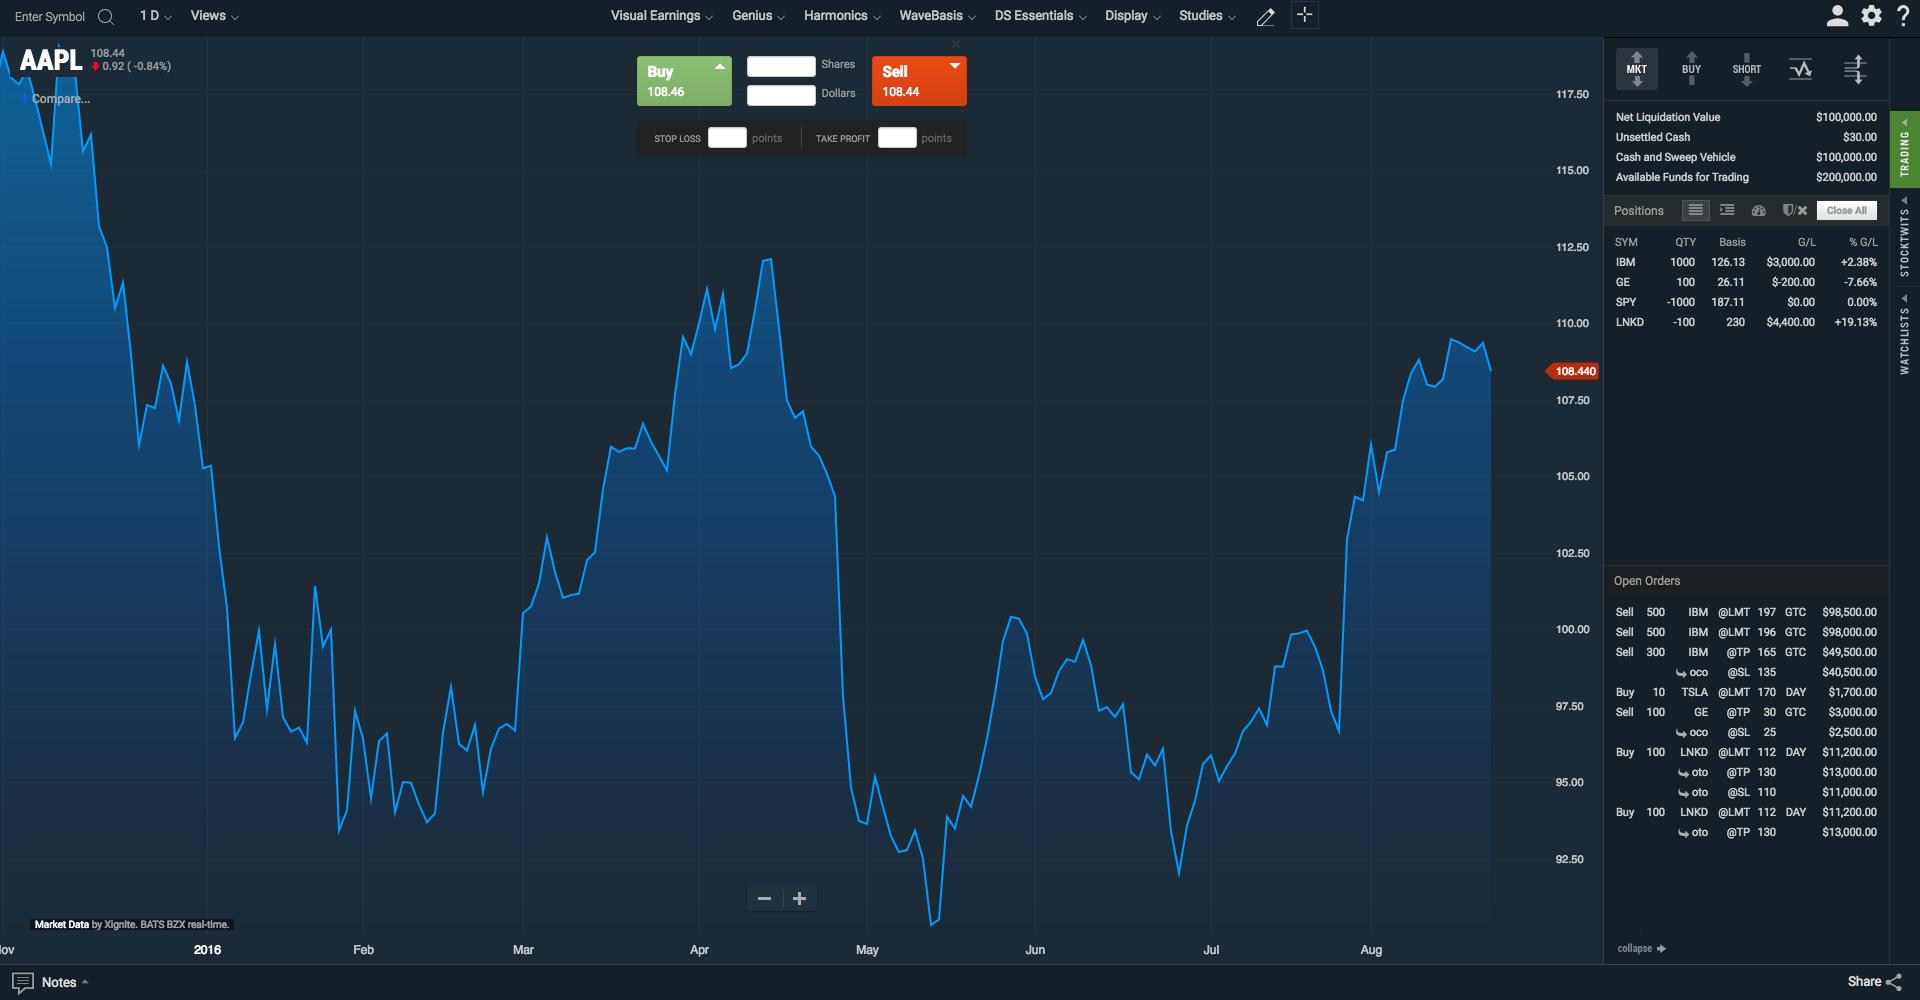
Once you’ve connected to your brokerage account, you have access to Technician’s easy-to-use trading tools. Clicking Trade on the right sidebar pulls up an informative panel featuring overall account information at the top.
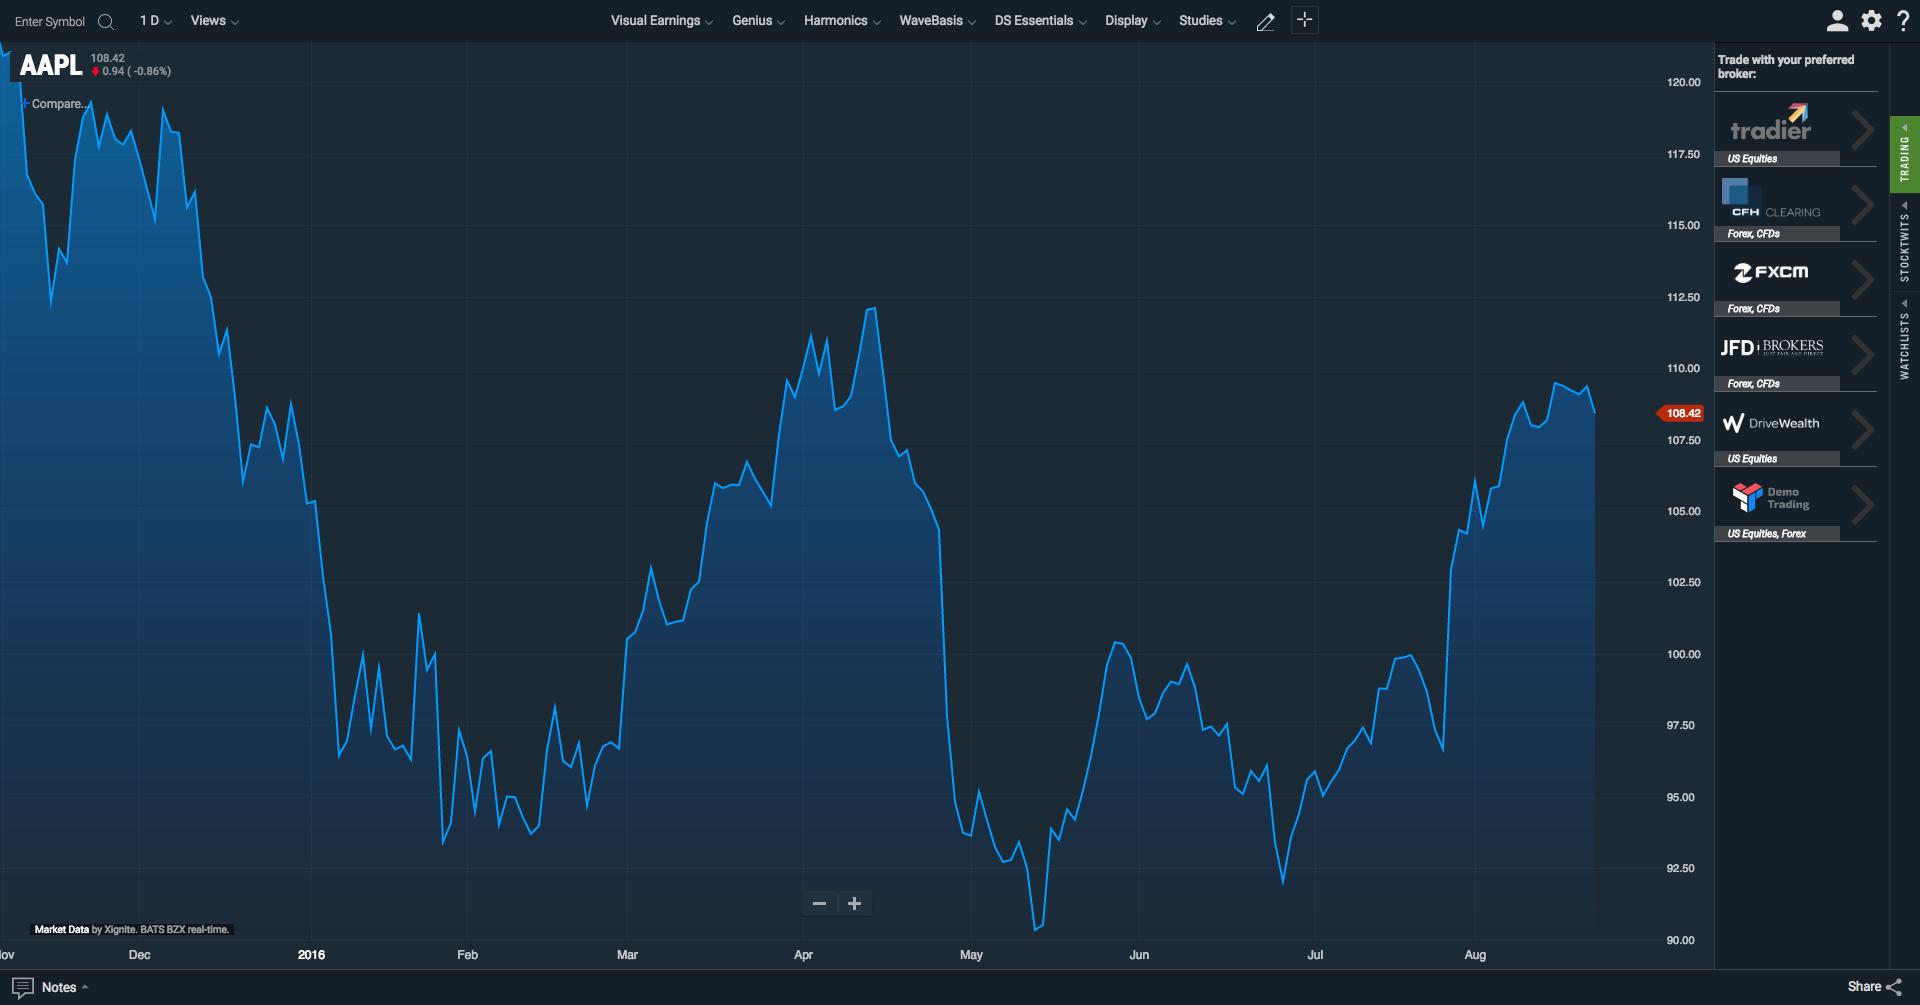
You will also see your current positions listed by symbol with quantity, amount, daily gains and losses, and cumulative gains and losses. At the bottom of the Trade window, you see information about your open orders. Clicking the Condense button on the bottom of the Trade window allows more room for charting displays while still showing relevant trading information. Clicking Expand reveals the larger view.
Placing a Trade
To place a market order, click the MKT button at the top of the Trade panel. This pulls up a trade display on the chart in which to enter the number of shares you wish to trade. The Buy and Sell buttons will be populated with the bid-ask spread. To place an order, click the appropriate action button and then click submit in the resulting confirmation popup.
To go long, select the Buy button from the top of the Trade panel. The trade display appears for entering the number of shares. To choose the price, grab the price marker on the y-axis and pull it up or down. The dollar amount recalculates as you move the price marker. When you’ve settled on the right price, click the green Buy button. Clicking Submit on the resulting confirmation popup completes the order.
To go short, click the Short button at the top of the Trade window. This pull up a trade display on the chart allowing for entering the number of shares. The price can be adjusted by clicking and dragging the price marker on the y-axis. Clicking the red Short button brings up a confirmation window, and clicking Submit completes the order.
Open Orders
After type of order is submitted, a green (buy) or red (sell) marker appears on the chart until the order is executed. Clicking on this marker pulls up a window allowing you to edit and replace the order. You can make adjustments by typing into the textboxes or by grabbing and sliding the marker along the price axis. When you find the right new price, click the Replace button. Alternatively, remove the order by clicking “Cancel This Order.”
Access any open orders by clicking the appropriate symbol in the Open Orders section at the bottom of the Trade window.
Current Positions
To view any current positions, click on the appropriate symbol in the Positions section of the Trade window.
If you open a chart of a current position you hold, choose to buy or sell by clicking the buttons at the top of the Trade panel. This pulls up the familiar trade display on the chart. Pull on the price marker to adjust the buy or sell price, and the display will show any calculated gains or losses at the various price points.
Additional Features Included Within Technician
Below is a list of additional features the Technician platform/application offers:
- Ability to create and manage multiple watchlists.
- Access real-time data for almost 90 different exchanges and index groups for U.S. equities and forex pairs from around the world.
- Share charts via text, email, Slack, Twitter, Facebook and more.
- Create drawings on charts with more than 15 different drawing tools.
- Customize charts with various chart options such as light or dark themes, changing between 13 different chart styles, and creating customized intervals.
- Access to company details, fundamental overviews, news, filings, financials, and insider trading information.
- Free expert analysis toolkit trials before purchase in Technician’s Marketplace, including DS Essentials, Visual Earnings by Estimize, Harmonic Pattern Collection, WaveBasis Elliott Wave Power Tools and Genius.
- Daily market news, commentary and Weekly Roundup emails.
Technical Analysis Education and Market Insight
When it comes to technical analysis and trading education, Technician has a team of experts to assist traders at any level of experience, beginning with its resident market pro Michael Kahn. Michael has been working with technical analysis for over 30 years. In those years, he has written three books, including “Technical Analysis Plain and Simple: Charting the Markets in Your Language” (Third Edition, FT Press, 2010) and “A Beginner’s Guide to Charting Financial Markets” (Harriman House, 2008). Michael also writes the Getting Technical column for Barron’s Online twice a week.
Pricing
Technician is free for all devices. It can be downloaded via Apple App Store, Google Play, or used on a desktop via app.technicianapp.com. Toolkits range from $15 to $180 a month.
Technical Support
If users have any issues with their app or questions about any features, Technician has a dedicated support and development team that will assist you with any issue. There is also a comprehensive FAQ page on the website that can address many of the common problems users experience. Traders can email support@technicianapp.com for help or fill out a Support Request form.
Technician by ChartIQ for iOS and Android
Free
Discussion
FREE REPORT

No comments have been added yet. Add your thoughts to the discussion!
You need to log in as a registered AAII user before commenting.
Log InCreate an account