


Related
Trading Strategies
Viewing ETFs as being vanilla, active, strategic or idiosyncratic makes it easier to understand their strategies and how they differ.

Elisabeth Kashner is the director of ETF research for FactSet. We spoke about misunderstood complexity and differences among seemingly similar-sounding exchange-traded funds, as well as what investors should consider when looking at a particular ETF.
—Charles Rotblut, CFA
Charles Rotblut (CR): You described the moniker “smart beta” as being too vague of a description and instead argue for grouping exchange-traded funds ETFs into one of four categories. Could you explain your logic?
Elisabeth Kashner (EK): There’s a case to be made that since smart beta is loosely defined in the industry that you should simply go to each issuer and ask them “What are your smart beta funds?” A lot of issuers will have a list, and they will say “they are these.”
The problem is that you won’t get consistency of methodology in terms of how the fund is actually put together and how you can expect it to behave. One issuer is going to classify their value funds in smart beta and another is not. So, I cast that experiment aside.
Simply for the purposes of classification, I decided to work from the bottom up and use the index methodology documentation to gain a very detailed understanding of exactly how the fund is put together. When you do that long enough, you come to see some patterns. Based on the patterns that we at FactSet have observed and think are sort of indicative of what’s going on in the industry, we’ve largely split the universe into four groups. The first two are very easy to understand, but the other two require a little thought.
The easiest to understand are what we call the vanilla funds. The vanilla funds have the aim of replicating an opportunity set. It could be a very broad opportunity set, such as all global equities excluding the U.S. It could be a very narrow opportunity set: short-term, high-yield U.S. dollar bonds. Whatever the set is, a vanilla fund will try to capture it as completely as possible. It’ll do that by trying to own everything and to own it in proportion to how the market owns it. These are most of the giant ETFs that top the asset charts, like SPDR S&P 500 (SPY), iShares MSCI EAFE (EFA), iShares MSCI Emerging Markets (EEM) and iShares Core U.S. Aggregate Bond (AGG).
The other easy group to understand is the small but growing number of ETFs that actually feature active management. The most prominent of these is the SPDR DoubleLine Total Return Tactical (TOTL), managed by Jeffrey Gundlach. It’s sort of an unconstrained go-anywhere bond fund. People who buy that are betting on the continued skills of Gundlach and his team to provide what they hope would be a superior pattern of returns.
When you take out the vanilla funds and the active funds, you still have almost 50% of the total number of ETFs that are neither clearly active nor clearly vanilla. What characterizes these other two groups is that the securities are either selected or weighted—or both—by some manner that is not aiming to simply replicate the opportunity set.
In order to break these two funds into two different strategy groups, you have to take a look at what differentiates the ways in which they slice and dice the investment universe. What makes the most sense to us here at FactSet is to ask “What is the thought process behind the security selection, the weighting [the proportionate allocation to the security]or both that allows an indexer to arrive at the methodology that they do?” What we’ve found is that you can paraphrase them as having a master’s in finance and not having a master’s in finance.
The master’s in finance group would be indexes that use principles of academically established research to select securities, weight securities or both. They’re based on an analysis of the pattern of returns of securities. A good example is a momentum fund. You’re looking for the changes in price in the security from one day to another compared to the changes in price of a different security. Another example is a low volatility fund. Low volatility seeks out securities with less variability in their day-to-day pricing than the others have. So, they are using the price series to make some determinations. You can also have a multifactor approach that does both and takes from two schools of thought, if you will.
All of those are things that would be very recognizable to you if you sat in a financial analysis classroom long enough. We call these funds “strategic” because they have a strategy that has been explored in the academic literature.
Then there are the funds that skipped school, if you will. These are funds that have some other methodology in terms of how they’re put together. A good example would be the ESG [environmental, social and governance]funds. The ESG funds are put together by excluding sinful stocks or by including virtuous stocks. There’s a moral bent.
The Dow Jones industrial average is another example. This average consists of 30 stocks that are selected by a committee. The committee chooses whatever they want. Furthermore, each stock is equal-share weighted: The weighting for each Dow component is determined by its share price regardless whether it’s priced at $10 a share or $200 a share.
We also can’t leave out indexes that are put together to promote an exchange. PowerShares QQQ (QQQ) consists only of securities that are listed on the Nasdaq. There is no philosophy of financial analysis I know of that says that the exchange where you list your security really makes a difference to anything in terms of the company performance.
We call the funds that are constructed with a non-academic benchmark “idiosyncratic.”
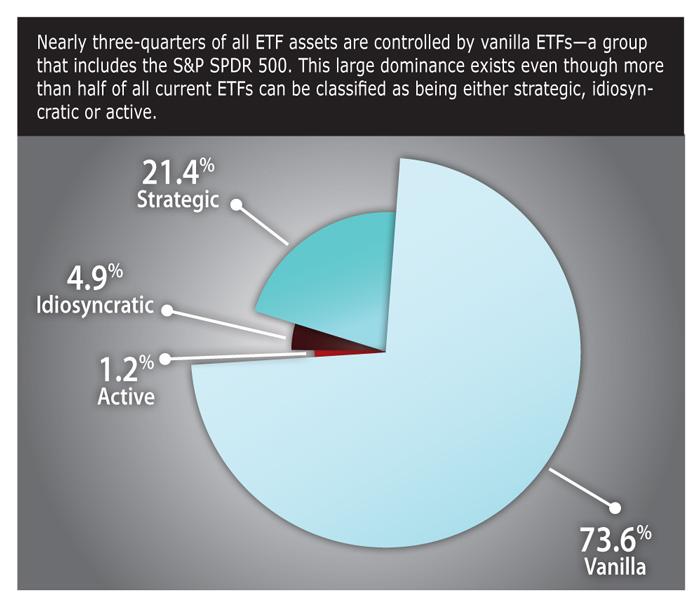
Just to give you a little bit of color on the respective size of the four groups, if you just take the whole landscape of ETFs and you count how many there are, a little bit over 40% are vanilla. A little bit less by count than vanilla are strategic. The actives are about 9% by count and the idiosyncratics are about 10%.
That’s not true of the assets. Seventy-three percent of the assets are in the vanilla funds group [Figure 1]. Twenty-one percent are in the strategic group. Just under 5% are in the idiosyncratic group, and that number’s been shrinking. Only 1.2% of the assets is in the actively managed funds group. So, you get a lot of noise in the actively managed space, but so far not a ton of money.
In terms of the plain-vanilla funds made available on a commission-free basis by online brokers, what should an investor consider when they’re looking at these ETFs?
I’m going to tell you what they should be considering in an easy to remember order, but the order that I’m telling you does not reflect the importance. It’s almost backward.
You can use three letters: E, T and F.
“E” is for efficiency. If the fund promises to track an index, investors should ask “How well does it actually deliver?” Many people turn to the expense ratio as a sort of first cut measure of efficiency. That’s not a bad first cut, but you shouldn’t stop there. There’s plenty of other metrics that you should look at.
“T” is for tradability. Unlike mutual fund investors, ETF investors have to go to the exchanges and buy or sell their funds. You want to be able to do that without too much slippage. [Slippage occurs when the price a trade was executed at is less than, if you’re selling, or more than, if you’re buying, expected.] Obviously the longer your time horizon, the less you care about a little slippage, but if you have a short-term horizon, your trading costs are going to matter significantly. There’s a lot of different things you’re going to want to look at: Spreads are a good one, as are median and average daily dollar volumes.
We can talk a lot more about what the primary considerations would be here but, frankly, when efficiency goes wrong, it’s going to go wrong at somewhere between 20 to 100 basis points [0.20% to 1.00%] a year. So, your performance will lag the index in that range. Are there cases that are worse? Absolutely. There are even cases that are better, but that’s the scale that you should think of it on.
When things go wrong on the trading floor, most of the time that’s measured in basis points—maybe 10 basis points [0.10%], maybe 20 [0.20%]. It’s usually a pretty small amount of slippage.
Now we come to “F,” fit. Fit is going to determine your pattern of returns far more than efficiency or tradability. Just as a small example, a month or two ago I looked at the spread in returns of all of the funds in the U.S. biotechnology segment. The difference between the highest-performing and the lowest-performing funds was almost 50%. Not 50 basis points [0.50%], 50% on a one-year basis between the best- and the worst-performing U.S. biotech ETFs.
That’s a big difference.
Let that sink in for a minute. Fifty percent, right? My start and end dates happen to be May 6 of 2016 and 2017, respectively. The fund with the best one-year return was BioShares Biotechnology Products (BBP) with a gain of 49.2%. The worst-performing ETF was Loncar Cancer Immunotherapy (CNCR), with a gain of 3.1%.
So, fit has to do with exactly what we were talking about earlier: How is your ETF put together? How’s the index put together? What are you getting exposure to?
You asked specifically about the vanilla funds, and I would say that there’s probably greater misunderstanding of the vanilla funds than anybody imagines. That’s because if you see a label such as “large-cap” or “mid-cap,” you think that one mid-cap security is approximately equal to another mid-cap one, and that couldn’t be further from the truth. The major indexers do not agree on where to draw the line between a large- and a mid-cap stock or between a mid- and a small-cap stock. They also do not agree on what constitutes a value stock and what constitutes a growth stock. Because of this, there’s grand confusion in the industry. You really have to do your homework in terms of understanding what actually goes into your index.
A case in point—and I do love to pick on this one—is the S&P 500. I would bet if you polled your members, more than half would say that the S&P 500 represents the 500 largest stocks by market capitalization in the U.S. That’s simply not true. The S&P 500 has a number of criteria. First, any stock that they choose must have reported a net profit in the trailing 12 months. Second, like the Dow Jones industrial average, it’s designed by a committee. The end result is that if you took something like the Russell 1000, which really is quite simply the top 1,000 U.S. stocks by market cap, and you compared it to the S&P 500, you would find that the smallest stock in the S&P 500 ranks somewhere between number 900 and number 1,000 in the Russell 1000. So, the S&P 500 excludes almost as many securities as it includes.
Beyond looking at how well the fund tracks the index, you’re encouraging investors to look at the index. (The index’s methodology can be found by typing the index’s name into a search engine such as Google.)
Absolutely. And I would say that if you only have time for one of those (E, T or F), understand the economic exposure of the fund. Understand how the underlying index is put together and how it’s similar to or different from other options in that space. Not that I think it’s not important to pay attention to an ETF’s efficiency and tradability—obviously, I do. If, however, we talk in terms of scale of what your ultimate pattern of returns is going to be, there’s no question that fit is by far the most deterministic. It’s not only in areas like biotech. We see this kind of dispersion of returns even among U.S. utilities, which you would think would be as boring. We don’t necessarily see a 45% to 50% divergence per year, but we might see 10%.
That’s still quite a bit.
It is. Now, those comments certainly will apply to all strategies; they’re not limited to vanilla strategies. What I would say is that if vanilla is that much more complicated than people think it is, then imagine how much more due diligence you have to do if you’re going to stray from vanilla. Because I’ve been describing indexes that have a relatively simple construction to them. The strategic funds generally start with something vanilla and then add onto it.
My impression is that there’s been a growth of indexes for these ETFs to track. That makes it even more challenging.
If you had my inbox, you’d see announcements for new ones all the time.
Let’s move onto strategic funds. You talked about them having a master’s in finance. It seems like many of those funds are trying to apply academic research to subsets of stocks based on their market capitalization. This is in contrast to academics’ common practice of looking at the broader universe of exchange-listed stocks. From that standpoint, it seems that ETFs really aren’t giving you the full benefit of the research, but more of a modified version of it.
I think there’s a couple of things to tease out here. One of them is what’s deliberate, and the other is what’s a compromise to the art of the possible.
What’s deliberate is that they’re taking a different approach. They’re deliberately selecting X and deselecting Y, and I would note that once you deselect something, its weight in the portfolio is zero. Then they have a weighting scheme based on how much is allocated to a tier of securities, on an algorithmic score or on an optimizer. There can be a lot of complexities there.
Then there’s the part that’s sort of what I call the art of the possible. Most of the academic research is done using the Center for Research in Security Prices (CRSP) database. This database is considered by the industry to be the most complete database of U.S. securities. Academic research uses long/short portfolios with little regard given to real-world constraints. Most ETFs are built using long positions only because of the difficulty in shorting stocks of small and, particularly, very small companies in a real-world environment. This leads to a difference in how the ETFs actually perform versus what returns research suggests is possible. [A long/short portfolio buys one set of securities and short sells another set of security.]
It gets worse because not only are academics investigating the art of the possible, but at the same time the cat’s out of the bag. Once their findings have been published, the research is widely available. Then, the studies are packaged up into an ETF, and they’re really available to everybody. When you have people piling into a strategy, it’s an open question whether it will continue to work. I know Vanguard’s done quite a lot of work comparing backtests to the reality, and their findings haven’t been too flattering.
I remember at the CFA Institute’s Annual Conference you also said there is data on investor returns showing that those who trade strategic ETFs are actually lagging the performance of the funds themselves.
Yes, and I will point out that this is true in the vanilla funds as well. It’s simply more pronounced in the strategic funds.
To really benefit from a strategic strategy—say momentum or value—an investor has to have a long time horizon and a willingness to stick with the strategy. With the strategic funds, are you seeing a pattern of the money flowing to what seems to be working at any given moment?
To put it in very technical terms, in every case where you have the dollar-weighted returns underperforming the time-weighted returns, by definition you have investors buying high and selling low. [Time-weighted returns measure performance from one date to another; dollar-weighted returns also consider the inflows and outflows of investor dollars.] In general, people haven’t gotten the hang of it. The more newfangled the strategy is, the harder it is to use.
People have pretty much figured out how to use dividend funds, but they have not figured out how to use low-volatility funds or momentum funds (as can be seen in Table 1). We can hope that people get better at acting in their own self-interest. However, the evidence to date is not encouraging.
Table 1. Investors Are Mistiming Purchases and Sales of Strategic ETFs
| Analysis of dollar-weighted returns, which consider the inflows and outflows of investor dollars in addition to the performance of the fund over a period of time, shows that timing decisions made by investors are causing them to underperform the very strategic ETFs they are investing in. | |
| Strategy | Dollar-Weighted vs. Time-Weighted Returns |
|---|---|
| Buy-write | 0.63% |
| Dividends | -0.76% |
| Vanilla | -0.82% |
| Growth | -1.03% |
| Value | -1.23% |
| Fundamental | -1.49% |
| Multifactor | -2.82% |
| Low Volatility | -3.00% |
| Volatility Hedged | -4.47% |
| Momentum | -7.90% |
| High Beta | -13.14% |
| Source: FactSet. Returns are for the period of March 31, 2012, through March 31, 2017. | |
I recall you describing the strategic fund category as becoming overcrowded, with the new ideas being more and more esoteric.
Well, that’s not just with the strategic funds, it’s frankly industry-wide. There are more than 2,000 funds trading as we speak, but by next week, the number will be different. The field is growing both in terms of assets under management and in terms of the number of funds.
It’s crowded. It’s really, really crowded. It is difficult to break into the vanilla space because you’ve got funds in there that are charging three or four basis-point [0.03% or 0.04%] expense ratios.
There’s not a lot of margin in that, and so people who want to break into the industry or want to expand their footprint are doing everything they can to differentiate themselves. I think where the disconnect really comes in is that the “my fund is different” story is not as compelling as the “my fund is better” story. That may turn out to be true on a statistical basis, but on a risk-adjusted basis, it’s turned out not to be true. Does that mean that I can say with certainty in advance that your new complex strategy definitely won’t be better? No, but I know what the odds are.
Switching to idiosyncratic funds, the ESG funds are somewhat easy to pick among if you have a certain cause you’re interested in, but some of the other funds in this group are more complicated. I don’t think most people realize that the PowerShares QQQ ETF (QQQ), which tracks the Nasdaq 100 index, uses a heavily adjusted weighting strategy because of Apple’s (AAPL) large market capitalization. Could you briefly talk about this ETF to show how some idiosyncratic funds are truly unique in terms of how they’re weighted?
Sure. Basically, if the Nasdaq 100 was market-cap-weighted, it would violate the RIC (regulated investment company) requirements. In order to be a diversified open-ended mutual fund, which most ETFs are, you need to satisfy certain diversification requirements.
The 25/50 rule matters here. The rule means you can have no position that weighs more than 25% of the portfolio’s total allocation, and the combined weight of the five largest holdings can’t be more than 50%. Apple would break that. So, what happens is that PowerShares QQQ caps the largest weight at 25%. Since this will result in having extra weight to redistribute, the managers draw a line among the remaining constituents. Anything that’s weighted below 1% will have its weighting proportionally bumped until it hits 1%, and then they’ll continue to proportionally bump up until they’ve run out of proportional holdings.
What happens is that you get a capped, but very heavy, market capitalization weighting at the top. Then, in the middle or the lower middle, you get this long tier of equal-weighted securities weighted at 1% each and then you get the teeny tiny dribs and drabs. In between the 1% holdings and the capped holdings, you do get market-cap weighting, but it’s pretty bizarre. It’s also unclear what triggers the index to be rebalanced. There are not a lot of guidelines.
It sounds like this really emphasizes the need to spend the time looking at the index construction that these ETFs are following instead of just relying on the name only.
That’s right. That’s probably the biggest mistake that investors make. Frankly, it’s not just individual investors who make this mistake, but investors of all stripes. They take a look at the ETF name, they think they know what it does and they hit the “buy” button. It would be nice if it were that simple.
For the active group, it seems like the big hurdle, particularly on the stock side, has been transparency. Do you expect this to continue without some change in the regulations?
What I can tell you sort of off the top is that there actually are plenty of actively managed ETFs. Most of them have very few assets in them. But there are clearly enough asset managers who don’t consider having to disclose their portfolio in full on a daily basis as a barrier. Are there more who are holding back? Yes, there are more who are holding back.
We already have some pretty big names in the active space: Janus, Franklin Templeton, Legg Mason, JPMorgan, Natixis, PIMCO and Principal. These are household names that your members are going to recognize.
Listen to bonus audio below of Elisabeth’s guidance for building a portfolio of ETFs and the biggest lesson she’s learned over the course of her career.
Trading Strategies

Mutual Funds
Exchange-Traded Funds

Bill Lawlor from PA posted over 9 years ago:
Barry Portugal from FL posted over 9 years ago:
Doug from NY posted over 9 years ago:
Larry Reddig from OH posted over 8 years ago:
Gerald Cooper from NV posted over 7 years ago:
You need to log in as a registered AAII user before commenting.
Log InCreate an account