


Related

Portfolio Strategies
A strategy for combining global exposure, value and momentum, and both buy-and-hold and trend-following into a single portfolio.
by Mebane Faber | May 2017

The Trinity Portfolio is named for the portfolio’s three core elements: 1) assets diversified across a global investment set, 2) tilts toward investments exhibiting value and momentum traits, and 3) exposure to trend-following.
If you find any of these terms unfamiliar, don’t worry—each are detailed here. At this point, I present them more as a set of guideposts.
You see, in addition to being the foundational elements of the Trinity Portfolio, these three pieces also provide us the sequence to follow when constructing the portfolio—three chronological “steps,” if you will.
We follow this three-step roadmap as I introduce Trinity. We analyze the effect of each step on our portfolio, considering its impact on returns, volatility, as well as a few other metrics. This enables you to see the exact engineering behind the final result.
Let’s say you set out to design a portfolio, knowing everything we know today about investing. How would a logical, evidence-based investor construct such a portfolio?
First, you would start out with the basics: U.S. stocks and U.S. bonds. Stocks have dominated bonds 9.9% to 5.3% between 1927 and 2015. While stocks experienced nearly double the annual returns of bonds, they were not without risk. They have suffered numerous declines of 40% to 50%, on top of the massive drawdown (decrease in portfolio value) of over 80% during the Great Depression.
While stocks do suffer from sharp price declines, bonds usually suffer from the slower erosion of inflation. And while stocks outperform bonds over the long term, there have been periods of 20 years (1929–1949) and even 40 years (1969–2009) when stocks underperformed bonds.
Because different economic environments affect stocks and bonds in various ways, and since we cannot predict what the future will hold, it makes sense to allocate to both types of investments rather than just one. In other words, we diversify our portfolios.
This basic portfolio comes with an obvious problem: What if one of those two assets underperforms? What if both assets do poorly? Despite having lower volatility than just a stock portfolio alone, the 60% stock/40% bond (60/40) portfolio still had a whopping 60% drawdown. Given this, it’s clear that while the U.S. 60/40 portfolio is a fine starting point, it’s hardly where we want to end up. So what’s our next step?
Simple: Go global.
Expanding our portfolio to include global investments slightly reduces our returns, but in exchange we receive lower volatility and drawdowns. This results in a near-identical Sharpe ratio. (The Sharpe ratio is a measure of risk-adjusted returns.)
Though it surprises some investors, U.S. stock performance versus international stock performance has historically been a coin flip, with one outperforming or underperforming the other about 50% of the time. That doesn’t mean that both U.S. and international stocks cannot go through stretches of outperformance.
The more important takeaway is that by going global, we’ve protected ourselves from overconcentration in just one country (home country bias). We’ve also reduced our portfolio’s volatility and drawdown numbers. This has historically cost us a small bit of return, but that’s fine. At this point, we’ve been playing defense. Offense will come later.
If we want to squeeze every bit of return relative to the degree of risk we’re willing to accept, we need to add other, non-correlated assets. So we next add a category described as real assets. For our purposes in this article, “real assets” has a broad definition. We’re adding commodities, real estate (REITs) and gold. (Some also prefer the label “hard assets,” but I will stick with real assets here.)
The exact allocation we’re using is shown in Table 1, and comes from my book “Global Asset Allocation” (Mebane Faber, 2015). This allocation resembles something called “the global market portfolio” (or Global Asset Allocation portfolio). In essence, it’s simply the portfolio you would own were you to wrap all global investments into one composite portfolio. Adding real assets increases returns from the global 60/40 portfolio and decreases volatility and drawdowns. We’ve had our cake and eaten it too.
Table 1. Global Asset Allocation Portfolio
| Asset | Allocation (%) |
|---|---|
| U.S. stocks | 18.0 |
| Foreign developed stocks | 13.5 |
| Foreign emerging stocks | 4.5 |
| Corporate bonds | 19.8 |
| 30-year bonds | 13.5 |
| 30-year foreign bonds | 14.4 |
| TIPS | 1.8 |
| Commodities | 5.0 |
| Gold | 5.0 |
| REITs | 4.5 |
| Source: Meb Faber Research. | |
Many investors could stop here. That would be fine, as this is a perfectly suitable portfolio. But I think we can do better. After all, up to this point the adjustments to the base U.S. 60/40 portfolio have been focused on reducing risk and optimization. What about improving our returns?
That takes us to Step 2.
We have our portfolio’s building blocks in place—specifically, an assortment of asset classes, spread over the entire global investment set. Now it’s time to begin refining those building blocks. In this case, we use strategies that have been known for decades, namely value and momentum tilts within stock indexes.
For any readers who are less familiar with these terms, a “tilt” is simply a weighting toward a specific asset or investing style. A “value” tilt means we’re investing more heavily in global stocks exhibiting traditional traits of being priced at low valuations. This could be something as simple as ranking stocks on common measures of value such as price-to-book or price-earnings ratios.
A “momentum” tilt means we’re investing more heavily in global stocks that are enjoying greater upward momentum in market pricing than other, similar stocks. For example, a traditional momentum strategy would buy the stocks that have increased the most in price over the past 12 months. You might think of this as race cars speeding around a track—suddenly one hits the gas and begins passing the other race cars as it pushes toward the front of the pack. This car would have the best momentum.
There are, of course, many flavors of both strategies. Yet regardless of which specific variety you choose, the performance attained by combining value and momentum comes not just from investing in what is cheap and going up, but also by avoiding what is expensive and going down.
For our value tilt, I substitute our U.S. equity exposure with an unhedged strategy. In general, the strategy ranks stocks by value and momentum, then takes the average reading across both variables. One can then use the ratings to identify the stocks with the best aggregate scores. In doing this, our goal is to own only cheap stocks with rising market prices.
For foreign equity exposure, I invest in the cheapest global markets around the world. (We don’t have sufficient history to include momentum as a variable here, but research shows it works in foreign markets too.)
We can also tilt toward value in the global bond space by moving away from the market-cap-weighted index, where 70% of the global debt comes from only five countries. Instead, we’d invest in the highest-yielding sovereign bonds around the world. For perspective, in 2016, the top five global bond issuers yielded less than 1%, whereas a value strategy applied to bonds would have realized a yield that was several percentage points higher.
As before, many investors could stop here. This Global Asset Allocation Plus portfolio would hold over 10,000 global securities in a handful of basic indexes. You could rebalance this portfolio once a year in tax-exempt accounts. In taxable accounts, an investor could employ tax-harvesting strategies using various inflows and outflows. Both should take about one hour per year.
The simplicity and returns of this portfolio make it very attractive. In fact, my company believes in it so much that we launched an exchange-traded fund (ETF) based on a similar strategy. An alternative is SPDR SSgA Global Allocation  (GAL). Differences exist between the two funds, so read the prospectuses.
Despite the benefits of this portfolio, I believe we can do better, which leads us to the final step.
At this point, we have a buy-and-hold portfolio (minus occasional rebalancing). That’s a great starting point, but many investors struggle with buy-and-hold. It’s difficult to do nothing while watching your portfolio drop 10%, 30%, 50% or more.
This leads to all sorts of bad behavior, including the most damaging—selling assets during bear markets and never re-entering the market again. Think back to any “I can’t take it anymore” moments you may have had in 2008 or the tech bubble after 2000.
The alternative to buy-and-hold is any sort of active management, with one of our favorite strategies being a trend-following approach.
Many investors are confused as to the distinction between trend and momentum (from Step 2). Momentum refers to how a security is performing versus other securities. Remember our earlier example of the race car speeding around the track, passing competing cars? In the case of stocks, it might be Apple (AAPL) outperforming, say, Google (GOOG) or IBM (IBM) over the preceding 12 months.
Trend-following, on the other hand, tries to answer the question: “Looking at just Apple, is it going up or down?” Though not a perfect analogy, you might think of this as “Will the race car continue speeding around the track or is it about to get sidetracked for a lengthy pit stop?”
We don’t want to be invested in securities that won’t be rising (stuck in a pit stop). Using this trend filter helps us weed them out of our portfolio.
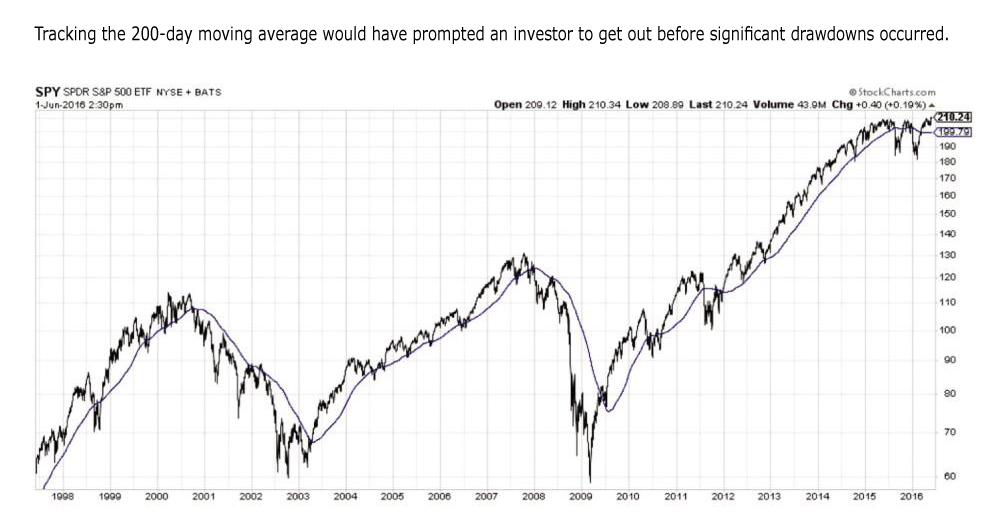
The most famous trend-following indicator is likely the 200-day simple moving average (which is simply an average of an investment’s closing price over the last 200 days). If the asset’s current market price is above that 200-day average trendline, it would indicate a bullish trend and you would be long the asset. If the market price fell below the 200-day average, it would indicate a bearish trend and you would sell the asset to avoid taking additional losses.
Figure 1 shows the market price of the SPDR S&P 500 (SPY)—an ETF that tracks the S&P 500 index—along with its 200-day moving average. Notice how the 200-day trend indicator would have gotten you out of the ETF prior to several significant drawdowns, therein protecting your wealth.
A quick clarification: Many investors expect basic trend strategies to magically “time the market.” However, a basic trend strategy is not meant to be an outperformance strategy; rather, it is designed to produce similar returns to buy-and-hold, but with lower volatility and drawdowns.
How will we apply trend to the Trinity Portfolio? We’ll call the specific model used here Global Trend, and it is meant to be an aggressive and concentrated strategy that combines both momentum and trend.
We invest in the top half of the Global Asset Allocation Plus portfolio assets as sorted by momentum, but only if the assets are above their long-term trend. The portfolio would be updated just once each month. If the asset’s market price is above its long-term trendline (in this case, the 10-month simple moving average, which is the monthly equivalent of the 200-day moving average), the asset would remain in our portfolio. However, if its market price is below the trendline, we would sell the security and move to the safety of cash and Treasury bills (T-bills).
(Note: One could place the “cash” investment in 10-year U.S. bonds instead of T-bills, and historically this would increase the returns of both strategies by another percentage point. However, the likelihood of a bull market in bonds similar to the one over the past 30 years is small, so I use the more conservative T-bills.)
There are two principal ways to approach the trend application. The first would be to update the model every month, placing the suggested trades. Astute investors with time on their hands could do this.
Even though this approach has worked well, it comes with two challenges. One, it forces investors to regularly update and trade the portfolio, which introduces opportunities to stray from the model. Two, it increases taxable events and commissions, which erode returns, especially for smaller investors.
The second, easier way to apply a trend strategy is simply by investing in a mutual fund or ETF that implements a similar model. At Cambria, we manage a similar aggressive global momentum and trend ETF. Alternatives are Arrow DWA Tactical (DWAT), Global X/JPMorgan Efficiente (EFFE) and WisdomTree Managed Futures (WDTI). All of these ETFs have different flavors, so, again, read the prospectuses.
With superior returns to buy and hold, why not just put all of your money into a trend-following strategy?
I introduced trend as an alternative to buy-and-hold. Again, many investors find buy-and-hold challenging when markets are headed south. But the irony is that those same investors also struggle with trend-following or being too different from the world in general.
The reason is because being a lone-wolf investor, significantly different than the pack, can feel risky. Being different is great when your strategy is outperforming, like 2008, but it’s a supreme challenge when it is lagging a roaring bull market in the years that followed or going through periods of underperformance, which every strategy experiences at some point. (It’s even worse when lots of other investors are making big gains.)
Because of this, many investors don’t like being different. But the challenge is that any active strategy, by definition, will be different than a buy-and-hold market strategy.
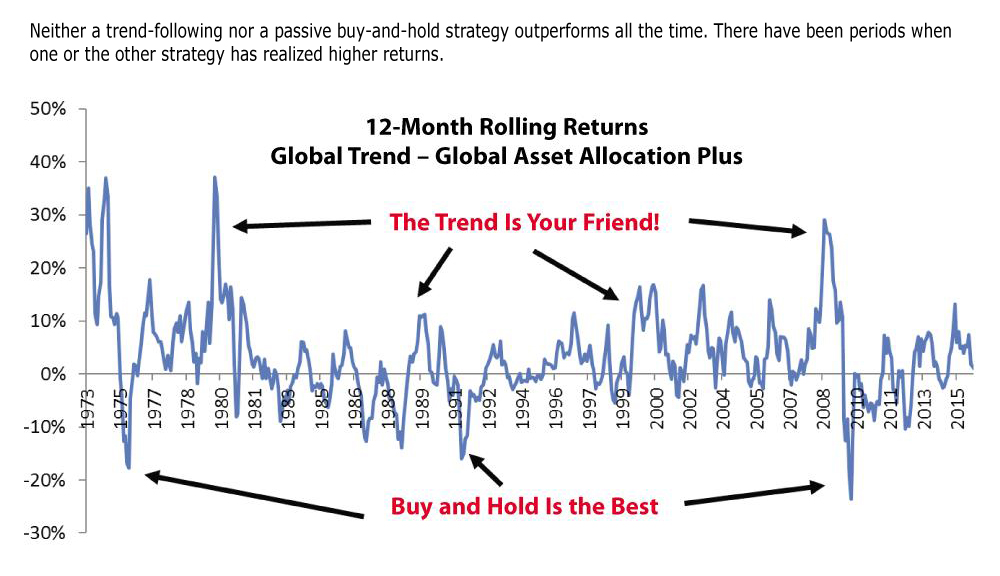
Figure 2 illustrates the back-and-forth many investors feel when comparing an active timing strategy with a passive buy-and-hold strategy. It shows the rolling 12-month performance of the Global Trend strategy (timing) versus the Global Asset Allocation Plus strategy (buy-and-hold). There were multiple periods when one strategy outperforms the other by over 30 percentage points!
Either strategy can go years underperforming the other, making you second-guess your choice. So with both buy-and-hold and trend-following presenting their own unique challenges, what should an investor do? The answer points us toward the final step we’ll take that will result in our completed Trinity Portfolio.
The simplistic solution addressing “buy-and-hold versus trend” that actually works quite well is, and I apologize for the technical term, to “go halfsies.” Specifically, use buy-and-hold (Global Asset Allocation Plus) as your foundation with a 50% allocation, and allocate to trend as well (Global Trend) with the other 50%. This will complete our transition from U.S. 60/40 to the Trinity Portfolio.
Some investors will examine Table 2 and scratch their heads. If the Global Trend Portfolio has stronger risk-adjusted returns than the Trinity Portfolio, why wouldn’t we allocate all of our investment to this superior strategy?
Table 2. Performance of Various Asset Allocations, 1973–2015
| 60% U.S. Stocks/ 40% U.S. Bonds |
60% Global Stocks/ 40%Global Bonds |
Global Asset Allocation | Global Asset Allocation Plus | Global Trend | Trinity | |
|---|---|---|---|---|---|---|
| Return (%) | 9.47 | 8.77 | 9.48 | 11.77 | 15.53 | 13.72 |
| Volatility (%) | 10.05 | 10.18 | 7.93 | 8.41 | 9.51 | 8.06 |
| Sharpe Ratio (X) | 0.44 | 0.37 | 0.56 | 0.80 | 1.10 | 1.08 |
| Maximum Drawdown (%) | -29.28 | -38.56 | -26.72 | -30.79 | -16.47 | -17.61 |
| % Positive Months (%) | 63.18 | 63.57 | 66.86 | 68.02 | 69.38 | 69.96 |
| Growth of $100 ($) | 4,941 | 3,743 | 4,943 | 12,079 | 50,308 | 25,493 |
| Inflation CAGR* (%) | 4.06 | 4.06 | 4.06 | 4.06 | 4.06 | 4.06 |
|
*Compound annual growth rate. Source: Meb Faber, Global Financial Data. |
||||||
The reason is because the best investment strategy is the one that you’ll be able to stick with, year in and year out. Investing 100% in either buy-and-hold or trend will mean there could be years when one style underperforms the other. When that happens, our natural tendency is to jump ship, abandoning our investing approach—often at the wrong time, with injurious results. That’s the last thing you want.
The Trinity Portfolio, with its exposure to both buy-and-hold and trend, reduces the chances you’ll jump ship. That’s because part of your portfolio will likely be benefiting from either buy-and-hold or trend, or both.
So, yes, Trinity has slightly lower returns than Global Trend, but it’s for a good reason: to save us from ourselves.
We’ve come a long way from our initial U.S.-only, 60/40 portfolio. By going global, adding additional asset classes, and introducing tilts and active trend strategies, we’ve transformed the risk/return complexion of the entire portfolio.
We think you’d like this related webinar! A Tale of Two Tails: The Melt Up and the Bear
Before we finish discussing the engineering behind Trinity, I’d like to point out one final attribute of the framework—its flexibility.
Despite Trinity’s balanced makeup, which results in low volatility, some conservative investors may prefer even less volatility. Fortunately, Trinity is easily customizable.
The simplest way to match Trinity’s volatility level to your personal investing temperament is by adjusting the fixed-income allocation. For a less volatile portfolio, you would simply increase your exposure to fixed income (T-bills or longer-term Treasury notes), while decreasing your other allocations on a pro rata basis.
Regarding whether to use T-bills or 10-year Treasury notes, though the benchmark notes yielded over two percentage points more than bills over the analyzed period, this is largely due to the 30+ year bull market we’ve had in interest rates since the early 1980s. However, drawdowns were much larger in 10-year bonds. This is due to the high-inflationary 1970s as rates rose over that decade.
Those of you who are more of a buy-and-hold investor can also choose to allocate more to the Global Asset Allocation Plus strategy and less to the Global Trend strategy (70%/30% instead of 50%/50%, for instance.) Volatility will be lowered, but so will long-term returns.
The overall takeaway is that, as was the case with fixed income, adjusting the ratio of Global Asset Allocation Plus to Global Trend enables investors to target a specific portfolio profile that’s right for them.
This article was adapted from “Trinity Portfolio.” To see the full white paper and related research, visit http://www.cambriainvestments.com/investing-insights/#_whitepapers.
Portfolio Strategies

Value Investing


M Toman from CA posted over 9 years ago:
C B from TX posted over 9 years ago:
Michael Muhle from TX posted over 9 years ago:
Jim Linnemann from MI posted over 9 years ago:
Peter Macqueen from NC posted over 9 years ago:
Charles Holden from WA posted over 9 years ago:
Richard Hoe from Oklahoma posted over 8 years ago:
You need to log in as a registered AAII user before commenting.
Log InCreate an account