COMPANY SUMMARY
Alamo Group Inc. manufactures and sells industrial and vegetation management equipment for governmental, industrial, and agricultural uses worldwide. It operates in two segments, Vegetation Management and Industrial Equipment. The Vegetation Management segment offers tractor powered equipment such as rotary, finishing, flail, and disc mowers; rotary cutters; front end loaders, backhoes, tillers, posthole diggers, scraper blades, cultivators, subsoilers, and other tractor attachments and implements. This segment also provides commercial and residential zero turn mowers; hydraulic and mechanical boom and reach mowers; hedge and hedgerow cutters; industrial grass mowers; seedbed preparation equipment; and forestry and tree care tools, including chippers, stump grinders, mulchers, brush cutters, flails, and debarkers, as well as remote control mowers and related replacement parts. Its Industrial Equipment segment offers hydraulic telescoping booms; catch basin and roadway debris vacuum systems; sewer cleaners; vacuum trucks, combination sewer cleaners, hydro excavators, trenchers, and high pressure cleaning systems; truck mounted snow plows, blowers, dump bodies, spreaders, deicers, brine sprayers, snow throwers, and wing systems; salt spreaders; street sweepers, including mechanical broom and regenerative air models; leaf and debris collection equipment and replacement brooms; solid waste and recycling equipment; municipal tractors and attachments; asphalt patchers; underground construction forms; traffic control and crash attenuator trucks; industrial vacuum excavation units; trailer mounted and custom truck mounted systems; and related accessories and truck up fitting services. The company serves the infrastructure building and maintenance, industrial construction, public works, land maintenance, agriculture, and tree care markets. Alamo Group Inc. was founded in 1955 and is headquartered in Seguin, Texas.
Financial Summary
| Share Statistics |
ALG |
Industry
Median |
Percentile
(All Stocks) |
| Market Cap (Mil) |
$1,812.9 |
$3,307.4 |
53% |
|
| Shares Out (Mil) |
12.1 |
45.7 |
23% |
|
| Institutional Ownership |
98.5% |
69.9% |
79% |
|
| Float (Mil) |
12.0 |
59.5 |
22% |
|
| Beta |
1.09 |
1.12 |
65% |
|
| Avg Daily Volume (000s) |
144 |
231 |
41% |
|
Price Change
(52-week) |
(17.6%) |
72.5% |
37% |
|
| Growth |
ALG |
Industry
Median |
Percentile
(All Stocks) |
| Sales (5yr) |
6.6% |
5.6% |
44% |
|
| Net Income (5yr) |
12.4% |
9.8% |
59% |
|
| EPS (5yr) |
12.0% |
12.0% |
51 |
|
| Dividends (5yr) |
18.2% |
2.0% |
83% |
|
| Cash Flow (5yr) |
69.4% |
(15.9%) |
97% |
|
| Estimates |
Qtrly |
Current
Fiscal
Year |
Next
Fiscal
Year |
| # of Estimates |
5 |
5 |
5 |
| Current EPS |
$2.622 |
$10.528 |
$12.176 |
| Month Ago EPS |
$2.622 |
$10.528 |
$12.176 |
| # Rev Up |
0 |
0 |
0 |
| # Rev Down |
1 |
3 |
1 |
| Three Months Ago EPS |
$2.742 |
$10.584 |
$12.038 |
| Year/Year Chg |
2.8% |
22.6% |
na |
| Financials |
ALG |
Industry
Median |
Percentile
(All Stocks) |
| Sales (TTM) (Mil) |
$1,662 |
$2,100 |
57% |
|
| Net Income (TTM) (Mil) |
$101 |
$148 |
61% |
|
| EPS (TTM) |
$8.386 |
$1.100 |
92% |
|
| Operating Cash Flow (TTM) (Mil) |
$163 |
$238 |
57% |
|
| Net Cash Flow (TTM) (Mil) |
($7) |
$3 |
33% |
|
| Long-Term Debt (Q1) (Mil) |
$268 |
$391 |
53% |
|
| Enterprise Value (Q1) (Mil) |
$2,134 |
$4,023 |
50% |
|
| Valuation |
ALG |
Industry
Median |
Percentile
(All Stocks) |
| P/B |
1.50 |
2.18 |
42% |
|
| P/E |
17.9 |
24.9 |
47% |
|
| Dividend Yield |
0.9% |
0.3% |
66% |
|
| PEG (5yr hist) |
1.5 |
1.3 |
60% |
|
| Ratios |
ALG |
Industry
Median |
Percentile
(All Stocks) |
| Gross Margin |
24.2% |
31.8% |
27% |
|
| Net Margin |
6.1% |
7.4% |
52% |
|
| ROA |
6.2% |
4.7% |
76% |
|
| ROE |
8.8% |
10.7% |
53% |
|
| Liabilities to Assets |
31.1% |
50.1% |
22% |
|
| F-Score |
3 |
5 |
18% |
|
Passing Stock Screens
As of 10/20/2026, from a list of 60 stock screening strategies,
ALG meetings the criteria of 1 screen:
Stock Screen
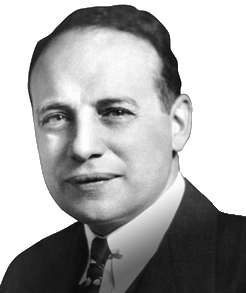
GURU STRATEGY
Graham--Defensive Investor (Non-Utility) Screen
Factors: Yield, Value, Quality
Credited as one of the fathers of in-depth security analysis, Graham's approach focuses on the concept of intrinsic value.


