
Two concepts often left out of conversations about investing are opportunity cost and endowment effect. Though different, they do overlap and can have implications for your portfolio.
Opportunity cost is what you forfeit by taking a certain course of action, even if the action is a decision not to act. Every dollar you allocate to a specific investment is a dollar not allocated to some other investment or purpose. If you allocate, say, $5,000 to stock A and stock B outperforms, your opportunity cost is the excess return you would have realized by buying stock B instead. At the same time, the money you invested in stock A costs you the opportunity of doing something else. By investing the money, you give up the chance to, say, spend it on a vacation or make a donation to your favorite charity.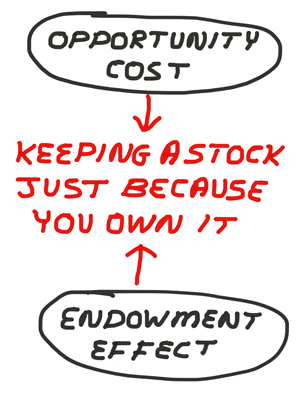
The endowment effect holds that we value the things we own more than things we don’t own. In one oft-cited study, some participants were given a coffee mug for free while others were not. When the owners were asked how much they would be willing sell the coffee mugs for, they gave a price that was approximately double what those who did not receive the mugs were willing to pay for them. The mere ownership of a free coffee mug increased its value in the eyes of those who were given it. This behavior applies to many other assets as well, including investments. Combined with other biases, such as the disposition effect (an aversion to taking to a loss on a stock) and confirmation bias (seeking out information that supports your viewpoint), investors can end up holding onto investments that an objective third party would otherwise view as candidates for selling.
The only ways to completely avoid opportunity cost are to make the best decisions all of the time and to have perfect foresight. Since neither is possible, the best a person can hope to do is to reasonably limit opportunity cost. The endowment effect can be partially countered by asking a simple question: If your investments were sold while you were sleeping, would you buy them back after you wake up? If the answer is no, then they are probably not as valuable as you currently think they are.
The overlap between the two concepts should be coming more into focus. By holding onto an investment simply because you already own it, you are both being overly optimistic about its prospects and missing out on the potential returns of allocating your money elsewhere.
As effective as it can be to ask “would I buy this today,” care needs to be taken to avoid excessive trading. Constantly seeking to eliminate or, at least limit, opportunity cost can actually have the opposite effect. In seeking higher returns, investors often end up with lower long-term returns due to performance chasing. It’s a pattern that has been repeated throughout history and will continue into the future.
So, if constant performance chasing is not the answer, what is? Having defined rules that govern your investment decisions. Even if you don’t have clear cut rules, simply writing down the reasons you are buying an investment and what would cause you to sell it—before you buy it—can help. You are more likely to be objective before you purchase the investment (when the endowment effect is less powerful), and you’ll have an identifiable set of criteria to determine if the characteristics that made the investment attractive still apply. If those traits no longer apply, consider whether it is time to sell.
None of this will completely eliminate the opportunity cost of not having a bought a different investment. Over any given period of time, there will always be an investment with a higher return (unless you are really, really lucky). What having clearly defined rules will do is reduce the opportunity cost caused by an undisciplined approach and behavioral biases such as the endowment effect.

- Dishonesty, Choices and Investing – Duke University professor Dan Ariely explained the logic of asking whether you would repurchase an investment if it was sold from your portfolio while you were sleeping.
- When to Sell a Stock: Practical and Profitable Rules – This 2001 AAII Journal article gives 31 guidelines for determining when it may be time to part with a stock (PDF format).
- Solving the Problem of Retirement – Three actions investors can take to mitigate the problem of retirement placing potentially unlimited demands on finite savings.
- Model Shadow Stock Portfolio: Loosened Buy Rules on New Addition – Due to a shortage of qualifying stocks, the purchase guidance for the portfolio’s newest stock has been loosened.
Dow component JPMorgan Chase & Co. (JPM) will report on Friday as second-quarter earnings season officially starts. Joining it will be seven other S&P 500 companies: PepsiCo (PEP) on Tuesday; Fastenal Company (FAST) on Wednesday; Delta Air Lines (DAL) and Omnicom Group (OMC) on Thursday; and Citigroup (C), PNC Financial Services Group (PNC) and Wells Fargo & Co. (WFC) on Friday.
The week’s first economic reports will be the May JOLTS report on Tuesday and the Federal Reserve’s periodic Beige Book on Wednesday. Thursday will feature the June Producer Price Index (PPI). The June Consumer Price Index (CPI), June retail sales, June industrial production, May business inventories and the University of Michigan’s preliminary July consumer sentiment survey will be released on Friday.
Seven Federal Reserve officials will make public appearances: San Francisco president John Williams on Monday; Governor Lael Brainard and Minneapolis president Neel Kashkari on Tuesday; Kansas City president Esther George and Chair Janet Yellen on Wednesday; Chicago president Charles Evans on Thursday and Dallas president Robert Kaplan on Friday.
The Treasury Department will auction $24 billion of three-year notes on Tuesday, $20 billion of 10-year notes on Wednesday and $12 billion of 30-year bonds on Thursday.
- Solving the Problem of Retirement
- Inherited IRA Rules for Spouses, Heirs and Trusts
- Piotroski Price-to-Book Screen
Pessimism about the short-term direction of stock prices rebounded to a six-week high in the latest AAII Sentiment Survey. At the same time, neutral sentiment stayed above 40%, while optimism was nearly unchanged.
Bullish sentiment, expectations that stock prices will rise over the next six months, declined by a mere 0.1 percentage points to 29.6%. This is the 19th consecutive week and the 24th time out of the last 25 weeks that optimism is below its historical average of 38.5%.
Neutral sentiment, expectations that stock prices will stay essentially unchanged over the next six months, pulled back by 2.9 percentage points to 40.6%. Neutral sentiment remains above its historical average of 31.0% for the 10th consecutive week and the 15th out of the last 16 weeks.
Bearish sentiment, expectations that stock prices will fall over the next six months, rebounded by 3.0 percentage points to 29.9%. Pessimism was last higher on May 31, 2017 (31.5%). The rebound was not large enough to prevent bearish sentiment from staying below its historical average of 30.5% for the eighth time out of the last 10 weeks.
Neutral sentiment is above 40% on back-to-back weeks for the first time since October 26 and November 2, 2016. Even with this week’s decline, neutral sentiment remains at an unusually high level (more than one standard deviation above its historical average.)
This year’s record highs for the S&P 500 and the Nasdaq have encouraged some individual investors, though any impact of the latter index’s recent weakness has not been expressed by our members. The Trump administration’s ability (or lack thereof) to move forward on economic and tax policy remains at the forefront of many others’ minds and is having a significant impact on sentiment. Also playing roles are earnings, valuations, concerns about the possibility of a pullback in stock prices and interest rates/monetary policy.
This week’s special question asked AAII members how the stock market’s performance during the first half of this year compares to what their expectations were in January. Seven out of 10 respondents (70%) said the returns were better than they expected. Slightly more than 16% said the first half’s returns matched their expectations.
Here is a sampling of the responses:
- “Better. Expected tax cuts and stimulus by now to drive the market, but the market held up anyway.”
- “Much better than my expectations. I am still afraid that the market will fall significantly from here.”
- “No great surprises.”
- “Way above my expectations.”
- “I expected the market to go down; it did not.”

Bullish: 29.6%, down 0.1 points
Neutral: 40.6%, down 2.9 points
Bearish: 29.9%, up 3.0 points
Bullish: 38.5%
Neutral: 31.0%
Bearish: 30.5%
AAII Asset Allocation Survey
Equity allocations among individual investors rose to their highest level in more than a decade last month. The June AAII Asset Allocation Survey also shows fixed-income holdings at a multi-year low.
Stock and stock fund allocations rose by 1.4 percentage points to 68.8%. This is the largest allocation to equities since April 2005 (70.3%). June was the 51st consecutive month that equity allocations were above their historical average of 60.5%.
Bond and bond fund allocations declined 0.5 percentage points to 15.0%. Fixed-income allocations were last lower in May 2009 (14.2%). The historical average is 16.0%.
Cash allocations declined by 0.9 percentage points to 16.3%. May was the 67th consecutive month that cash allocations were below their historical average of 23.5%.
Differences in the composition of which AAII members take the Asset Allocation Survey on a month-to-month basis can cause some fluctuations in the results. Nonetheless, last month’s equity allocation ranks as the 46th highest in the nearly 30 years we have conducted this survey (356 monthly readings.) The record high for equity allocations is 77.0%, reached in both January and March of 2000.
Yields on the benchmark 10-year Treasury note fell to a new 2017 low in June before rebounding late in the month. At the same time, the S&P 500 index and the Nasdaq set new highs last month. Many AAII members have described the ongoing low interest rate environment as making bonds look unattractive and pushing them to allocate more to stocks instead.
Last month’s special question asked AAII members what determines how much they allocate to cash. More than three out five respondents (62%) said projected needs [required minimum distributions (RMDs), living expenses, emergencies, etc.] and/or future investment opportunities. Nearly 26% said their cash allocations are primarily determined by their short-term expectations for the stock market.
Here is a sampling of the responses:
- “Three to five years of needs so I don’t have to sell at a disadvantageous time.”
- “I like to keep a minimum of 18 months in cash to ride out economic bumps.”
- “Keep some in reserve for buying opportunities.”
- “My sense of safety needed to have a good night sleep, plus room to maneuver.”
- “My age and my RMD requirements.”
- Stocks and stock funds: 68.8%, up 1.4 percentage points
- Bonds and bond funds: 15.0%, down 0.5 percentage points
- Cash: 16.3%, down 0.9 percentage points
- Stock Funds: 35.2%, up 2.5 percentage points
- Stocks: 33.6%, down 1.1 percentage points
- Bond Funds: 12.4%, up 1.0 percentage points
- Bonds: 2.5%, down 1.5 percentage points
Take the Asset Allocation Survey.
Local Chapter Meetings

June 29, 2017 Implications of the Declining Number of Stocks
June 22, 2017 Don’t Like Volatility? Take a Longer-Term View
June 16, 2017 Is It Active or Passive?
June 8, 2017 Invest, Exceed Goal, Then Stop Taking Risk

