
May has historically marked the start of the “worst six months” for stocks. Returns for the major stock indexes over the period of May through October have historically lagged those of the “best six months” (November through April). Worst shouldn’t be confused with terrible, as the S&P 500 index averaged a 1.5% gain for May through October periods between 1950 and 2017 according to LPL Financial Research. The returns for the Dow Jones industrial average are not significantly different.
Midterm election years are a bit different. CFRA Research’s chief investment strategist Sam Stovall calculates the S&P 500 as averaging a 1.1% decline when the worst six-month periods occur in a midterm election year. Though the sample size is small (Stovall’s data goes back to 1946), the average loss when the midterm election is held during a president’s first term is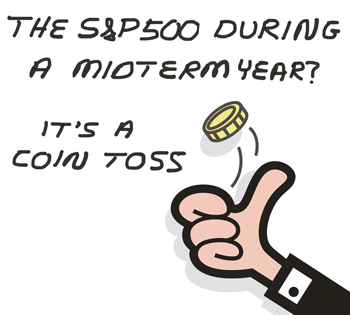 3.0%. A longer study by professors Kam Fong Chan of the University of Queensland and Terry Marsh of University of California Berkeley found that the premium over the one-month Treasury rate for investing in stocks averaged –1.72% between the period of June through October during midterm election years occurring between 1815 and 2015.
Before using the negative return relative to the one-month Treasury rate as an excuse to leave the market, there are four things to consider. First, since 1946, the midterm election year performance of the S&P 500 between April and October has been a coin toss, up nine times and down nine times. Second, the magnitude of losses is not always big. Stovall's data shows four midterm years with single-digit May-October losses. His data also shows five double-digit losses for the S&P 500 over the last 18 midterm election years’ worst six-month periods: 1946: –20.9%; 1962: –13.4%; 1966: –11.9%; 1974: –18.2%; and 2002: –17.8%. Third, John Lynch and Ryan Detrick (the chief investment strategist and senior market strategist, respectively, of LPL Financial Research) calculated an average 5.5% gain for the S&P 500 over the May through October period during midterm election years when the index was above its 200-day moving average trend and the S&P 500 had realized a positive return during the previous six-month period. This has occurred nine times since 1950. This year just happens to be a midterm election year when stocks went into May with trailing six-month gains (yes, even with the January correction factored in) and the S&P 500 above its 200-day moving average.
There is one other thing to consider: the returns after the worst six-month period has ended. Historically, once the midterm elections are held, the returns have been very good.
Chan and Marsh found that the average annualized premium (return in excess of the one-month Treasury rate) for investing in stocks has been 13.24% during the period of December through April following all midterm elections since 1815. Their research shows “61% of the monthly equity premiums realized from December to April following midterms are positive.” They further described their findings as being “more pronounced in the last century.”
Put another way, the odds of summer and fall discomfort are elevated, but so are the odds of being compensated for it if you believe the historical presidential term cycle for the stock market will continue its normal pattern this year. There is no guarantee it will, of course. Arguments could be made in either direction. Bulls can point to strong earnings and continued economic expansion. Bears can point to valuations and political uncertainties (both domestically and internationally).
Whenever looking at data like this, it’s important to consider your investing horizon. Any summer or fall weakness in the stock market should not derail your financial plans, especially if you don’t need the money for at least five or 10 years, as long as you do not panic. (Money needed within six or 12 months should not be invested in the stock market regardless of what the outlook looks like.) The market will fluctuate up and down; this is why the long-term returns on stocks are as high as they are.
Those of you who feel the need to do something have a few options. One is to see if your portfolio needs to be rebalanced. If the bull market has put your equity allocations well above target, consider bringing them back down to the desired long-term level. Another is to make adjustments with a small part of your portfolio. This could give you the emotional satisfaction of doing something without tearing apart your entire strategy. A trend-following type of approach such as holding onto stocks as long as the S&P 500 or another broad benchmark stays above its 200-day moving average is an option for those of you who incorporate technical analysis into your strategies. (It helps to factor in a 1% below/above band to avoid excessive transactions.) Alternatively, you could follow Stovall’s rotation strategy by shifting toward health care, real estate and consumer staples. Those of you who are contributing to your savings could hold off on putting new dollars to work until the fall, albeit with the dual risks of forfeiting any gains that occur or being too nervous to get into the market should prices decline instead.
Whatever option you choose, make sure it fits into your long-term strategy and that you have a plan to follow once the so-called worst six-month period is over. Most importantly, realize that not acting in response to expected short-term outcomes is often the best strategy.

- Using Seasonal and Cyclical Stock Market Patterns – Jeffrey Hirsch of the Stock Trader’s Almanac explains the best/worst six-month strategy in greater detail.
- The Trinity Portfolio: Combining Diversification, Tilts and Trend-Following – Mebane Faber explains how to strike a compromise by using both a trend-following and a buy-and-hold approach in the same portfolio.
- A Look Back at History: Lessons From the Financial Crisis – Lessons from the last bear market that still remain very valid today.
- Searching for Future Stock Market Winners – A study of past big winners identified common traits centered around value, earnings growth and price momentum.
Earnings season will start to shift toward retailers, with Home Depot Inc. (HD) announcing its results on Tuesday and Walmart Inc. (WMT) releasing its earnings on Thursday. There will be companies from other sectors reporting as well, including fellow Dow component Cisco Systems Inc. (CSCO) on Wednesday. Joining these three companies will be seven other members of the S&P 500 plus many smaller companies.
The week’s first economic reports will be April retail sales, the May Empire State Manufacturing Survey, March business inventories and the May housing market index on Tuesday. Wednesday will feature April housing starts and building permits and April industrial production. The May Philadelphia Fed Business Outlook Survey will be released on Thursday.
Five Federal Reserve officials will make public appearances: Cleveland president Loretta Mester and St. Louis president James Bullard on Monday; San Francisco president John Williams on Tuesday; Atlanta president Raphael Bostic and St. Louis president James Bullard on Wednesday; Minneapolis president Neel Kashkari on Thursday; and Cleveland president Loretta Mester on Friday.
The Treasury Department will auction $11 billion of 10-year TIPS (treasury inflation-protected securities) on Thursday.
- The Four Groups of ETFs
- Most Mutual Funds Do Not Outperform
- The Basics of Real Estate Investment Trusts (REITs)
Optimism about the short-term direction of stocks rebounded, but remains below average according to the latest AAII Sentiment Survey. Pessimism, meanwhile, pulled back after having risen last week.
Bullish sentiment, expectations that stock prices will rise over the next six months, rose 5.1 percentage points to 33.5%. Optimism remains below its historical average of 38.5% for the 11th consecutive week and the 12th time in 14 weeks.
Neutral sentiment, expectations that stock prices will stay essentially unchanged over the next six months, declined by 0.4 percentage points to 41.0%. This is the 12th consecutive week with a neutral sentiment reading above the historical average of 31.0%.
Bearish sentiment, expectations that stock prices will fall over the next six months, reversed last week’s increase and fell 4.7 percentage points to 25.5%. Pessimism is below its historical average of 30.5% for the fourth consecutive week and the 18th time out of the past 22 weeks.
Neutral sentiment remains at an unusually high level (more than one standard deviation above its historical average) for the second consecutive week. Such readings have been followed by slightly higher than average six-month returns for the S&P 500 index, but not significantly so. Both bullish and bearish sentiment are within their typical historical ranges.
Many individual investors, but not all, anticipate continued volatility and/or think that the current political backdrop could have a further impact on the stock market. Trade policy is influencing some individual investors’ sentiment. While many individual investors either approve of the Federal Reserve’s plan to gradually raise interest rates or don’t expect it to affect the stock market, some are concerned about the impact that rising rates will have. Also influencing sentiment are valuations, tax cuts, earnings and economic growth.
This week’s special question asked AAII members how the Dow Jones industrial average’s and the S&P 500’s inability to revisit their respective January highs is impacting their sentiment toward stocks. Respondents generally fell into one of three groups. The largest group, representing 39% of all respondents, say the lack of new highs mostly is not impacting their sentiment. Many of them describe themselves as long-term investors or see this as normal market activity. Just under 30% have become more cautious, with several saying they are holding off on buying new stocks or are uncertain about how the macro (especially political) backdrop will evolve. About 29% are optimistic about stock prices, particularly because they believe a short-term bottom has either already been set or because the economy is continuing to grow.
Here is a sampling of the responses:
- “The fact that the Dow and the S&P 500 are below their highs means that I’m buying at a lower price.”
- “It’s not. I think we are still in a bull market and stocks will go up this year.”
- “I’m a bit more cautious and more cognizant of the volatility; however, I feel the economy and fundamentals are solid, so I’m still bullish.”
- “I am staying invested; I am not adding at this time as I am building my cash balance to entertain some upcoming purchases.”
- “More careful regarding stock selection. Not necessarily more conservative, but I am taking fewer chances.”

Bullish: 33.5%, up 5.1 points
Neutral: 41%, down 0.4 points
Bearish: 25.5%, down 4.7 points
Bullish: 38.5%
Neutral: 31.0%
Bearish: 30.5%
Local Chapter Meetings

May 3, 2018 Coming Out Ahead by Doing Less
April 26, 2018 A Checklist Can Make You a Better Investor
April 19, 2018 Guidelines for Projecting Retirement Savings
April 12, 2018 How Much Is a Lottery Ticket Worth?

