
I’ve long been a fan of stock screens. They filter a database to identify stocks with specific traits. A value screen may identify stocks trading at low price-earnings (P/E) ratios with above-average levels of return on equity (ROE). A growth screen can find stocks that consistently grow profits and are projected to continue doing so in the future. All stocks added to AAII’s model stock portfolios are found through stock screens.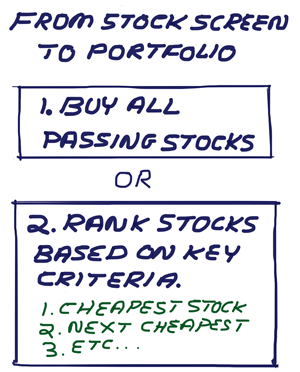
A challenge with stock screens is identifying which of the passing stocks to buy. There are two primary approaches to making this decision, and I’ll discuss both. (The second approach I’ll discuss is the one used at AAII.)
The first approach is to simply buy everything passing the screen. This approach has been called mechanical investing, though it now falls under the broader arena of what is known as quantitative (or simply “quant”) investing. Stocks are purchased when they pass the screen. The portfolio is then rebalanced at preset intervals or adjusted according to predefined rules. The rebalancing involves selling the stocks that no longer pass and adding the new ones that do pass. This approach takes human emotions and judgment out of the buy and sell decisions. (Biases and other cognitive errors still do influence the creation of the screen and the implementation of the rules.)
Mechanical investing is not without downsides. Depending on the broker used, the frequency of trading, the type of account (taxable or IRA/Roth IRA) and the liquidity of stocks bought and sold, trading costs can be high on a relative or absolute basis. A purely mechanical approach also excludes any due diligence. Stocks are purchased even if there are problems not identified by the screen that would cause you otherwise to not buy them. The number of stocks passing the screen is another potential issue. A screen with strict criteria may result in a highly concentrated portfolio of just a few stocks; a screen with looser criteria might result in a very large portfolio in terms of the number of stocks.
The second approach is to choose among the stocks passing a screen. This approach treats stock screens as a tool for narrowing down the broad universe of stocks to a manageable list. The list is examined and the best stocks are chosen.
This approach has the advantage of weeding out those stocks with undesirable traits not identified by the screen (e.g., the company recently gave a bad earnings report). It also allows stocks with other factors that would cause them not to be suitable candidates (e.g., the company is in the process of being acquired or divesting a sizeable segment of its business) to be bypassed.
A downside to this approach is the element of human judgment in deciding which stocks to invest in. Biases and other supposedly irrelevant factors can influence which stocks are selected and which are passed over.
To reduce such potential interference, we use a ranking process. When selecting stocks for the Model Shadow Stock Portfolio, preference is given to the candidate with the lowest valuation. If two viable candidates are equally cheap, momentum is used as a tiebreaker. The advantages of this ranking process are the ability to consistently repeat it, the exclusion of biases against any single stock or company and the flexibility to exclude a company based on factors external to the screen.
A twist on this ranking strategy is one that is used for the Stock Superstars Report. Qualifying companies are first ranked based on characteristics specific to each of the portfolio’s four groups [profitability and relative strength, value & financial strength, growth at a reasonable price (GARP) revisions and reasonably priced growth]. Then, all those stocks that are currently owned or whose industries or sectors already have a significant weighting in the portfolio are ruled out. The remaining stocks are reviewed with a preference given to stocks ranked higher than those ranked lower.
While the second approach does incorporate the risk of cognitive errors, it gives you the ability to make the final call on what goes into and what stays out of your portfolio. I believe this can be desirable when a systematic approach, such as ranking the passing stocks, is applied to the stocks identified by the screens.

- Constructing Winning Stock Screens – These guidelines can help you determine which characteristics to rank first, and which to use as tiebreakers.
- Guide to Stock Screening – Need help deciding which stock screen to start with? This primer offers useful suggestions.
- Observations From Decades of Tracking Investment Newsletters – Mark Hulbert discusses the lack of outperformance among newsletters and the common traits he’s noticed among the longest-running newsletters.
- The Individual Investor’s Guide to Exchange-Traded Funds 2018 – This year’s guide has been expanded, covering 542 ETFs in print and over 2,000 funds online.
Second-quarter earnings season will start to shift toward retailers with Home Depot Inc. (HD) and Walmart Inc. (WMT) reporting on Tuesday and Thursday, respectively. Joining them will be fellow Dow Jones industrial average component Cisco Systems Inc. (CSCO) on Wednesday and 10 other members of the S&P 500 index throughout the week.
The week’s first economic report will be July import and export prices, released on Tuesday. July retail sales, the August Empire State manufacturing survey, the first estimate of second-quarter productivity, July industrial production and capacity utilization, June business inventories and the August housing market index will be released Wednesday. Thursday will feature July housing starts and the August Philadelphia Federal Reserve’s business outlook survey. The University of Michigan’s preliminary August consumer sentiment survey will be released on Friday.
- Inherited IRA Rules for Spouses, Heirs and Trusts
- The Individual Investor’s Guide to Exchange-Traded Funds 2018
- Avoid the Top 10 Mistakes Made With Beneficiary Designations
Optimism among individual investors about the short-term direction of the stock market rebounded, but not enough to rise above the historical average. The latest AAII Sentiment Survey also shows a further drop in neutral sentiment and a decline in pessimism.
Bullish sentiment, expectations that stock prices will rise over the next six months, rose 7.3 percentage points to 36.4%. This is a five-week high. Even with the increase, optimism remains below its historical average of 38.5% for the sixth time in seven weeks.
Neutral sentiment, expectations that stock prices will stay essentially unchanged over the next six months, fell 6.2 percentage points to 32.6%. The drop is not large not enough to prevent neutral sentiment from remaining above its historical average of 31.0% for the 24th time in 25 weeks.
Bearish sentiment, expectations that stock prices will fall over the next six months, pulled back by 1.0 percentage points to 31.0%. The historical average is 30.5%.
Neutral sentiment has fallen by a cumulative 9.0 percentage points since hitting an unusually high level of 41.6% two weeks ago. At current levels, all three indicators are well within their typical historical ranges.
Tariffs, and the possibility of a trade war, remain front and center on the minds of many individual investors. Also influencing sentiment are Washington politics (including President Donald Trump), economic growth, interest rates (including monetary policy), valuations and corporate profits.
This week’s special question asked AAII members what they thought about Apple Inc. (AAPL) trading at a $1 trillion market capitalization. We received a variety of responses. Approximately 17% of respondents say “good for them” or something similar, while 8% say they expected it to happen. Four percent regret not buying the stock many years ago. A little under 6% think the stock is now fairly valued, while 5% say Apple is undervalued. Almost 12% think the stock is overvalued, and 5% think the stock is vulnerable to drop especially if the market falters. Slightly more than 15% say they don’t care or that crossing the $1 trillion mark doesn’t affect their views of the stock.
Here is a sampling of the responses:
- “The product is good, and the P/E is reasonable. What’s not to like?”
- “Great! They deserve it.”
- “Too high. The stock will probably decline, and I do not see how they can continue to improve the phones.”
- “I wish I bought the stock 15 years ago.”
- “It’s just a number. It’ll be equally uneventful when they stumble and drop below $1 trillion.”
- “I think it’s great because I own a fair amount of it.”

Bullish: 36.4%, up 7.3 points
Neutral: 32.6%, down 6.2 points
Bearish: 31%, down 1.0 points
Bullish: 38.5%
Neutral: 31.0%
Bearish: 30.5%
Local Chapter Meetings

August 2, 2018 Seeking More Than One Factor Can Boost Returns
July 26, 2018 Bitcoin and Other Notes From the CFA’s Financial Analysts Seminar
July 19, 2018 Some Thoughts About Allocating to Cash
July 12, 2018 Projecting an Aging Parent’s Finances

