

Charles Rotblut leads a class in AAII's new Essential Investing Video Course. Go to https://www.aaii.com/ves for more information and to subscribe.
William “Bill” Sharpe is the STANCO 25 Professor of Finance, Emeritus, at Stanford University, recipient of the 1990 Nobel Prize in Economic Sciences and a co-founder of Financial Engines Inc. He also authors the Retirement Income Scenarios blog (RetirementIncome
Scenarios.blogspot.com). In this second excerpt of our conversation at the CFA Institute Conference this past May, we discussed the Sharpe ratio and the advice he has for individual investors. The first excerpt of our conversation appeared in the September 2014 AAII Journal (“Allocate by Market Weight (And Adjust for Personal Circumstances)”).
—Charles Rotblut
Charles Rotblut (CR): How much emphasis should investors put on the ratio named after you, the Sharpe ratio?
William Sharpe (WS): I have two minds about the Sharpe ratio. I originally called it the reward-to-variability ratio, which I think at least captures its meaning better. What I set out to do a long time ago was to answer the question: If you’re going to look at the performance of an investment and you can have only one number to do it with, what number might be useful? The idea was that you really need to look at the expected return and you really need to look at the risk. If you can only use one number, then maybe what you ought to do is to compare the investment with some relevant alternative and divide the expected excess return by the relative risk. In the original version, which is the one generally called the Sharpe ratio, the alternative was a riskless investment like a Treasury bill. So you divided the expected excess return over the Treasury bill by the risk relative to the Treasury bill. I still think that if you’re going to look at only one number, this is a useful one. [Editor’s note: See the box below for a more detailed description of how the ratio is calculated.]
Subsequently, people expanded the idea to other comparisons. If you’re evaluating a value fund, you would compare it with a value index benchmark and you would divide the expected return of the fund over the benchmark by the risk of the difference between the two returns. This is sometimes called the information ratio. The basic idea in each case is to use a measure that includes both expected return and risk.
My general view is that this is 2014: We have computers and we really don’t have to focus only on one number. But these ratios can provide a helpful first look at performance after the fact. Of course what really matters is expected performance and risk in the future, and historical counterparts are very imperfect estimates of what the future might bring.
CR: For individual investors, if they’re trying to build their portfolio, should they focus on return relative to risk and try to use active managers, or should they just think about indexing and get the allocation right?
WS: I would emphasize indexing and getting the allocation right. Historical risk may be a reasonably good predictor of future risk. But average return in the past is typically a rotten predictor of expected future return, whether you look at total return or active return over a benchmark. When you look at a return/risk ratio, you’re looking at two things, one of which is probably not terrible for using the past to predict the future, the other one of which is pretty bad as a predictor. If you focus on funds with good ex post [historical] Sharpe ratios, you’re likely just going to get a portfolio of investments that had lucky outcomes. And the way markets work, just because an investment or an investment strategy got lucky in the past doesn’t mean it’s necessarily going to get lucky in the future.
CR: You think it’s more about reversion to the mean?
WS: Yes, it’s reversion to the mean, but I’m reluctant to emphasize that term, because it sounds like it’s deterministic. It’s reversion in the sense that if you take a group of people who flip coins, and then take the people who’ve gotten five in a row and say, “I’m going to put my money with them because they got five in a row,” well, that was almost certainly just luck. They’re more likely to have two to three out of five in the future. So, it’s reversion to the mean in that sense, but it’s not as if there’s some process that’s driving winners to become losers and vice-versa. Certainly in the stock market, there is a process in which prices adjust to new information.
In general, I think, you should be skeptical of somebody who says “I’ve found a way that would’ve beaten the market in the past and I believe the same approach will beat the market in the future,” unless there’s a story as to why it might be reasonable to assume the outperformance will continue. If the good performance relies on people not getting the prices right, to say that they didn’t get them right in the past and they won’t get them right in the future is a bit of a leap.
CR: What about small cap and value? Is that a case where people are mispricing these stocks and the stocks are staying mispriced?
WS: It could be, but when you look at the record, it’s not as crystal-clear as some proponents of these strategies would have you believe. There have been substantially long periods in which value stocks underperform the markets, and vice-versa.
And there are other things to worry about. It may be that the value stocks are positioned so that in the event of a depression they would be gone. We haven’t had a depression in a long time. Even though we had a really bad downturn, it wasn’t as bad as it could’ve been. So perhaps value stocks are priced to reflect their vulnerability to a catastrophic possibility that is not included in the record of the last 30 or 40 years. There are also arguments that some people knowingly are willing to shun or underweight value stocks with returns that are correlated with their human capital. I don’t know how convinced I am that that makes a lot of sense.
But if the only story is that you should diverge from market proportions in your portfolio because people were dumb in the past and they’re going to be dumb in the future in the same way, I’m skeptical. There is a lot of smart money in the market trying to exploit mistakes people make, and that tends to carry the seeds of its own destruction. So I would be cautious of putting too big a bet on diverging from a broad market cap–weighted portfolio.
The Components of the Sharpe Ratio
Computerized Investing editor Wayne Thorp explained what the original Sharpe Ratio is in the May 2013 AAII Journal (“Interpreting the Sharpe Ratio.”) Here is an excerpt of his article.
The Sharpe ratio measures risk-adjusted returns. It ties the level of excess returns to volatility. Higher values indicate greater excess returns relative to the level of risk incurred. A risk-free asset or a portfolio with no excess return would have a Sharpe ratio of zero.
William Sharpe first published his ratio in the January 1966 issue of the Journal of Business. Here is the original ratio and its three components:
Sharpe Ratio = (Rx – Rf) ÷ StdDev(Rx)
Where:
Rx = average rate of return from investment X
Rf = risk-free rate
StdDev(Rx) = standard deviation of Rx
Average Return
The Sharpe ratio can be used to measure expected and historical risk-adjusted returns. Expected average returns are used to calculate the forward-looking ratio, whereas actual returns are used in the historical ratio.
The expected return is also known as the required rate of return because it represents the minimum return investors require to compensate them for the added risk, which includes both the riskiness of the investment and the time value of money.
Risk-Free Rate
The risk-free rate is the return investors require to compensate for the time value of money alone. Typically, investors use the return on U.S. Treasury bills for the risk-free rate because it is reasonable to assume the U.S. government will not default on its debt obligations, and thus investors need only be compensated for the time their capital is tied up in the security.
The Sharpe ratio requires that Rf represents the average return of the risk-free rate over the time period under evaluation. When analyzing a three-year period, investors must average the rate of return on T-bills over the same three-year period.
Traditionally, the shortest-dated bill is used since it is the least volatile. However, some argue the risk-free security should match the duration of the investment. Since equities theoretically have an infinite duration, one could argue that the longest-dated bill should be used.
Standard Deviation
The standard deviation of a security measures how far returns deviate on average from its mean (or average) return. Standard deviation is a common indicator used to measure the volatility, and thus the riskiness, of an investment. For instance, an investment that deviates only 3% from its mean on average is judged as less risky than an investment with a 20% average deviation. [Sharpe later revised the ratio to use a relative risk figure instead of standard deviation for the risk portion of the formula.]
CR: If we’re looking at the capital asset pricing model (CAPM), can the same case be made—just get the market return? [The CAPM calculates the expected rate of return based on beta and a risk-free rate. Bill Sharpe was one of the creators of the CAPM.]
WS: We know that in any given period, after cost, the average actively managed dollar is going to underperform a low-cost index fund. That’s just arithmetic. So you have arithmetic on your side if you invest in a low-cost broadly diversified index fund. You start with that advantage. On the other hand, if you are going to invest in an active fund, especially an expensive one, you’ve got to really be convinced that there’s something wrong with the market, that your investment managers have found it, and that the mistake is going to persist. Those are pretty big assumptions.
CR: Is this also the case with smart beta strategies?
WS: Yes, it’s of that genre. Most of the arguments at the end of the day are premised on persistent and continuing errors made by a large enough number of investors that they can be exploited. At least that is what I think I’m hearing. It’s possible that they may be right, but I would not put a lot of my money on that bet.
CR: I don’t know if you’ve seen it, but Robert Arnott has a paper where he’s taken the smart beta factors and turned them upside down. In some cases, he actually got better performance than his smart beta strategy. He said his strategies were very weird and uninvestable. [See the Stock Strategies article in this issue, Weight by Fundamentals, Not by Price, for more from Arnott on this.]
WS: No, I haven’t seen that. There’s a famous saying: If you torture a body of data long enough, it’ll confess to anything you want. People have looked for so many ways to beat the market using past data that of course they found ways that would have worked. But I would be much more comfortable if there were a story as to why, if everybody knew this history, it would still work. Most of these arguments don’t have such a story.
CR: Do you think it has more to do with behavioral finance, where people focus on what looks attractive?
WS: Yes, there are behavioral stories that suggest persistent mispricing, going back many years. For example, some people make the error that a good company means a good investment. They say, “Apple’s AAPL a great company, it must be a great investment.” Well, we all know that at one time the stock was sky-high and then it fell. The relevant question is whether a company is better than the market thinks it is. If you can reliably find such situations, you can indeed make abnormally high returns. Certainly a number of investors clearly make cognitive errors. And if enough do, and you think such errors will continue to dominate, then maybe you can exploit those people.
CR: What advice would you have for investors given your years of experience?
WS: Save more. Just save more; if you’re still working, you probably need to save more because you almost certainly aren’t saving enough. If you do the calculations based on having X when you get to retirement, you can begin to understand what X can do for you given all the uncertainties that come with later life. I’ll bet most investors would say, “I wish I had saved more, even though I had to give something up.” I just suspect that’s the case. So my guess is that you can pretty well predict somebody will wish they’d saved more.
Maybe when someone is making the saving decision, you can try to help them think more about their future self. Though there are many people who say “I’m not going to live long,” the evidence is that if you’re middle-class you are going to live a long time. You personally may not, but the odds are that you will.
One of the things that people can do using the illustrative software program available through my retirement income blog (RetirementIncomeScenarios.blogspot.com) is to type in their age and sex and their partner’s age and sex and see the probabilities that both will be alive, that one will be alive or that the other will be alive year by year in the future, based on a set of actuarial tables. Most people don’t want to look at such a graph, but I think it’s important to do so. Most who do this react by saying “that’s a long time, a really long time.” [Figure 1 is an example of the longevity graph from Sharpe’s software program, which is free to use.]
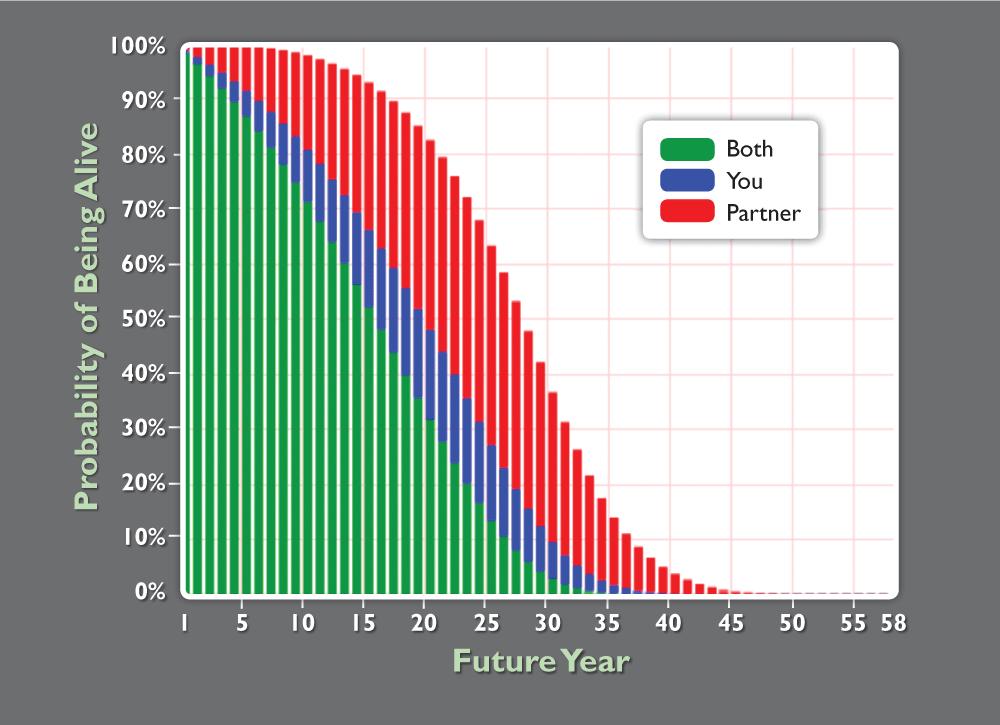
This chart shows the projected longevity for a husband age 66 and a wife age 63. The green bars show the probability of both spouses being alive at a given year in the future. The blue bars show the probability of just the husband being alive, while the red the bars show the probability of just the wife being alive. The horizontal (“X”) axis shows years with gridlines spaced in five-year increments. The vertical (“Y”) axis shows probabilities with gridlines spaced in 10-percentage-point increments.
The chart can be customized based on a couple’s age at scratch.mit.edu/users/wfsharpe. (Singles should set their partner’s current age at 120 so that he or she is treated as not being around in any future year.) Instructions on how to use the free software program are available on Bill Sharpe’s Retirement Income Scenarios blog (retirementincomescenarios.blogspot.com).
To be sure, there’s a lot of uncertainty as to how long a lifetime will be. And there are many questions about retirement income strategies. Do I need to save enough? Do I need to set up a retirement plan that allows me to invest in risky assets, or in riskless assets? Should I choose not to annuitize, and if so, will I be pretty sure that even if I live to be 102, that I’m going to be okay? That’s a very scary prospect when you think about it. I think that running some numbers may lead more people to annuitize, and if they’re still saving, to save more.
More generally this is a huge societal problem. We know longevity has increased, and probably will continue to do so to some extent. We know fertility rates have decreased and are unlikely to increase again. So the ratio of old people to working people is just going to continue to grow in almost every developed country and in some emerging countries. This is a really big problem and we’re not preparing sufficiently to deal with it as a society or as individuals.
CR: And, like you said, nobody has figured out what an optimal retirement income strategy is yet.
WS: No, but it is a good question. What academics like myself like is a really tough problem that’s also really important. This certainly qualifies. Of course, it would be nice if I thought I could solve it, or at least make a contribution to the solution. I’m not sure that I’m going to be able to make a major contribution because the problem is so complicated—but I’m trying. Of course luck is a large part of life, including research, so we will see.

Related

Portfolio Strategies
An Investor’s Guide to Smart Beta Strategies
Related

Financial Planning
Retirement Spending on Planet Vulcan: Longevity Risk and Withdrawal Rates
Discussion
FREE REPORT

Get your free copy of our special
report analyzing the tech stocks
most likely to outperform the
market.
Dave Gilmer from WA posted over 11 years ago:
Paul Harms from CA posted over 10 years ago:
Charles Rotblut from IL posted over 10 years ago:
You need to log in as a registered AAII user before commenting.
Log InCreate an account