


Richard Driehaus is a well-known champion of momentum investing, favoring companies that are exhibiting strong growth in earnings and stock price. His success landed him a spot on Barron’s 2000 All-Century Team—a group of 25 fund managers that includes such investment luminaries as Peter Lynch and John Templeton.
AAII constructed a Driehaus stock screen that seeks out smaller companies exhibiting increasing annual rates of earnings increases, recent price momentum and positive earnings surprises. AAII’s Driehaus screen was based upon an interview and discussion of his approach in the book “Investment Gurus” by Peter J. Tanous (New York Institute of Finance, 1997).
This issue’s First Cut modifies the Driehaus screen that is presented and tracked on AAII.com and built into AAII’s Stock Investor Pro fundamental stock screening and research database. Notably, we expanded the universe of passing companies beyond small- and mid-cap stocks and made the earnings surprise requirement less restrictive, requiring a 5% earnings surprise in lieu of 10%, to identify more stocks.
The heart of the Driehaus method is to identify companies with improving earnings growth rates. The First Cut looks for stocks whose year-to-year earnings growth rate is increasing. The screen examines the growth rates in earnings from continuing operations from year 4 to year 3, year 3 to year 2, year 2 to year 1, and from year 1 to the trailing 12 months, and requires an earnings growth rate greater than or equal to the rate that preceded it for each period. We also required positive earnings growth over the trailing 12 months compared to earnings in the preceding 12 months.
Driehaus suggests seeking firms with a “significant” positive earnings surprise, where the company’s actual announced earnings beat the consensus analyst estimates. Earnings estimates are based on expectations of the future performance of a company; surprises signal that the market has underestimated the company’s future prospects in its forecast. For our First Cut, we required a minimum positive earnings surprise of 5% or greater and required at least three analysts providing estimates.
The First Cut then looked for stocks with a positive price increase over the last four weeks and experiencing stronger relative price strength over the last 26 weeks than the median relative strength index for the firm’s industry. A positive relative strength index means that the stock or industry outperformed the S&P 500 index for the period, while a negative relative strength means it underperformed the S&P 500 for the period.
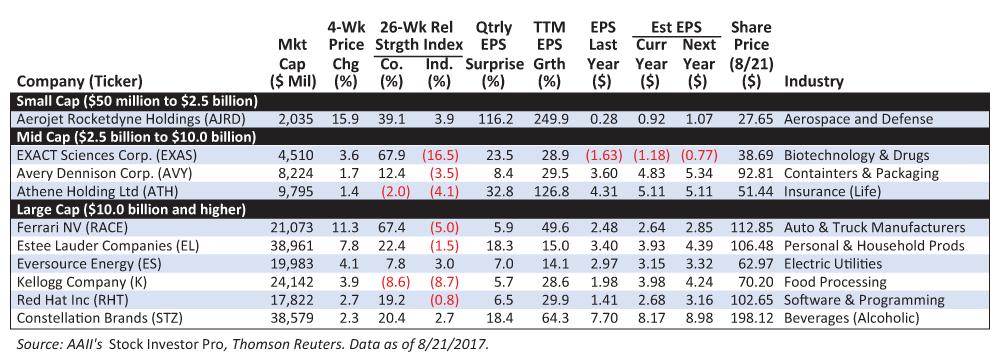
Richard Driehaus focuses most of his energies on small- to mid-cap stocks. Historically, small-cap stocks have done better than larger stocks, with the trade-off being greater volatility. By focusing on smaller companies with strong earnings growth rates, he hopes to identify the market giants of tomorrow. For this First Cut, we required a minimum market cap (share price times shares outstanding) of $50 million and divided the passing companies into market-cap segments, with the passing companies ranked by their four-week price change.
Momentum investing tends to be short term in nature, so it is helpful to have adequate liquidity or trading volume. For the First Cut, we required companies to have a daily trading volume that falls in the top 50% of the database and eliminated any foreign ADRs.
Criteria for Stock Investor Pro Users
| Field: | Operator: | Factor: | Compare to: | |
|---|---|---|---|---|
| ADR/ADS Stock | Is False | |||
| And | Exchange | Not Equal | Over the counter | |
| And | EPS Cont-Growth 12m | > | 0 | |
| And | EPS Cont-Growth 12m | >= | EPS Cont-Growth 1yr | |
| And | EPS Cont-Growth 1yr | >= | EPS Cont-Growth from Y3 to Y2 | |
| And | EPS Cont-Growth from Y3 to Y2 | >= | EPS Cont-Growth from Y4 to Y3 | |
| And | Quarterly Surprise-Percent | >= | 5 | |
| And | EPS Est Q0-Number | >= | 3 | |
| And | Price Change 4 week | > | 0 | |
| And | Relative Strength 26 week | >= | Industry Relative Strength 26 week | |
| And | Market Cap Q1 | > | 50 | |
| And | % Rank-Volume--Average Daily 10d | > | 50 |
Discussion
FREE REPORT

David Sprowl from Florida / Maine posted over 8 years ago:
John Bajkowski from IL posted over 8 years ago:
Howard Kosick from CA posted over 7 years ago:
Ted Hennessy from NH posted over 6 years ago:
Ted Hennessy from NH posted over 6 years ago:
You need to log in as a registered AAII user before commenting.
Log InCreate an account