

Related

AAII Stock Ideas

According to legend, the Holy Grail was the dish, plate or cup used by Jesus at the Last Supper. It was believed to possess miraculous powers.
Legend has it that the Grail was sent to somewhere in what is now Great Britain, where several guardians keep it secure and concealed from seekers. The search for the Grail is an important part of the lore surrounding King Arthur and his court.
The financial equivalent of the search for the Holy Grail is the quest for money managers who will deliver alpha. This quest is the topic of our recent book, “The Incredible Shrinking Alpha” (BAM Alliance Press, 2015), on which portions of this article are closely based.
Alpha is defined as returns above the appropriate risk-adjusted benchmark, which may or may not be the market or an index such as the S&P 500 index. The following history of asset pricing models is intended to provide understanding and context for the importance of measuring performance against an appropriate risk-adjusted benchmark.
Building on the work of Harry Markowitz, the trio of John Lintner, William Sharpe and Jack Treynor are generally given most of the credit for introducing the first formal asset pricing model, the capital asset pricing model (CAPM). It was developed in the early 1960s.
CAPM provided the first precise definition of risk and how it drives expected returns. It allowed us to understand whether an active manager who outperforms the market has generated alpha, or whether that outperformance could be explained by exposure to some factor. This is an important issue because active managers charge relatively high fees for the “promise” of alpha. If their outperformance can be explained by exposure to one or more factors—also often referred to as beta, or loading on a factor—there was no actual outperformance, or alpha, on a risk-adjusted basis. If that is the case, the high fees charged by active managers can no longer be justified. Exposure to various factors can be obtained in a less expensive way through lower-cost vehicles, such as index mutual funds and exchange-traded funds (ETFs). In other words, if an active manager’s above-market performance was due to loading on certain factors, investors paid a high price for alpha but actually received beta. And that exposure can be obtained more cheaply.
CAPM looks at risk and return through a “one-factor” lens—the risk and the return of a portfolio are determined only by its exposure to market beta. This beta is the measure of the equity-type risk of a stock, mutual fund or portfolio relative to the risk of the overall market. CAPM was the financial world’s operating model for about 30 years. However, like all models, it was by definition flawed or wrong. If such models were perfectly correct, they would be laws, like we have in physics. Over time, anomalies that violated the CAPM began to surface.
In 1981, Rolf Banz’s “The Relationship Between Return and Market Value of Common Stocks” found that market beta doesn’t fully explain the higher average return of small stocks. That same year, Sanjoy Basu’s “The Relationship Between Earnings’ Yield, Market Value and Return for NYSE Common Stocks” found that the positive relationship between the earnings yield (E/P) and average return is left unexplained by market beta. And in 1985, Barr Rosenberg, Kenneth Reid and Ronald Lanstein found a positive relationship between average stock returns and book-to-market ratio (B/M) in their paper, “Persuasive Evidence of Market Inefficiency.” [B/M is the inverse of the price-to-book-value ratio (P/B), though the latter is calculated using per share numbers.] The last two studies provided evidence that, in addition to a size premium, there also was a value premium.
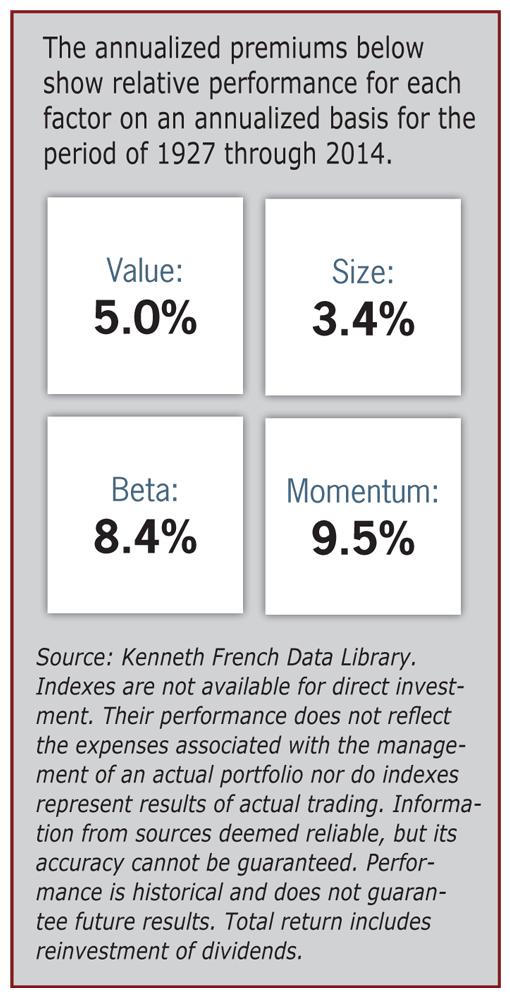
A 1992 paper, “The Cross-Section of Expected Stock Returns” by Eugene Fama and Kenneth French, basically summarized and explained these anomalies in one place. The essential conclusion from this paper was that CAPM explained only about two-thirds of the differences in returns of diversified portfolios and that a better model could be built using more than just the one factor. Fama and French proposed that, along with the market factor of beta, exposure to the factors of size and value explain the cross-section of expected stock returns. The Fama-French model greatly improved upon the explanatory power of CAPM, accounting for more than 90% of the differences in returns between diversified portfolios. From 1927 through 2014, the annual average premiums were:
Prior to the development of the three-factor model, actively managed funds could produce higher returns than a benchmark, such as the Russell 3000 index or the S&P 500 index, by “tilting” their portfolio to either small stocks or value stocks, thus giving them more exposure to the size and value factors than the benchmark index. The fund would then claim that its outperformance was, in fact, alpha. Today, regression analysis (a statistical process for estimating the relationships among variables) would show that their outperformance was simply the result of a greater exposure to certain factors. In effect, what once was alpha had now become beta, or loading on a factor, which could be purchased in a less expensive way.
With the inclusion of the value premium, the three-factor model went a long way toward explaining the superior performance of the superstar investors from the value school of Benjamin Graham and David Dodd. The anomaly these investors presented became less as alpha transformed into beta (loading on, or exposure to, a factor). Of course, this shouldn’t detract from how we should view the ingenuity of their work. After all, they employed these strategies before factors were added to the model. But, we aren’t yet done in shrinking alpha.
In 1997, Mark Carhart, in his study “On Persistence in Mutual Fund Performance,” was the first to use momentum, together with the Fama-French factors, to explain mutual fund returns. Momentum was initially published by Jegadeesh and Titman in 1993 and here is defined as the last 12 months of returns, excluding the most recent month. The momentum factor is the average return of the top 30% of stocks minus the average return of the bottom 30% as ranked by this measure. This new momentum factor made another significant contribution to the explanatory power of the model. For the period from 1927 through 2014, the annual average premium for the momentum factor was 9.5%. Figure 1 illustrates the premium for each factor in the four-factor model over the 1927 to 2014 period.
Since 1998, the four-factor model has been the standard tool used to analyze and explain the performance of investment managers and investment strategies. And once again, alpha had become beta—or loading on a factor—as the way to explain returns. Again, it is important to remember that this doesn’t take away anything from the active managers who were exploiting the momentum factor before academics added it to the model.
A recent contribution to the model, and one that helps further explain Warren Buffett’s superior performance, is from Robert Novy-Marx. His June 2012 paper, “The Other Side of Value: The Gross Profitability Premium,” provided investors with new insights into the cross-section of stock returns. Novy-Marx found that profitable firms generate significantly higher returns than unprofitable ones, despite having significantly higher valuation ratios.
Controlling for profitability—here defined as revenues minus cost of goods sold divided by assets—increases the performance of value strategies, particularly when value is defined by the book-to-market ratio. The most profitable firms earn average returns that are 3.7% per year higher than the least profitable firms. This idea has been extended to a quality factor, which captures a broader set of quality characteristics. In particular, high-quality stocks that are profitable, stable, growing and have a high payout ratio outperform low-quality stocks with the opposite characteristics. And once again, alpha has become beta.
Still, there remain anomalies that these factor models cannot explain. Kewei Hou, Chen Xue and Lu Zhang, authors of the September 2012 study, “Digesting Anomalies: An Investment Approach,” proposed a new four-factor model (market beta, size, investment and profitability) that went a long way to explaining many of the anomalies. An updated version has been accepted for publication in the Review of Financial Studies.
The authors defined their investment factor as the difference between the return on a portfolio of low investment-to-assets stocks and the return on a portfolio of high investment-to-assets stocks. They explain: “Intuitively, investment predicts returns because given expected cash flows, high costs of capital imply low net present values of new capital and low investment, and low costs of capital imply high net present values of new capital and high investment.” They noted that the investment factor is highly correlated (0.69) with the value premium, suggesting that this factor plays a similar role to that of the value factor. The investment factor earned a highly significant average return of 0.45% per month. (Because of its ability to eliminate many anomalies, this new four-factor model, which the authors named the q-factor model, may offer a compelling alternative to the Fama-French four-factor model as the workhorse asset pricing model. For that reason, a more detailed explanation of the model can be found in Appendix F of our book.)
As the “Digesting Anomalies” study shows, research on the definition, characteristics and interplay between factors continues to evolve. For some of these factors, such as size and value, investment companies offer a number of strategies explicitly delivering this exposure. For other factors, firms are adjusting the portfolio construction rules in order to increase exposure. With greater understanding and greater adoption, we see that alpha is continuing to become beta. The result is that the available pool of potential sources of alpha keeps shrinking. The best demonstration of how alpha becomes beta can be found in the study “Buffett’s Alpha.”
The “conventional wisdom” has always been that Warren Buffett’s success can be explained by his stock-picking skills and his discipline—his ability to keep his head while others are losing theirs. However, the 2013 study “Buffett’s Alpha,” authored by Andrea Frazzini, David Kabiller and Lasse H. Pedersen, provides us some interesting and unconventional answers. The authors found that, in addition to benefiting from the use of cheap leverage provided by Berkshire’s insurance operations, Warren Buffett bought stocks that are safe, cheap, high-quality and large. The most interesting finding in the study was that stocks with these characteristics tend to perform well in general, not just the stocks with these characteristics that Buffett buys.
High-quality companies have the following traits: low earnings volatility, high margins, high asset turnover (indicating efficiency), low financial leverage, low operating leverage (indicating a strong balance sheet and low macroeconomic risk) and low specific stock risk (volatility unexplained by macroeconomic activity). Companies with these characteristics have historically provided higher returns, especially in down markets.
In other words, it is Warren Buffett’s strategy, or exposure to factors, that explains his success, not his stock-picking skills. Frazzini and Pedersen, also the authors of the 2014 study “Betting Against Beta,” found that once all the factors—market beta, size, value, momentum, betting against beta, quality and leverage—are accounted for, a large part of Buffett’s performance is explained and his alpha is statistically insignificant.
Again, it is important to understand that this finding doesn’t detract in any way from Warren Buffett’s performance. After all, it took decades for modern financial theory to catch up with him and discover his “secret sauce.” And being the first, or among the first, to discover a strategy that beats the market is what will buy you that yacht, not copying the strategy after it is already well known and all the low-hanging fruit has been picked.
With that said, the findings do provide insight into why Warren Buffett has been so successful. His genius appears to be in recognizing long ago that these factors work. He applied leverage without ever resorting to a fire sale and stuck to his principles. Buffett himself stated in Berkshire’s 1994 annual report: “Ben Graham taught me 45 years ago that in investing it is not necessary to do extraordinary things to get extraordinary results.”
The bad news for today’s investors seeking alpha is that they face four hurdles that are becoming ever more difficult to overcome. First, the pool of available alpha has been shrinking, because what once was alpha is now recognized as beta. Second, the pool of victims that active managers can exploit to generate alpha is getting smaller, as unskilled and once-lucky investors abandon the quest for alpha and both individual and institutional investors persistently increase their allocations to passive strategies. Third, the level of competition is getting ever tougher as better data and technology are used by ever more skilled managers. And fourth, the amount of assets competing for the scarce resource is growing.
On the other hand, for individual investors who recognize that the quest for alpha is a loser’s game, the trends are all favorable. These investors benefit from the intense competition among providers of passively managed or structured funds. And competition from the many providers of ETFs, with their lower costs, has been driving expense ratios persistently lower. There are now many index products with fees of basis points in the single digits. This trend to lower expenses is making passive investing even more of a winner’s game. And that is contributing to a vicious circle for active investors. Lower costs are helping drive more investors to become passive, shrinking the pool of victims that can be exploited and raising the hurdles for the generation of alpha.
We now turn our attention to the world of bonds. Just as we have factor models for stocks, we have them for bonds as well. There are two factors that explain the vast majority of the differences in returns among bond portfolios: term risk (otherwise referred to as duration) and default risk (credit).
From 1926 through 2014, the annual average term premium was 1.9% and the annual average default premium was just 0.3%. These factors are referred to as risk factors and have earned premium returns as compensation for the incremental risks of their purchase. Note though that, historically, taking credit risk has not been well rewarded, especially after costs (the premium has been just 0.3% before implementation costs). Thus, actively managed bond funds could expect to outperform their benchmark, such as the Barclay’s Aggregate Bond Index, by tilting their portfolios to achieve more exposure to these factors. And when the funds outperformed, they would claim alpha. With the two-factor bond model, we can now determine whether returns are truly alpha, or simply exposure to the factors. And, as is the case with equity factors, exposure to bond factors can be achieved through low-cost, passively managed vehicles.
The bottom line is that the factor models not only have advanced our understanding of what drives the risks and expected returns of portfolios, but also enable us to separate alpha from beta. That, in turn, allows you to avoid paying the high fees of active management for delivering beta.
Let us summarize what we have discussed thus far. The goal of actively managed funds is to generate alpha—returns above an appropriate risk-adjusted benchmark. At this point, it is important to add that because the only way to generate alpha is to hold a different, less-diversified portfolio than the benchmark, any expected alpha should be sufficient to compensate for the increased idiosyncratic risk active managers assume by failing to fully diversify.
The bad news for today’s investors seeking alpha is that they face four hurdles, each of which is becoming ever more difficult to overcome. We’ve already discussed the first hurdle. The pool of available alpha has been shrinking, as what once was alpha is now recognized as beta. The other three hurdles, discussed more in depth in our book “The Incredible Shrinking Alpha,” are:
Conversely, for individual investors who recognize that the quest for alpha is a loser’s game, the trends are all favorable. These investors benefit from intense competition among providers of passively managed or structured funds. And competition from the many providers of ETFs, with their lower costs, has been driving expense ratios persistently lower. There are now many index products with single-digit basis point fees. This trend to lower expenses is making passive investing even more of a winner’s game. That, in turn, contributes to a vicious circle for active investors. Lower costs are helping drive more investors to become passive, further shrinking the pool of victims that can be exploited and again raising the hurdles for the generation of alpha.
The choice is yours. On one hand, you can choose to focus on trying to generate alpha. It may be exciting, but it is a loser’s game. While it may be possible to generate alpha, the odds of doing so are so poor that it is not prudent to try.
Alternatively, you can play the winner’s game. Focus on deciding how much exposure you want to each of the factors we have discussed, and then choose the vehicles that best allow you to build a globally diversified portfolio that implements your strategy in the most efficient manner. Doing that, and having the discipline to stay the course, provides you with the greatest odds of achieving your financial goals.
Generating alpha is so difficult that Charles Ellis called active management’s quest for it the “loser’s game.” The reason is not that it is impossible to generate alpha. Instead, it is that focusing your efforts on trying to find alpha is highly unlikely to prove productive. Thus, the prudent decision is to abandon the quest and play the winner’s game. Instead of focusing your efforts on generating alpha, you should focus on the four critical things you can actually control:
AAII Stock Ideas
Portfolio Strategies

Value Investing
Leo Belman from Md posted over 11 years ago:
Bruce Sansom from Alberta posted over 11 years ago:
Matthew Foley from CA posted over 11 years ago:
Matthew Foley from CA posted over 11 years ago:
Charles Rotblut from IL posted over 11 years ago:
Andrew Atkinson from CO posted over 11 years ago:
Samir Desai from TX posted over 11 years ago:
Phillip Devrou from LA posted over 11 years ago:
Charles Rotblut from IL posted over 11 years ago:
Phillip Devrou from LA posted over 11 years ago:
Warren Dagenbach from PA posted over 11 years ago:
John Wilson from Alberta, Canada posted over 10 years ago:
John Duguid from NJ posted over 10 years ago:
You need to log in as a registered AAII user before commenting.
Log InCreate an account