


Charles Rotblut leads a class in AAII's new Essential Investing Video Course. Go to https://www.aaii.com/ves for more information and to subscribe.
Each week, we ask AAII members a simple question: Do they feel the direction of the stock market over the next six months will be up (bullish), no change (neutral) or down (bearish)?
We refer to this question as the AAII Sentiment Survey. Since we started polling our members in 1987, our survey has provided insight into the moods of individual investors.
The survey has been become a widely followed measure. Its results are circulated by various organizations and media outlets, including Barron’s and Bloomberg. I have heard directly from, and indirectly of, many market strategists, investment newsletter writers and other financial professionals who follow the survey.
Can the results signal future market direction? In an update to my colleague Wayne Thorp’s 2004 article, “Investor Sentiment as a Contrarian Indicator” (Computerized Investing, September 2004), I look at the data and give perspective. The key to remember when reviewing the data is that a variety of indicators and criteria should be considered before making a tactical change in asset allocation.
Background of the AAII Sentiment Survey
The AAII Sentiment Survey is conducted each week from Thursday 12:01 a.m. until Wednesday at 11:59 p.m. AAII members participate by visiting the Sentiment Survey page (www.aaii.com/sentimentsurvey) on AAII.com and voting. The survey is open to all members, though a weekly email is sent to a rotating group of members reminding them to participate. Results of the survey are automatically tabulated by our database and published online early each Thursday morning. Prior to the year 2000, members responded by physically mailing a postcard back to the AAII offices. Response rates vary, though we would consider fewer than 100 votes to be low and more than 350 votes to be high. We do not track long-term response rates, though during the first four months of 2013, an average of 315 members took the survey each week.
The typical AAII member is a male in his mid-60s with a bachelor’s or graduate degree. AAII members tend to be affluent with a median portfolio size in excess of $1 million. The typical member describes himself as having a moderate level of investment knowledge and engaging primarily in fundamental analysis. This said, AAII has in excess of 160,000 members and simply due to the sheer size of our membership, there are wide variances in wealth, investment knowledge and investing styles. We also have many women members. This mix makes the AAII Sentiment Survey unique in that it conveys the attitudes of active, hands-on individual investors.
Historical Sentiment Readings
Bullish sentiment has averaged 38.8% over the life of the survey. Neutral sentiment has averaged 30.5% and bearish sentiment has averaged 30.6% over the life of the survey. (We round the bullish and bearish sentiment averages to 39.0% and 30.5% when reporting the weekly results.) These numbers equate to approximately four out of 10 AAII members expecting stock prices to rise and three out of 10 expecting prices to fall over the next six months on a typical week. This bullish slant aligns with history. The S&P 500 index was at 315 when the survey was first conducted; on May 2, 2013, the index stood at 1,583.
It is important to note that these numbers are averages. Over time, the results for all three choices have swung up and down. Within these swings, however, trends have emerged, allowing us to identify what is a typical reading, what is an unusual reading and what is an extraordinary reading. The extraordinary readings have had some correlations with market reversals, as I will soon explain.
A spreadsheet tracking the weekly readings can be downloaded from the AAII Sentiment Survey webpage. This spreadsheet lists the weekly results dating back to July 1987 and continues to be updated every Thursday on AAII.com.
What Counts as a Normal Reading?
Over time, the moods of individual investors swing from optimistic to pessimistic. These swings reflect attitudes toward the direction of the stock market, the strength or weakness of the economy, the quality of earnings and other macro factors impacting individual investors’ short-term outlook for stock prices. For example, during 2003 and 2004, AAII members stayed mostly bullish, a reflection of the rebound in stock prices and expansion of the U.S. economy. Conversely, during the bear market period of November 2007 through February 2009, AAII members largely stayed pessimistic about the market’s direction.
The survey’s results can be described as a pendulum that, at times, stays on one side or the other for prolonged periods. Both bullish and bearish sentiments have, at times, stayed above their respective historical averages for several weeks or months. At other times, the sentiment pendulum has stayed close to center, with individual investors’ moods staying largely within their historical averages.
Given these characteristics, it is useful to apply statistical analysis to the historical results. In addition to tracking the weekly readings, we maintain ongoing readings of standard deviations. Standard deviation calculates the distance from the average (or mean) a particular data point is. It is best described as an arc with elongated tails on the left and right side. The majority of the readings fall near the midpoint of the arc. Unusual readings occur in the lower left and right areas of the arc, areas known as +1 and –1 standard deviation. Extraordinary readings are those that are more than two standard deviations away from the historical average. A tiny fraction of readings are on the outer edges of the tails; these readings are three standard deviations away from the average. If the weekly results were to match up perfectly with statistical theory, we would see 68.2% of all readings within the midpoint of the arc, 27.2% qualifying as being unusual, 4.2% considered to be extraordinary and just 0.3% being extreme (more than three standard deviations away from average. Reality often does not fall into clearly defined buckets, but the statistical ranges help to convey the rarity of readings that are two or three standard deviations away from average.
Table 1 shows the historical average, lowest and highest readings for the Sentiment Survey, along with the percentages at one, two and three standard deviations away from the average for each choice. As previously stated, bullish sentiment has averaged 38.8% over the life of the survey. It has a standard deviation of 10.5%. This means readings between 28.3% and 49.3% are within the normal range over the historical results. Bullish sentiment is not considered to be extraordinarily high until it surpasses 59.8%. It is not considered to be extraordinarily low until it falls below 17.8%. The record high for optimism is 75.0%, set on January 6, 2000. The record low is 12.0%, set on November 16, 1990.
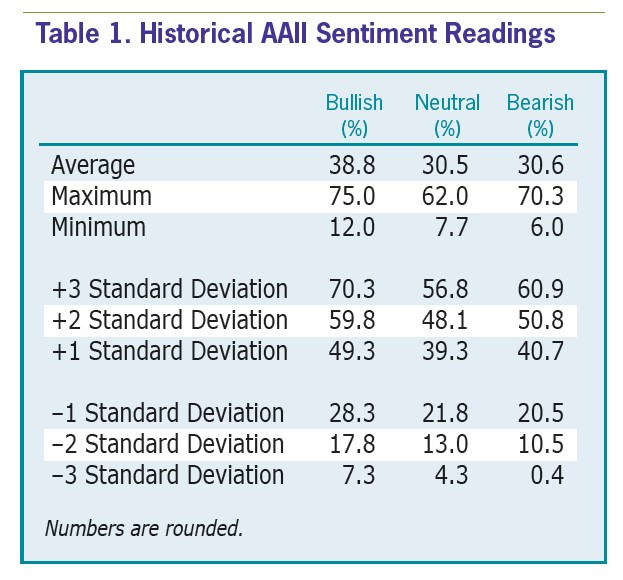
Neutral sentiment has averaged 30.5% over the life of the survey. It has a standard deviation of 8.8%, with typical readings ranging between 21.8% and 39.3% (numbers are rounded). The record high for neutral sentiment is 62.0%, set on June 3, 1988. The record low is 7.7%, set on October 9, 2008.
Bearish sentiment has averaged 30.6% over the life of the survey. It has a standard deviation of 10.1%, with typical readings ranging between 20.5% and 40.7%. Bearish sentiment is not considered to be extraordinary high until it surpasses 50.8%. It is not considered to be extraordinarily low until it falls below 10.5%. The record high for bearish sentiment is 70.3%, set on March 5, 2009. The record low is 6.0%, set on August 21, 1987.
Sentiment as a Contrarian Indicator
As you can see, the moods of individual investors are subject to swings and, at times, they reach extreme levels. Most of the time, the readings from our survey provide insight into the moods of individual investors, but are well within their typical historical ranges. Extraordinary readings are more interesting, however, since investor sentiment is considered to be a contrary signal. Market watchers tend to look at high (or low) levels of optimism or pessimism as a sign that sentiment has swung too far in one direction.
In order to determine whether there is a correlation between the AAII Sentiment Survey and the direction of the market, I looked at instances when bullish sentiment or bearish sentiment was one or more standard deviations away from the average. I then calculated the performance of the S&P 500 for the following 26-week (six-month) and 52-week (12-month) periods. The data for conducting this analysis is available on the Sentiment Survey spreadsheet, which not only lists the survey’s results, but also tracks weekly price data for the S&P 500 index.
Table 2 shows the data. The returns for the S&P 500 reflect price changes over six- and 12-month periods. The numbers exclude any management fees, transaction costs or other expenses an investor may have incurred by making trading decisions based on the results. Each reading above or below one standard deviation from the historical average was treated as a separate signal. This resulted in some overlap. For instance, there were four extraordinarily high bullish readings recorded between November 27, 2003, and December 26, 2003. Each reading was treated as a separate six- and 12-month period. The purpose of the analysis was to see what happened to the market following a high or low sentiment reading, not to optimize a trading strategy based on the survey’s results.
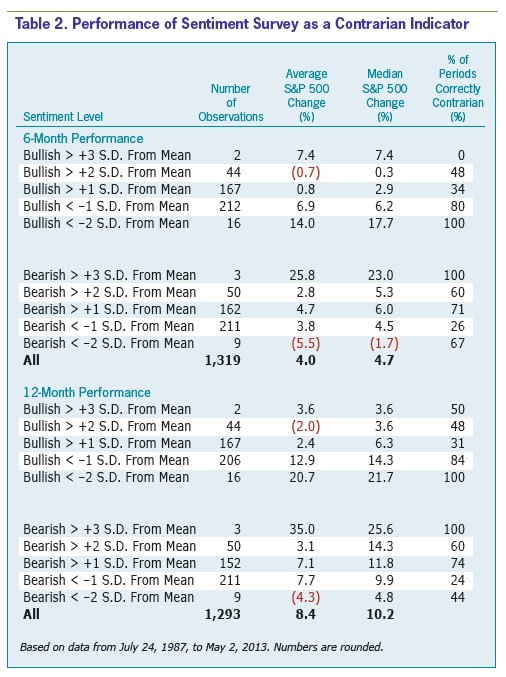
Any analysis of a potential market signal should include an analysis of market performance itself. This is why Table 2 also shows the average performance of the S&P 500 from July 24, 1987, through May 2, 2013. During this period there were 1,319 complete six-month periods with average and median gains of 4.0% and 4.7% for the S&P 500. The S&P 500 appreciated during 71.1% of these six-month periods and declined during 28.7% of them. There were also 1,293 12-month periods, during which the S&P 500 had average and median gains of 8.4% and 10.2%, respectively. The large-cap index rose during 77.7% of all 12-month periods and declined during 22.3% of them. (Any period with a change equal to or greater than +0.1% or –0.1% was counted as an up or down period.)
Bullish Sentiment
Neither unusual nor extraordinarily high levels of optimism are highly correlated with declining stock prices when the entire survey’s history is considered. The 44 periods with bullish sentiment readings more than two standard deviations above average were followed by a six-month fall in the S&P 500 only 48% of the time. The average six-month decline was 0.7%.
Bullish sentiment twice exceeded three standard deviations from its historical mean. The S&P 500 was higher six months after both readings and higher 12 months later after one of the readings. Both the average and median S&P 500 index six-month gains were 7.4%. Both the average and median S&P 500 index 12-month gains were 3.6%. Conclusions should not be drawn from these extreme readings since the sample size is so small.
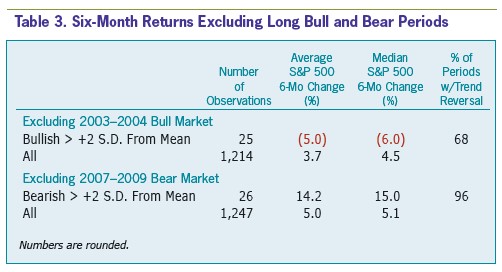
The failure of high optimism as a contrarian indicator can directly be linked to 2003 and 2004. During this period of economic expansion and rising home prices, the S&P 500 rose from 880 on January 2, 2003, to 1,213 on December 30, 2004. As shown in Table 3, when the 19 periods of extraordinary optimism during this period are excluded, the S&P 500 declined by an average of 5% during the six-month period following a bullish sentiment reading of more than two standard deviations above the mean. Furthermore, the S&P 500 subsequently declined 68% of the time.
Extraordinarily low levels of optimism have worked better as a contrarian signal. Bullish sentiment has been below two standard deviations of its historical mean 16 times during the survey’s history. The average and median six-month gains for the S&P 500 following these low readings were 14.0% and 17.7%, respectively. The average and median 12-month gains were 20.7% and 21.7%, respectively. The S&P 500 large-cap index rose every time after our survey indicated an extraordinarily low level of optimism.
Bearish Sentiment
Extraordinarily high levels of pessimism have a mixed record of being correlated with higher stock prices. On a six-month basis, the S&P 500 rose 60% of the time following a bearish sentiment reading more than two standard deviations above the historical mean. The average and median gains were 2.8% and 5.3%, respectively. On a 12-month basis, the S&P 500 rose 60% of the time, with an average gain of 3.1% and a median gain of 14.3%. The average increases in prices are well below the typical increases realized throughout the entire history of the survey, though the median increases are greater than the typical gains.
Bearish sentiment exceeded three standard deviations above its historical average on three occasions. Each of these occurrences was followed by large market gains. The average and median six-month gains were 25.8% and 23.0%, respectively. The average and median 12-month gains were 35.0% and 25.6%, respectively. Boosting these numbers is the record high bearish reading of 70.3% set on March 5, 2009, literally days before the bear market ended. The S&P 500 went on to rebound by 39.5% over the next six months and 56.9% over the next 12 months.
Like bullish sentiment, bearish sentiment had a period where high readings were repeatedly recorded. During the bear market period of November 2007 through February 2009, pessimism was more than two standard deviations above its historical mean 24 times. Excluding this period increases the correlation between extraordinary pessimism and six-month market gains to 96%, as shown in Table 3. The S&P 500’s six-month gain averaged 14.2%, with a median rise of 15.0% The index’s 12-month gain was an average 19.9%, with a median rise of 22.2%.
Low levels of pessimism also have a mixed correlation with future poor market performance. Bearish sentiment has been more than two standard deviations below its historical mean on nine occasions. These readings have been followed by six-month declines 67% of the time and 12-month declines 44% of the time. The average and median six month declines are 5.5% and 1.7%, respectively. The S&P 500 has declined by an average 4.3% during the 12-month period following an extraordinarily low bearish sentiment reading, but gained 4.8% when the median change is measured instead.
Sentiment’s Role as a Market Indicator
When our Sentiment Survey was started in 1987, there was little data on the moods of individual investors. Since that time, our survey has developed a following for both its insights and as its role as a potentially contrarian indicator for market direction. As the data shows, extraordinarily low levels of optimism have consistently preceded larger-than-average six- and 12-month gains in the S&P 500.
Sentiment is not a flawless contrarian indicator, however. Though unusual, bullish and bearish sentiment readings above or below one standard deviation from their historical average have a mixed record of signaling market direction. Extraordinarily high bullish sentiment and extraordinarily low bearish sentiment (two standard deviations away from the average) have generally worked well, with the exception of two notable periods.
It will be many years before we know whether the periods of 2003–2004 and November 2007–February 2009 were mere blemishes on the survey’s record as a contrarian indicator or a sign that both optimism and pessimism can remain at high levels for an extended period of time. I tend to think the latter will be the case, given long-term market history.
The failure of sentiment to work perfectly highlights two important points. Though correlations between sentiment levels and market direction have appeared in the past, the AAII Sentiment Survey does not predict future market direction. Overly optimistic and pessimistic investor attitudes are characteristics of market tops and bottoms, but they do not cause stock prices to change direction. Rather, it is changes in expectations of future earnings and economic and valuation trends that move stock prices. The timing of such changes has proven to be difficult to predict with accuracy.
This leads to my second concluding point: Never rely on a single indicator when forecasting market direction. Rather, consider a variety of factors—including prevailing valuations, economic data, Federal Reserve policy, government policies and other prevailing macro trends—and allow for a large margin of error in your forecast. As the saying attributed to John Maynard Keynes goes, the market can stay irrational longer than you can stay solvent.
Chicago AAII Sub Chapter Member from Illinois posted over 13 years ago:
Expat Member from ex-NY posted over 13 years ago:
Rick Schoenherr from Alabama posted over 13 years ago:
Steve from Indiana posted over 13 years ago:
Carl from Florida posted over 13 years ago:
Marc from NH posted over 13 years ago:
Edward from Utah posted over 13 years ago:
Bob Bubala from IN posted over 13 years ago:
Robert Smith from CA posted over 13 years ago:
Chris Johenning from OH posted over 13 years ago:
Tom Milne from Cal, Ohio posted over 13 years ago:
Daniel Ballisty from CA posted over 13 years ago:
Mark from MI posted over 13 years ago:
George Muzea from NV posted over 12 years ago:
Tim Mecke from KS posted over 12 years ago:
Charles Rotblut from IL posted over 12 years ago:
Fred Gerbracht from CA posted over 12 years ago:
Charles Rotblut from IL posted over 12 years ago:
Richard from CA posted over 12 years ago:
Bill Renaud from TX posted over 12 years ago:
James from NY posted over 11 years ago:
Mark H. from TX posted over 7 years ago:
CHARLES B from WA posted over 5 years ago:
BUD S from WA posted over 4 years ago:
GREGORY M from CA posted over 4 years ago:
ROBERT A from NC posted over 4 years ago:
Dan C from CA posted over 4 years ago:
You need to log in as a registered AAII user before commenting.
Log InCreate an account