

Related

Portfolio Strategies
Only six months, on average, have separated the end of one decline and the start of the next one, but recoveries have been quick.
by Sam Stovall | October 2017

The S&P 500 index bottomed on February 11, 2016, from its 14%+ correction that started on May 21, 2015.
Between then and (this article’s date of) September 1, 2017, the S&P 500 had not stumbled by more than 5%. Is such a streak rare? Yes. Since World War II, there have been 56 pullbacks (declines of 5.0% to 9.9%), 21 corrections (–10.0% to –19.9%) and 12 bear markets (–20%+). On average, only six months have separated the end of one decline of 5% or more and the start of the next 5%+ decline. And those six months don’t include the time it took to get back to breakeven!
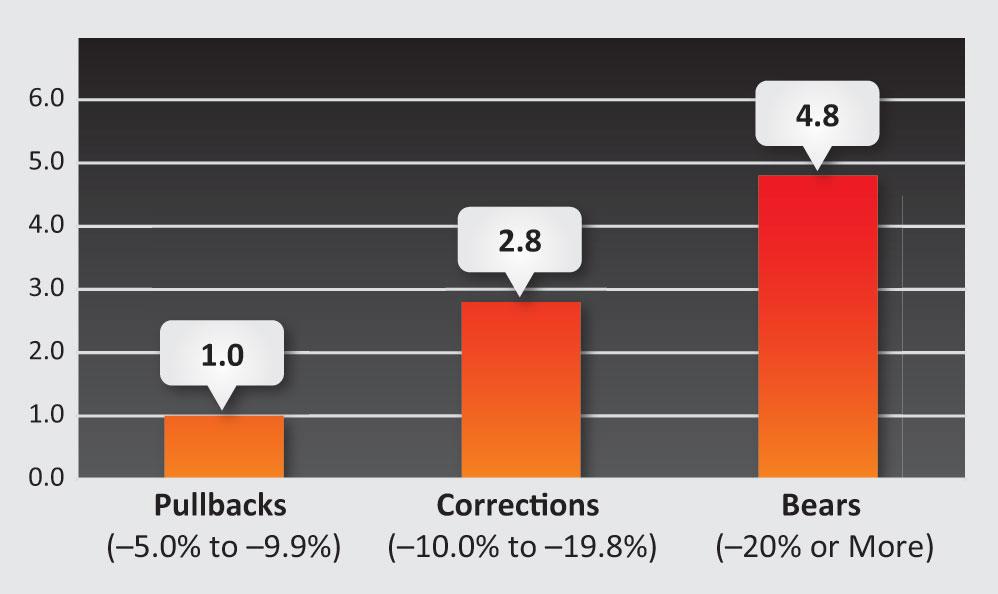
Another way of displaying the frequency of market declines is by simply dividing the number of bull market years since World War II by the count of each decline type. By this method, pullbacks have occurred every year, on average, while corrections happened every 2.8 years and the S&P 500 fell into a new bear market every 4.8 years (Figure 1).
It’s been said that fear and greed are the two emotions that drive the markets. However, one could argue that fear is the dominant emotion, since investors’ two greatest fears are losing money on the way down, and then missing out on the way back up. So if the possibility of “investing at the top” is an overriding worry for investors, then understanding the speed with which the market has recovered from these retreats might serve as their “virtual Valium.” With that in mind, Table 1 summarizes the count, magnitude and duration of the average S&P 500 pullback, correction and bear market since World War II. More importantly, it also shows the speed with which the S&P 500 got back to breakeven from these declines.
Table 1. S&P 500 Price Declines (December 1945 Through July 2016)
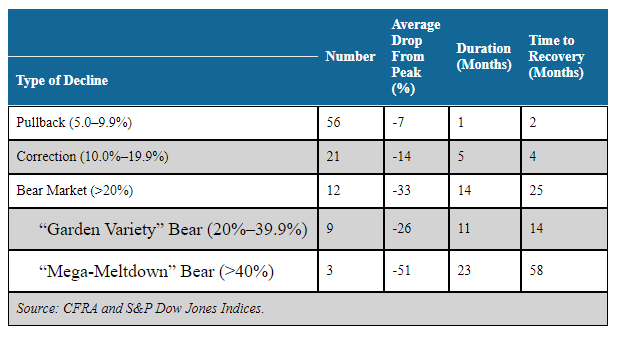
The 56 pullbacks since December 31, 1945, dragged down the market by an average of 7%, taking about one month to go from peak to trough. However, the S&P 500 then took an average of only two months to recover all that was lost during these declines. What’s more, the market took only about four months to recover fully from declines of 10.0% to 19.9%. So in greater than 85% of all declines of 5% or more since World War II, the market got back to breakeven in an average of only four months or fewer! Finally, the S&P 500 took an average of only 14 months to recover from the more typical “garden-variety” bear market (declines of 20% to 39.9%), causing one to conclude that if an investor can’t wait a year, then they probably have no business investing in equities!
Conversely, unless you have a fool-proof indicator of when declines are going to strike—and how far they will end up falling—you are probably better off taking advantage of these declines (rather than running from them) by buying instead of bailing. Indeed, had one put money to work at each 7% decline threshold, they would have looked like a terrific market timer.
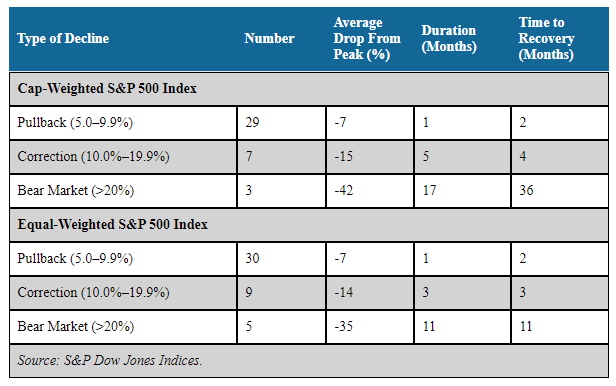
Another question investors have asked is how they would have fared investing in the cap-weighted S&P 500 index versus the S&P 500 Equal Weight index. Table 2 compares the count, magnitude and recovery times for the two indexes since December 31, 1989, which is as far back as S&P Dow Jones Indices has data on the S&P 500 Equal Weight. Even though both indexes performed similarly during pullbacks and corrections, the biggest differential was seen during bear markets. Since 1990 the cap-weighted S&P 500 endured three bear markets: 1990, 2000–02 and 2007–09. It declined by an average of 42% over a 17-month period, and then required an average of 36 months to get back to breakeven. The S&P 500 Equal Weight, on the other hand, endured five bear markets, three of which were aligned with the cap-weighted S&P 500 (1990, 2001–02 and 2007–09), along with two more in 1998 and 2011 when the cap-weighted S&P 500 came very close (falling 19.3% and 19.4%, respectively), but did not drop below the 20% decline threshold needed to be labeled a bear market. Yet the S&P 500 Equal Weight’s bear markets materialized more quickly than the cap-weighted S&P 500’s, requiring an average of 11 months to fall from peak to trough versus 17 months for the S&P 500. In addition, the S&P 500 Equal Weight required fewer months to get back to breakeven, at 11 months on average. Even if we include the recovery times for the S&P 500 Equal Weight’s near-bear declines in 1998 and 2011, the S&P 500’s average recovery time was still much longer at 23 months, more than twice what the S&P 500 Equal Weight required to fully recover from these retreats.
Table 2. S&P 500 Average Decline and Recovery Durations
(December 1989 Through July 2017)
Taking this comparison one step further, a buy-and-hold investor in the S&P 500 Equal Weight would have been pleased by the benchmark’s long-term return relative to the cap-weighted S&P 500. From December 31, 1989, through December 31, 2016, the compound annual growth rate for the S&P 500 Equal Weight was 11.0% versus 9.4% for the S&P 500. Granted that if Sir Isaac Newton had a fourth law, it might have been “For every return, there is an equal and relative rise in risk.” As a result, it should come as no surprise that the S&P 500 Equal Weight’s standard deviation of annual returns (a measure of volatility) at 18.6 is higher than the cap-weighted S&P 500’s 17.6. However, an investor might find this increased volatility worth it when looking at the frequency of outperforming the cap-weighted S&P 500. On a rolling monthly lookback of one, three, five, 10 and 20 years, the S&P 500 Equal Weight’s total return exceeded that of the cap-weighted S&P 500 58%, 69%, 77%, 94% and 100% of the time, respectively (Figure 2).

A comparison of the cap-weighted S&P 500 with the S&P 500 Equal Weight naturally leads one to ask if there is a meaningful difference between the Russell 2000 index and the S&P SmallCap 600 index. Looking back to December 31, 1994, the introduction of the S&P SmallCap 600, we see that all three decline types looked similar for both, with the S&P SmallCap 600 enduring a greater number of pullbacks and corrections, but one less bear market (Table 3). The decline durations were also fairly similar for all three types.
Table 3. Small-Cap Average Decline and Recovery Durations
(December 1994 Through July 2017)
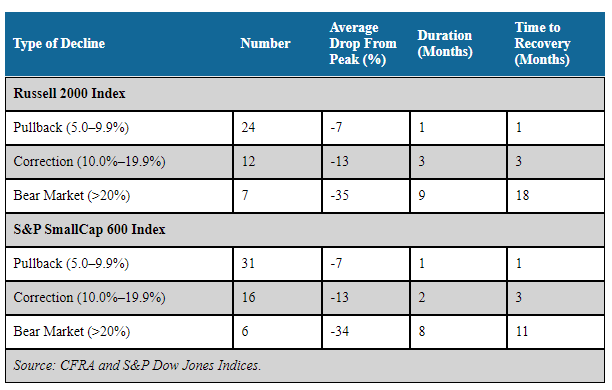
The biggest difference, however, came in bear market recovery times. For the Russell 2000, it took an average of 18 months to get back to breakeven from its seven bear markets, but only 11 months on average for the S&P SmallCap 600 to recover from its six bears. Even if we included in the S&P SmallCap 600’s count its correction in 2010 that was tagged as a bear market for the Russell 2000, the average recovery time for the S&P SmallCap 600 was even shorter, at an average of 10 months.
So there you have it. History says the S&P 500 has incurred declines of 5% or more every six months, on average, since World War II. Yet a review of market retreats and recoveries has shown that in 85% of all declines of 5% or more, the S&P 500 got back to breakeven in an average of four months or fewer. As a result, investors would have been better off thinking opportunistically by buying rather than bailing. Yet an even more intimate understanding of relative benchmark performances offered investors an edge. Since December 31, 1989, not only did the S&P 500 Equal Weight take less time to trace out the average peak-to-trough decline in bear markets versus the cap-weighted S&P 500, but it also required less than half the time to fully recover from those retreats. In addition, on a rolling monthly lookback from one to 20 years, the S&P 500 Equal Weight’s total return exceeded that for the cap-weighted S&P 500 58% to 100% of the time.
Taking this “battle of the benchmarks” to the small-cap level, history also shows that while the number, magnitude and duration of declines were similar for both the Russell 2000 and the S&P SmallCap 600, the S&P SmallCap 600 got back to breakeven from bear markets nearly 40% faster.
So, like ripping off a band aid, history suggests, but does not guarantee, that the S&P 500 Equal Weight and the S&P SmallCap 600 may offer attractive alternatives to their more popular peers when it comes to enduring painful retreats and anxiety-filled recoveries in the future.
Portfolio Strategies



Joe Betz from New York posted over 8 years ago:
Charles Rotblut from IL posted over 8 years ago:
Lawrence Bugh from TX posted over 8 years ago:
Russell Kidd from CA posted over 8 years ago:
Jared Stein from ID posted over 7 years ago:
Hugh Poling from WA posted over 6 years ago:
BK Gupta from Tennessee posted over 6 years ago:
RONALDO J from MD posted over 5 years ago:
BARRY J from TX posted over 4 years ago:
ADRIAN W from IL posted over 3 years ago:
You need to log in as a registered AAII user before commenting.
Log InCreate an account