

Related

Portfolio Strategies

There’s good news and bad news.
First, the good news: We’re living longer. Now, the bad news: It costs to maintain a parking spot on this planet. Building a retirement portfolio that won’t run out before we do is a significant challenge of the new “living longer” era.
This article analyzes various portfolios and how long they survived over 55 rolling 35-year periods from 1926 through 2014. Additionally, the assortment of retirement portfolios were tested under several different withdrawal rates. As will be seen, when the initial withdrawal exceeds 5% of the portfolio’s value at retirement and is adjusted upward annually in response to inflation, nearly all of the portfolios experience a significant increase in the failure rate.
There are four core asset classes that we can measure back to 1926: U.S. bonds, U.S. large-cap stock, U.S. small-cap stock and cash. These asset classes represent the building blocks of a retirement portfolio.
Over the 89-year period from 1926 through 2014, U.S. bonds averaged an annualized return of 5.4% with a standard deviation of 5.7%, using returns for the Ibbotson U.S. Intermediate Government Bonds index from 1926 through 1975 and the Barclay’s Capital Aggregate Bond index 1976–2014. [Editor’s note: Standard deviation is a measure of volatility, with higher numbers implying greater price fluctuations.] The worst one-year return for U.S. bonds was –2.9%, in 1994. Over the 89 years, there were nine years in which U.S. bonds had a negative return—or just over 10% of the time. The average loss was –1.3% during those down years for bonds.
U.S. bonds have done a good job avoiding losses (in nominal terms) over the last eight-plus decades. However, bonds have also experienced protracted periods of very low returns, which creates a distinct challenge in a retirement portfolio if the returns are below the withdrawal rate. For instance, U.S. bonds experienced a 29-year period (from 1941 through 1969) where the average annualized return was a mere 2.2%. During those same years, large-cap U.S. stocks averaged annualized gains of 12.8% and small-cap U.S. stocks averaged annualized gains of 18.6%. This simple observation reminds us of the value in diversifying, particularly during the retirement years.
Large-cap U.S. stocks (as measured by the S&P 500 index) produced an average annualized return of 10.1% from 1926 through 2014, but with a standard deviation of return of 20.1%. Large-cap stocks endured 24 negative years, or 27% of the time since 1926. The largest loss was 43.3% in 1931. The average loss was 13.6%.
Small-cap U.S. stocks (as measured by Ibbotson’s Small-Company Stock index from 1926 through 1978 and the Russell 2000 index from 1979 through 2014) have an even more colorful past. Over the past 89 years, small U.S. stocks have produced an average annualized return of 11.4% and a standard deviation of 31.8%. The biggest one-year loss was 58.0%, which occurred in 1937. Small U.S. stocks have experienced a one-year loss 28 times since 1926, or nearly 32% of the time. The average loss during those 28 years was 16.8%.
Finally, there is the performance of cash (as measured by the 90-day U.S. Treasury bills). From 1926 through 2014, cash had an average annualized return of 3.6% and a standard deviation of return of 3.3%. Its worst one-year return was a decline of 0.02%, which occurred in 1938. This was the only year with a nominal loss (in nominal terms, not in inflation-adjusted terms) for cash.
Which asset class is the best choice for a retirement portfolio? Or, more correctly, what combinations of these assets are best suited to carry a retiree through the retirement years without running out of money? We will now examine the analysis of various retirement portfolios that were built with different asset classes or combinations of asset classes.
A dated, but well-known, notion is to build a retirement portfolio that has a bond allocation equal to your current age—often referred to as the “age-in-bonds” approach. Bonds certainly present less volatility than stocks, but that is not the only consideration when building a retirement portfolio. There is also a need for growth in a retirement portfolio. A retirement portfolio needs to serve two goals: control downside risk and achieve a reasonable rate of growth.
Another important issue in a retirement portfolio is the sequence of returns; that is, the order in which returns occur has a dramatic impact on the longevity of a retirement portfolio. Market-based losses (or very low returns) in the early years (just after the person has retired) can be disastrous to the longevity of the portfolio. Thus, a retirement portfolio needs to be sufficiently diversified to minimize “timing-of-returns” risk. Building a retirement portfolio that has a very large allocation in any one asset class is simply asking for trouble because of the lack of diversification.
Six index-based retirement portfolios were analyzed in this study:
The time frame of this analysis of retirement portfolio durability was 1926 to 2014, over which there were 55 rolling 35-year periods. The start of each 35-year retirement period was assumed to begin at age 65. Each portfolio was analyzed over all of the 55 rolling periods. A starting balance of $250,000 at age 65 was assumed. Five different initial rates of withdrawal were employed, ranging from 3% up to 7%. The initial withdrawal rate specified the amount of the first year’s withdrawal from the portfolio. Thus, using an initial withdrawal rate of 3%, the first year’s withdrawal was $7,500. The next year’s withdrawal was determined by the cost-of-living adjustment (COLA), which was assumed to be 3% in this study. The COLA is the equivalent of an inflation factor. Based on the 3% COLA, the withdrawal in the second year was $7,725, in the third year $7,957, and so on. The annual withdrawals occurred at the end of each year.
The “survival” analysis of all six retirement portfolios is reported in Tables 1 and 2.
Table 1 reports the percentage of time each portfolio remained solvent until age 100. The all-cash portfolio was able to survive to age 100 in just over half of the rolling 35-year periods (assuming a 3% initial withdrawal rate). At a 6% initial withdrawal rate, an all-cash portfolio never survived to age 100. The all-bond portfolio did not fare much better than an all-cash portfolio.
Table 1. Likelihood of a Retirement Portfolio Lasting 35 Years
The data below shows the frequency at which each portfolio lasted until a person retiring at age 65 lived to age 100, given a specified withdrawal rate. The withdrawal rate was the initial distribution taken from a starting balance of $250,000. Subsequent withdrawals were taken annually and were increased each year by 3% to account for increases in the cost of living. The data is based on analysis of 55 rolling 35-year periods between 1926 and 2014. Values below 100% indicate the portfolio ran out of money during at least some of the rolling 35-year periods.
|
|
% Likelihood of Portfolio Lasting 35 Years | ||||
| Withdrawal Rate | 3% | 4% | 5% | 6% | 7% |
| 100% Cash Portfolio | 56.4 | 41.8 | 29.1 | 0.0 | 0.0 |
| 100% Bond Portfolio | 69.1 | 43.6 | 30.9 | 23.6 | 9.1 |
| Age-in-Bonds Portfolio | 100.0 | 81.8 | 54.5 | 25.5 | 12.7 |
| 40% Stock/60% Bond Portfolio | 100.0 | 96.4 | 81.8 | 34.5 | 16.4 |
| 60% Stock/40% Bond Portfolio | 100.0 | 96.4 | 89.1 | 69.1 | 43.6 |
| Four-Asset Portfolio* | 100.0 | 98.2 | 89.1 | 83.6 | 50.9 |
| *25% large stock, 25% small stock, 25% bonds, 25% cash. | |||||
| Data source: Lipper, author calculations. | |||||
The age-in-bonds portfolio was markedly superior to the all-bond portfolio at the lower withdrawal rates of 3% to 5%. At higher withdrawal rates (6% and 7%) all of the portfolios with high amounts of cash or bonds had very low survival rates. This is particularly evident when comparing the 40/60 and 60/40 portfolios at the 6% and 7% withdrawal rates—with the 60% stock/40% bond portfolio being clearly superior—indicating that a higher allocation to stocks (and therefore a correspondingly lower allocation to bonds) was needed to withstand a higher withdrawal rate. The overall winner was the diversified four-asset portfolio, which had the highest survival rate (or tied for the highest survival rate) across all five withdrawal rates.
Table 2 shows the frequency of each portfolio lasting at least 20 years (from age 65 to 85). Once again, the diversified four-asset portfolio had the highest frequency of survival for 20 years at the higher withdrawal rates of 6% and 7%. The clear message is that a retirement portfolio needs to have a material allocation to equities in order to support higher withdrawal rates (rates above 5%). I’m not advocating a high initial withdrawal rate, but as many retirees are entering into retirement with inadequate account balances it is inevitable that many will require a withdrawal rate higher than 5%.
Table 2. Likelihood of a Retirement Portfolio Lasting 20 Years
The data below shows the frequency at which each portfolio lasted at least 20 years when retiring at age 65. The withdrawal rate was the initial distribution taken from a starting balance of $250,000. Subsequent withdrawals were taken annually and were increased each year by 3% to account for increases in the cost of living. The data is based on analysis of 55 rolling 35-year periods between 1926 and 2014. Values below 100% indicate the portfolio ran out of money during at least some of the rolling 35-year periods.
|
|
% Likelihood of Portfolio Lasting 20 Years | ||||
| Withdrawal Rate | 3% | 4% | 5% | 6% | 7% |
| 100% Cash Portfolio | 100.0 | 81.8 | 49.1 | 34.5 | 27.3 |
| 100% Bond Portfolio | 100.0 | 100.0 | 69.1 | 36.4 | 25.5 |
| Age-in-Bonds Portfolio | 100.0 | 100.0 | 100.0 | 85.5 | 47.3 |
| 40% Stock/60% Bond Portfolio | 100.0 | 100.0 | 100.0 | 90.9 | 69.1 |
| 60% Stock/40% Bond Portfolio | 100.0 | 100.0 | 96.4 | 90.9 | 80.0 |
| Four-Asset Portfolio* | 100.0 | 100.0 | 98.2 | 94.5 | 89.1 |
| *25% large stock, 25% small stock, 25% bonds, 25% cash. | |||||
| Data source: Lipper, author calculations. | |||||
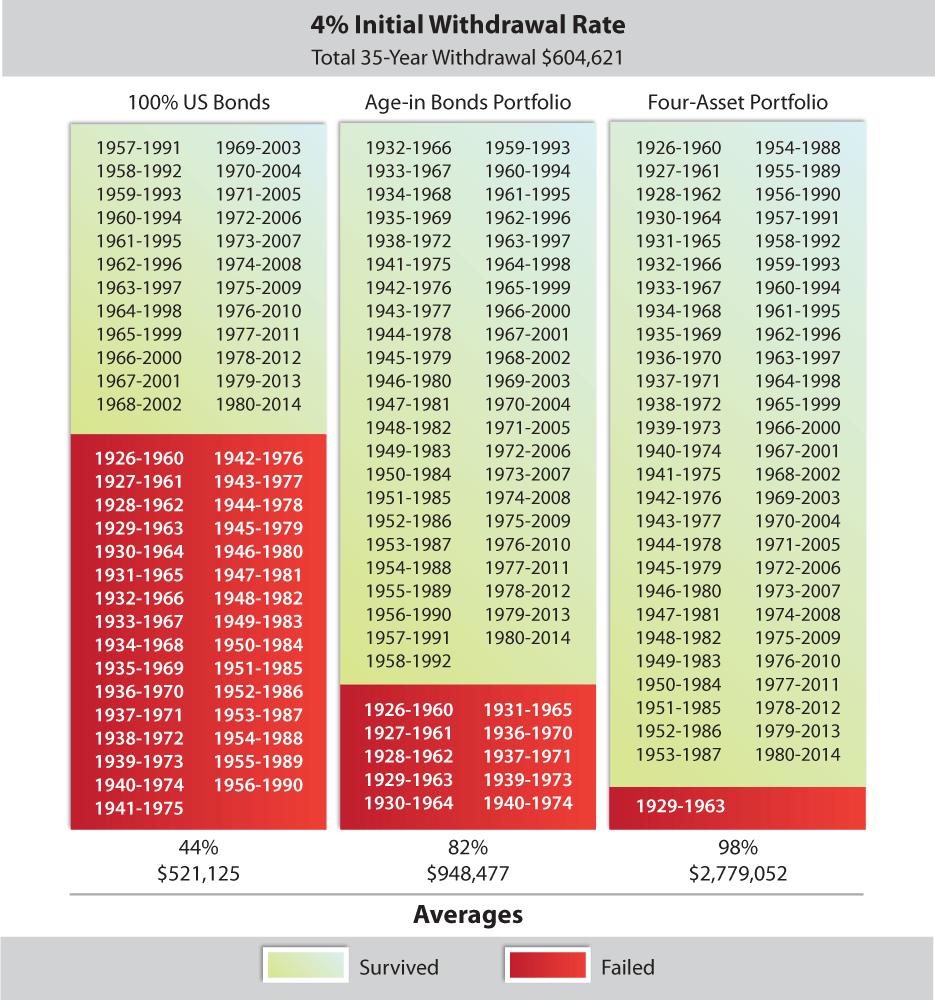
The viability of retirement portfolios is highly time-frame-dependent—meaning that the specific 35-year period being studied can make a big difference in the outcome. Figure 1 shows the years the 100% U.S. Bonds Portfolio, the Age-in-Bonds Portfolio and the Four-Asset Portfolio succeeded and failed assuming a 4% rate. The success rates and the average ending balance are also shown. On AAII.com, an additional table (Table 3) shows the ending account balance (at age 100) in each of three portfolios over 55 different 35-year periods assuming a 3%, 4% or a 5% withdrawal rate. In Table 3, numbers in red represent the age at which the retiree ran out of money (assuming retirement began at age 65). Numbers in black represent the balance after 35-years (at age 100).
For a retiree using an all-bond approach, the first 31 rolling 35-year periods (1926–1960 through 1956–1990) were nail-biters, as a 100% bond retirement portfolio was never able to last for the full 35 years with a 4% or a 5% initial withdrawal rate and an assumed 3% annual cost-of-living adjustment. At a 5% initial withdrawal, a 100% bond retirement portfolio lasted until age 100 only 31% of the time. In those cases where it did have a positive balance when the investor reached age 100, the average account was just $270,000, a comparatively small amount. Bond returns averaged 4.6% during the 1930s, 1.8% during the 1940s, 1.3% during the 1950s, and 3.5% during the 1960s. No wonder the all-bond portfolio ran out of gas.
In more recent decades, an all-bond portfolio has fared considerably better. But remember that U.S. interest rates began declining in 1982, which produced a tailwind for bond returns during the last 33 years. Bonds produced an average 10-year return of 7.0% during the 1970s, 12.4% during the 1980s, 7.7% during the 1990s and 6.3% between 2000 and 2009. Between 2010 and 2014, U.S. bonds have averaged 4.5%. Over all 55 rolling 35-year periods from 1926 to 2014, the all-bond portfolio had a success ratio of 69% at a 3% withdrawal rate, a 44% success ratio at a 4% withdrawal rate, and a 31% success ratio at a 5% withdrawal rate. (Success ratio is defined as the percentage of times the portfolio lasted to age 100).
The age-in-bonds portfolio was a considerable improvement to the all-bond portfolio at a withdrawal rate of 3% or 4%. A modest allocation to U.S. large-cap stocks (35% at age 65, 20% at age 80, 10% at age 90, etc.) was very beneficial. At a 3% initial withdrawal rate, the success ratio was 100%. At a 4% initial withdrawal rate, the success ratio was 82%. At a 5% initial withdrawal ratio, the success ratio was 55%.
The equally weighted four-asset portfolio worked the best. At a 3% initial withdrawal rate, this portfolio had a 100% success ratio. At a 4% withdrawal rate, the success ratio was 98%. Even at a 5% withdrawal rate, the success ratio was 89%. Moreover, the average ending balance for the four-asset portfolio at age 100 was nearly $2 million at a 5% withdrawal rate compared to less than $489,000 for the age-in-bonds portfolio (in those years in which each portfolio lasted until age 100).
The value of multi-asset diversification is clearly illustrated in this analysis. In this case, each of the four asset classes was equally weighted and rebalanced annually. As there are many more asset classes (and investable products) now available compared to the 1930s, it is reasonably simple to build a broadly diversified, multi-asset class retirement portfolio using a variety of mutual funds and/or exchange-traded funds.
The importance of a building a diversified portfolio for retirement has been clearly illustrated—particularly at higher initial rates of withdrawal.
For those retirees seeking an initial withdrawal rate of 5% or higher, it will be essential to build a diversified portfolio that has growth potential combined with prudent downside protection—the hallmarks of what diversification is able to achieve. An all-bond portfolio or an age-in-bonds approach ignores the virtues of diversification when it is arguably needed the most—during the retirement years.
There is no perfect retirement portfolio because every investment faces some type of risk, whether it’s volatility risk, interest rate risk, inflation risk, currency risk, etc. The key is to build a portfolio that is assembled in such a way that it contains asset classes that address each unique risk while maintaining adequate exposure to needed portfolio growth.
Diversification across a variety of asset classes is one such way. While it is not perfect, a lack of diversification is likely to be far less perfect.
Portfolio Strategies

Financial Planning

Growth Investing

Madeleine Greene from MD posted over 11 years ago:
Kenneth Jones from MD posted over 11 years ago:
Robert Dailey from CA posted over 11 years ago:
Bill Mead from OH posted over 11 years ago:
Rajendra Bhatnagar from VA posted over 11 years ago:
Robert Houle from MD posted over 11 years ago:
Arthur Proefke from MI posted over 11 years ago:
Richard Abbott from FL posted over 11 years ago:
Dennis Spurgeon from OH posted over 11 years ago:
Roger Lang from NY posted over 11 years ago:
Luther Mcfarlane from FL posted over 11 years ago:
Frank Balestrery from CA posted over 11 years ago:
Stephen Sanders from NY posted over 11 years ago:
Robert Mcgreevy from CA posted over 11 years ago:
Paul Lobert from MI posted over 11 years ago:
Dennis Dull from WA posted over 11 years ago:
Rob A from NC posted over 11 years ago:
William Davis from FL posted over 11 years ago:
Richard Reem from AK posted over 11 years ago:
Randolph Moore from LA posted over 11 years ago:
J Morlock from NJ posted over 11 years ago:
Ralph Patterson from CA posted over 11 years ago:
Charles Rotblut from IL posted over 11 years ago:
Mark Krisburg from CA posted over 10 years ago:
John Read from IL posted over 9 years ago:
John Read from UK posted over 9 years ago:
Gary Kolb from AL posted over 9 years ago:
David Van Knapp from NY posted over 9 years ago:
Gerard Bieker - Administrator from KS posted over 9 years ago:
Paul G. from Missouri posted over 9 years ago:
You need to log in as a registered AAII user before commenting.
Log InCreate an account