


Related

Stock Strategies
Many investors focus on trying to gain an information edge, but the bigger advantage comes from taking a longer-term view.
by John Huber | May 2017

Last year, I came across an investment write-up on a large-cap stock that is one of the largest and most widely followed companies in the S&P 500 index.
There was a comment that basically asked: “What is your edge with this stock?”
The implication of this question is that there isn’t any edge to be had with large, well-followed stocks, but there is an edge to be gained with small, underfollowed stocks.
This is a commonly held view among value investors: You need to seek out stocks that are underfollowed, in hopes of gaining bits of information that the market is not currently pricing into the stock. This is a well-intended strategy, but I think the presumption that there is a lot of informational advantage to be had in small-cap stocks is vastly overstated. This doesn’t mean I believe the market is efficient. I just think that attempting to gain an informational advantage is not the most effective way of finding value, given the wide availability of easily obtainable information in today’s market.
I did a talk at the MicroCap Conference in Philadelphia last fall where I addressed three main advantages that can be had in markets:
Most investors only focus on the first advantage—and this is the advantage that is most competitive.
Finding information that others don’t have is the primary reason why many investors prefer small caps over large caps. They think they’ll uncover something that the market currently doesn’t recognize. In the early 1950s, Warren Buffett was turning the pages of Moody’s Manual and found Western Insurance. This stock was a profitable, well-managed insurance company with a clean balance sheet. The stock was trading between $15 and $20 that year despite having $16 per share in earnings. In other words, the stock had a price-earnings (P/E) ratio of 1.0. This was not a soggy cigar butt with a bad balance sheet, it was a profitable business with real earning power and had a stable future as a going concern.
It probably took Buffett less than 60 seconds to realize this was a good deal. This was an example (albeit an extreme example) of information arbitrage. He found information that the market at large didn’t have. It was simply because Buffett was willing to turn the pages of Moody’s. He was doing work that others weren’t doing. Some of the stocks he found were almost certain winners.
I think a lot of the low-hanging fruit has since been arbitraged away because the breadth of information and the ease with which we can access it has leveled the playing field. Everyone is out looking for bargains now.
That said, I am completely in favor of working very hard to locate undervalued ideas. And I’m completely in favor of looking at small-cap stocks for investment ideas. But unlike so many other investors, I’m just as willing to look at widely followed large-cap stocks for ideas, and I think widely followed large-cap stocks can become very mispriced at times.
I also think that many investors think they have found information in small caps that others don’t have. One of the advantages of writing a blog (Base Hit Investing, basehitinvesting.com) is that I hear from a lot of readers. In the past when I have mentioned small-cap stocks, I’m amazed at how many people have already researched the company I’m looking at and have found the same information I found. There might be 100 analysts on Wall Street following Apple (AAPL), but there are probably 500 or more small investors following every small-cap stock. As a percentage of the market capitalization and trading volume, the number of investors looking at the average small-cap stock probably equals or exceeds the coverage of the average large-cap stock.
In other words, I’m skeptical when someone claims to have found information that the market doesn’t already have.
Again, I don’t want to imply that it’s not worth looking at small-cap stocks. I just think the gap between small-cap stocks and large-cap stocks in terms of publicly available information is much smaller than many realize.
Also, investors who focus on trying to gain an information edge are typically focused on short-term information. There was an article in the paper a few months ago that mentioned how various hedge funds are now paying for satellite imagery of farms in order to predict crop yields in the upcoming harvest. These funds are also using satellites to help them analyze traffic patterns at retailers like Wal-Mart  (WMT) by counting cars in the parking lot and plotting the change in cars over a period of time.
This type of information might be useful in predicting whether or not a company will “beat expectations” in the next quarter, but it isn’t all that much of an advantage in determining the long-term value of the enterprise or its longer-term competitive position. (We’ll get the same data that the satellite images provide; we’ll just get it at a later date.)
So much focus is on the short term and so much focus is on trying to uncover information before the market. This creates an advantage for investors who choose to focus on a different potential advantage—namely, time-horizon advantage.
My answer to the question of “What is your edge?” with XYZ large-cap stock is not some hidden piece of information, but simply my willingness to view the business through a different lens than the majority of investors. And I think this is a real edge. I think it’s also a sustainable edge and one that is likely to increase as investment time frames continue to get shorter and shorter. (The average investor held a stock for 14 years in 1965; by the end of the 1990s, this was down to 30 months. It is now likely under a year).
Therefore, I think this hyper-focus on generating short-term results, analyzing quarterly data, and emphasizing “catalysts” all help to increase the edge for those who are willing to buy good companies with no clear reason for why the value exists or certainty for when the market will correct the value.
Table 1 is a snapshot of the top 10 largest stocks in the market just before the Brexit scare back in June 2016.
Table 1. Top 10 Largest Companies in S&P 500 (as of 6/24/2016)
| Company (Ticker) |
Current Market Cap ($ Bil) |
Market Price ($) | % Change (High/Low) |
Change in Market Value ($ Bil) |
|
|---|---|---|---|---|---|
| 52-Wk Low | 52-Wk High | ||||
| Apple (AAPL) | 511 | 89 | 133 | 49.4 | 239 |
| Google (GOOG) | 459 | 515 | 790 | 53.4 | 187 |
| Microsoft (MSFT) | 391 | 40 | 57 | 42.5 | 134 |
| Exxon Mobil (XOM) | 370 | 67 | 92 | 37.3 | 106 |
| Amazon (AMZN) | 330 | 426 | 731 | 71.6 | 145 |
| Berkshire Hathaway (BRK-B) | 326 | 124 | 148 | 19.4 | 60 |
| Facebook (FB) | 320 | 72 | 121 | 68.1 | 141 |
|
Johnson & Johnson (JNJ) |
318 | 82 | 118 | 43.9 | 100 |
| General Electric (GE) | 274 | 19 | 32 | 68.4 | 117 |
| AT&T (T) | 255 | 31 | 42 | 35.5 | 69 |
| Average % Change High/Low | 48.9% | ||||
| Average $ Change in Market Value | $130 billion | ||||
The highlighted column in the table shows the difference (in percentage terms) between the 52-week high price and the 52-week low price. The average change for the top 10 largest companies in the United States was a whopping 49%. There is certainly no doubt that a company like General Electric (GE) doesn’t see its intrinsic value (the price a private buyer would pay for the entire business) change by 68% in one year. Likewise, Johnson & Johnson’s (JNJ) fair value doesn’t change by 44% from one year to the next. But the stock prices for both those firms did fluctuate by those amounts, respectively. This doesn’t mean General Electric or Johnson & Johnson were undervalued at any given point, but it just states that since stock prices fluctuate much more than fair valuations do, there are potentially many opportunities to locate undervalued opportunities when the market’s pendulum swings too far toward the low end of a given range.
Table 2 presents a more comprehensive look at the fluctuations across a broad swath of stocks in the market. I did this analysis in October 2016 and the changes represent the average and median gaps between the 52-week high and the 52-week low prices for stocks in the various indexes.
Table 2. Average and Median Price Fluctuations in Overall Market
| Russell 2000 (Small Caps) | |
|---|---|
| Average % Change Between 52-Week High and Low (High/Low) | 114.7% |
| Median % Change Between 52-Week High and Low (High/Low) | 76.4% |
| S&P 500 (Large Caps) | |
| Average % Change Between 52-Week High and Low (High/Low) | 54.4% |
| Median % Change Between 52-Week High and Low (High/Low) | 45.0% |
| Russell 3000 (Both Large and Small Caps) | |
| Average % Change Between 52-Week High and Low (High/Low) | 97.8% |
| Median % Change Between 52-Week High and Low (High/Low) | 64.5% |
| Data as of 10/13/2016. | |
Even before the surprise result of the U.S. presidential election, which took stocks to new all-time highs, there was a significant gap between the 52-week high and low prices. For example, the Russell 3000, which is an index that includes both large- and small-cap stocks, had a median gap of an incredible 64.5% between the 52-week high and low prices. This shows that there is a large number of securities in any given year that have a yearly high stock price that is significantly greater than its yearly low price.
This volatility is where our opportunity is as value investors. Intrinsic values do not fluctuate (on average) by 65% in any given year, but stock prices do. The fact that stock prices move much more than intrinsic values means that sometimes stock prices become disconnected from their fair values (sometimes they are overvalued and sometimes they are undervalued). The volatility of the market can be a useful tool that, as Ben Graham said, is there to serve us, not to be our master.
Bank of America (BAC) is an example of how significant the gaps between price and value can be even when it comes to large-cap stocks. Bank of America ended 2015 trading around $17. The stock traded for around $11 just over a month later in early February 2016. As of early April 2017, it trades for around $22.
In other words, the value that the stock market placed on Bank of America dropped by about $60 billion in just six weeks at the beginning of 2016. Even more incredibly, the market values this same company around $120 billion more than it did just nine months prior when the stock hit its “Brexit low.” This roller coaster ride in market capitalization is much more pronounced than the change in intrinsic value (the value a private buyer would have paid for BAC at any given point during 2016).
How does a company as widely followed as Bank of America experience such a change in valuation?
Investors sold it off in the early part of 2016 because of fears about a negative impact to earnings that low oil prices would have on the bank’s energy portfolio, as well as fears related to an overall economic slowdown and a possible recession. These were factors that would have quite possibly impacted the near-term earnings outlook at Bank of America, but would be very unlikely to impact the long-term earning power of the franchise.
Those who were willing to look out three to five years and possibly deal with negative short-term results were able to buy stock in a profitable bank with a good balance sheet at really cheap prices.
Some quick, back-of-the-envelope math on the company when the stock traded around $12 per share gives an example of how to estimate fair value:
(BAC) 0.10);Bank of America’s book value was growing at around 6% to 8% annually, which means the bank would have somewhere around $20 of tangible book value per share in three years (2019). At a modest return on tangible equity of 10% (which is what the company was already doing at all-time low profit margins), the company will have around $2 of earning power in three years. I think this would probably be worth 10 to 12 times earnings, meaning the stock would be worth somewhere between $20 and $24 in three years. You could have bought as much as you wanted for $12 in early 2016.
In less than a year, the market “pulled forward” much of the gain that I expected over two or three years, but this is often what happens. Stocks can stay cheap for longer than you expect, and then can become repriced much more quickly than you expect.
This example is not to showcase an investment, but to demonstrate an example of a large-cap stock whose price fluctuates much more than its intrinsic value does. Long-term-oriented investors who were willing to buy into an uncertain short-term outlook could have purchased stock in a well-capitalized stable bank at really cheap prices relative to normal earning power. This was simply because the buyer of the stock could take a different time horizon than the seller, who was selling shares simply because they thought the news would be bad for a few quarters (and, by extension, that the stock price would perform poorly in the short term).
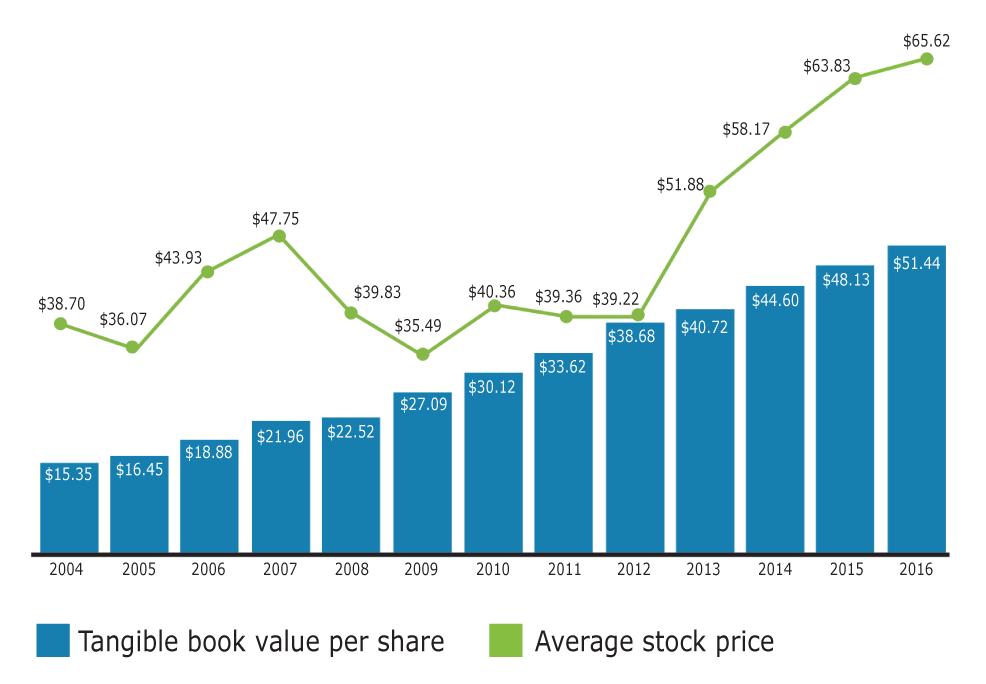
A similar story could be told about JPMorgan Chase (JPM), which has a similarly volatile stock price but a much more stable intrinsic value, as illustrated by the consistency and stability of the firm’s tangible book value growth over the past decade in Figure 1.
Note that the stock price behavior of JPMorgan, and Bank of America in the latter half of 2016 and into 2017, is completely beside the point. Both stocks just as easily could have gone lower last year if the recessionary fears became reality. But the long-term franchise value of the companies wouldn’t have changed much. Both banks have sticky, low-cost deposit franchises, well-capitalized balance sheets, improving cost structures and durable earning power despite historically low interest rates and profit margins. The banks produce relatively unexciting (but stable) return on equity (ROE) and very modest growth potential, but the price that their stocks trade at can offer, at times, significant value relative to the price paid.
The banks highlighted are just two examples of stocks that were mispriced last year, but there are countless examples of widely followed large-cap stocks that have become occasionally undervalued. I think a stock often gets mispriced because there is a general perception that the next year or so is going to be very difficult for the company and there isn’t any real near-term catalyst that will drive the stock price higher. This creates an advantage for those who are willing to deal with short-term underperformance.
What often happens is that the short-term underperformance doesn’t even occur. Sometimes the market “advances” gains—the stock appreciates an amount in six months that you thought would have taken three years. This certainly happened with both Bank of America and JPMorgan.
Regardless of how quickly the stock appreciates to fair value, there is a real advantage for those investors who are willing to buy good companies when general market conditions or company-specific conditions are pessimistic (and without any clear-cut time frame for when that pessimism will subside).
This advantage is part of the market structure. Unlike the information advantage (which has decreased over time), I think time arbitrage’s advantage has increased. In fact, the advantage of time arbitrage has increased for the very reasons why informational advantages have decreased: technology, the ease of gathering information and the short-term focus of market participants.
The “edge” is less about knowing more than everyone else about a specific stock, and more about the mindset, the discipline and the time horizon that you maintain as an investor.
Thinking long term is a commonly talked-about potential advantage, but one that is much less often acted upon. If you are a professional investor set up to capitalize on this or an individual investor who has the right mindset, you can give yourself a significant edge in the stock market.
Disclosure: John Huber and Saber Capital Management clients own shares of JPMorgan Chase.
Stock Strategies
Stock Strategies


Scott Bowen from NC posted over 9 years ago:
Jay Lagree from DE posted over 9 years ago:
Steven Sears from IA posted over 9 years ago:
You need to log in as a registered AAII user before commenting.
Log InCreate an account