
When NPR’s update of the day’s headlines mentions the stock market’s lack of volatility, conditions must be extraordinarily calm. Such is the case right now. The Chicago Board Options Exchange’s Volatility Index (the CBOE’s VIX)—an obscure index to those who don’t focus on the financial markets—made the morning news. While most investors prefer calm conditions to turbulent ones, the current lack of volatility can distort the sense of how much risk an investor feels comfortable with taking. I’ll explain why this is a danger momentarily, but first I want to put the current state of calm into perspective.
Called the stock market’s “fear index,” the VIX ended Monday at 9.77. Not only was this the lowest close since December 1993, it was only the 11th time the VIX has closed below 10.0 since the CBOE launched the index in 1993. To give you a sense of how low this number is, 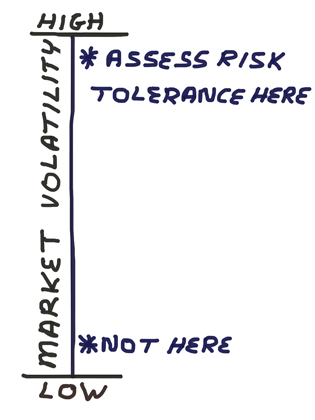 the median closing level for the VIX over its entire history is 17.70, based on data from the CBOE. (The average is 19.57, but this number is skewed higher by the financial crisis when the fear index closed above 80 on both October 27 and November 20, 2008.)
The VIX is a measure of the implied or expected volatility of S&P 500 options over the next 30 days. Implied volatility is the market’s estimated future volatility. In layman’s terms, the VIX tells you whether traders are paying a little or a lot to protect their portfolios against a downward drop. Think of the VIX as tracking the cost of insurance with variable premiums; the more you perceive the risk of danger occurring, the more you are willing to pay to protect yourself against damage. The same logic applies to the VIX; the more fearful traders are, the more they are willing to pay for protection and the higher the index will be.
There are other signs of low volatility and complacency. Year to date, there have only been three days when the S&P 500 has either risen or fallen in price by 1% or more. Such daily moves have typically occurred 4.25 times per month, on average, according to CFRA chief equity strategist Sam Stovall’s analysis of data dating back to 1950. The latest Investors Intelligence (II) Advisors Sentiment survey found that 58.7% of newsletter writers are bullish, while just 17.3% are bearish. II describes readings above 60% as "a rare event."
Over in bond land, fear of a forthcoming rise in default rates appears to be in short supply. Our Chicago-based neighbors at Driehaus Capital recently tweeted that the yield spread between BB-rated and BBB-rated corporate bonds is at its lowest level since the mid-2000s at 87 basis points (0.087%). The firm also tweeted a chart showing implied volatility in high-yield bonds being at a post-financial crisis low. Even among indexes where spreads were tighter a few months ago, the bond markets seem to show a willingness to accept credit risk (meaning buying debt of riskier issuers in exchange for comparatively higher yields.)
All this matters because periods of low volatility lure investors into thinking they can handle more risk than they actually can. An investor’s tolerance risk is not determined by how they feel during periods of calm, but rather by how they feel during periods of high volatility. The allocation to stocks, high-yield (aka “junk”) bonds and related risky investments you can stick with during periods of plunging prices is often (far) smaller than what you think you can handle during more favorable market conditions. It’s far easier to be risk-seeking when prices are stable or rising than when you see your wealth vanishing into thin air. (The pain of a loss far exceeds the pleasure of a gain.) As important as it is to accept short-term price volatility to build long-term wealth, it’s also important to put yourself in a position where the pain and fear of falling wealth won’t cause you to panic and abandon your allocation strategy.

- CBOE’s Volatility Index – Wayne Thorp explained in greater detail what the VIX measures and how investors can use it.
- Re-Examining Risk Tolerance Using Worst Case Scenarios – Though written in 1998 by former AAII Journal editor Maria Crawford Scott, this article provides a good overview of how to use worst-case scenario analysis to determine your tolerance for risk.
- The Trinity Portfolio: Combining Diversification, Tilts and Trend-Following – Meb Faber shows how buy-and-hold and a more tactical trend-following strategy can be combined into a single approach.
- What’s Your Investing Edge? – Investors’ biggest advantage comes from being able to take a long-term view.
First-quarter earnings season shifts to the retailers. Twenty members of the S&P 500 are scheduled to report, including Dow Jones industrial average components: Home Depot (HD) on Tuesday; Cisco Systems (CSCO) on Wednesday and Wal-Mart Stores (WMT) on Thursday.
The week’s first economic reports will be the May Empire State manufacturing survey, the May housing market index and March Treasury international capital, all of which will be released on Monday. Tuesday will feature April housing starts and building permits as well as April industrial production. The Philadelphia Federal Reserve's May business outlook survey will be released on Thursday.
Two Federal Reserve officials will make public appearances: Cleveland president Loretta Mester on Thursday and St. Louis president James Bullard on Friday.
The Treasury Department will auction $11 billion of 10-year Treasury inflation-protection securities (TIPS) on Thursday.
- A Worksheet Approach to Selecting a Financial Planner
- Using Annuities for Long-Term Health Care
- Common Investor Mistakes and Other Investing Insights
The percentage of individual investors describing their short-term outlook for stock prices as "neutral" is at a six-month high, according to the latest AAII Sentiment Survey. Optimism pulled back this week, while pessimism rose slightly.
Bullish sentiment, expectations that stock prices will rise over the next six months, fell 5.3 percentage points to 32.7%. The drop keeps optimism below its historical average of 38.5% for 16 out of the last 17 weeks.
Neutral sentiment, expectations that stock prices will stay essentially unchanged over the next six months, rose 5.1 percentage points to 37.1%. Neutral sentiment was last higher on November 2, 2016 (42.0%). The rise keeps neutral sentiment above its historical average of 31% for the seventh time in eight weeks.
Bearish sentiment, expectations that stock prices will fall over the next six months, is 0.3 percentage points higher at 30.2%. The historical average is 30.5%.
At current levels, all three sentiment indicators are within their typical historical ranges.
AAII members, in aggregate, are not significantly altering their market outlooks in reaction to the ongoing record highs for stocks prices. While some view the gains favorably, others fret about rising valuations. We continue to see President Trump and the potential impact of his administration’s policies brought up in response to our weekly special questions—even when the questions have nothing to do with Washington politics. Also playing a role is the lack of volatility and concerns about the potential for a forthcoming drop in stock prices.
This week’s special question asked AAII members what sectors or segments, if any, they think are excessively overvalued right now. Nearly one of out every three respondents (31%) said that technology (particularly the largest tech companies) is overvalued. Nearly 19% of respondents view the entire market, or at least most sectors, as having too high of a valuation. Conversely, about 11% don’t think any particular sector is overvalued. Nearly 8% think financials are overvalued. Almost 6% view health care as being too pricey and 6% say the real estate sector’s valuation is too high. Other sectors mentioned include automotive, consumer staples and industrials. Some respondents listed more than one sector.
Here is a sampling of the responses:
- “Fab 5 in technology, and the NASDAQ in general. ‘Dot-com-itis’ appears alive and well.”
- “I don’t think anything is excessively valued.”
- “The whole market would seem to be at peak and fragile if the economy does not grow faster.”
- “It’s not so much sectors I find overvalued as it is specific stocks in which I am interested.”
- “Virtually all segments are ahead of themselves right now based on Trump’s promise of a major tax cut.”

Bullish: 32.7%, down 5.3 points
Neutral: 37.1%, up 5.1 points
Bearish: 30.2%, up 0.3 points
Bullish: 38.5%
Neutral: 31.0%
Bearish: 30.5%
Local Chapter Meetings

May 4, 2017 Bogle’s Allocation and Other Morningstar Conference Notes
April 27, 2017 It’s Almost May: Should You Stay With Stocks or Go?
April 20, 2017 Too Much Complexity Isn’t a Good Thing
April 13, 2017 The Influence of Perception on the Urge to Trade

