
Consider this scenario: You are presented with two market environments. In the first, the S&P 500 has risen nearly 10% and is holding onto its gain heading into what should be a good earnings season. In the second, the S&P 500 has not only pulled back, but also closed below its 50-day moving average for the first time in six months. Which market environment would you prefer to invest in?
If the first one sounds 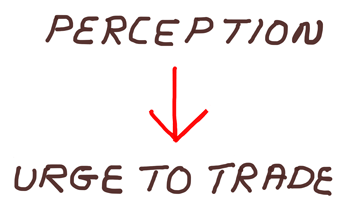 more enticing, or at least more comforting, than the second one, you’re not alone. We humans do not like losing money, much less incurring an identifiable risk of losing money. But what’s more interesting is that the two scenarios both accurately describe the S&P 500 as of yesterday’s close. The only difference is how they are framed; how they describe the current market environment.
Since last November’s elections, the S&P 500 has gained 9.6%. The rally has stalled as of late, however, with the large-cap index sitting 2.2% below its record closing high. This modest decline led to the S&P 500 closing below its 50-day moving average for the first time since Election Day. The breach, however, occurred at a higher level—as the index rose to higher levels, so did its moving averages. (Moving average lines trace the average price of an index, fund or security; think of them as a series of connected dots, with each dot shifting the calendar period used to calculate the average forward by one day.) As far earnings season is concerned, Thomson Reuters says favorable year-over-year comparisons for the energy sector could lead to the strongest growth in first-quarter revenues and earnings in over five years.
We often see framing used in the description of how the markets are performing on a given day. Relatively common declines on a percentage-point basis, say 0.5%, are described with words implying a significant drop. (I’ve noticed that the headline writers at Yahoo Finance are particularly guilty of this.) Yet when one takes a step back and considers both market history and the actual magnitude of the change, the market’s daily fluctuation is often nothing more than a case of “nothing to see here, move along.” Of course such descriptions do not grab attention or generate clicks, but that’s a discussion for a different day….
Among the problems with framing is its tendency to lead to excess trading. Investors, both individual and institutional, get lured into short-term thinking by focusing too much on the here and now as opposed to the long term. Such tendencies make it difficult to cope with short-term volatility. A study by a Norwegian business professor found that investors, in aggregate, held stocks for just 0.75 years. Put another way, half of all investors hold stocks for nine months or less.
For those of you who are curious, individual investors held onto their stocks the longest, with a median time horizon of 0.833 years (10 months). Financial investors (e.g., mutual funds) had the shortest time horizons, with a median time horizon of just 0.499 years (six months).
This study analyzed the holding periods of Norwegian stocks listed and traded on the Oslo Stock Exchange (OSE) between 1997 and 2007. There are relatively few studies of this type because of the difficulty in obtaining the necessary data. The OSE has a registry listing all trades, including sector codes identifying the type of investors. While there may be differences between Norwegian investors and American investors, the tendency of investors to trade more frequently than they should is an international phenomenon. For example, a study by Terrance Odean and Brad Barber about Taiwanese traders and overconfidence has been widely cited here in the U.S. For those of you who prefer data on Americans, analysis of mutual fund returns conducted separately by Morningstar and research firm Dalbar shows investors underperforming the very funds they invest in.
When we allow short-term events to influence our judgment, it shifts our attention away from the strategy of reaching our long-term goals. This is why I think there is an advantage to trading slower, not faster. Purposely stopping yourself before making any change to your portfolio may give you the mental and emotional break necessary to reassess the situation and consider whether or not the action truly is beneficial from a long-term standpoint.

- Trading More Frequently Leads to Worse Returns – Terry Odean discussed his study of Taiwanese traders and why returns worsen as trading activity increases in this 2014 AAII Journal article.
- How Investors Miss Big Profits – Dalbar president Louis Harvey talked about the insights his firm learned from analyzing the behavior of mutual fund investors.
- Overcoming Common Behavioral Errors – Meir Statman explains how changing the context in which data is viewed can help lead to better decisions.
- Rules for Drawing and Analyzing Trendlines – Plotting out the market’s trend is more art than science, but there are guidelines.
The U.S. financial markets will be closed tomorrow, April 14, in observance of Good Friday. To the many of you who will be observing Sunday's holiday, we wish you a happy Easter.
Taxes must be filed by Tuesday. (Our annual tax guide may be of help.) Tuesday is also the deadline for making 2016 IRA contributions.
Computerized Investing editor Jaclyn McClellan will speak to our Denver chapter on Thursday about using stock screens to find a good a stock.
First-quarter earnings season will gain some steam next week with 68 members of the S&P 500 scheduled to report. Included in that group are nine Dow Jones industrial components: Goldman Sachs Group (GS), International Business Machine (IBM), Johnson & Johnson (JNJ) and UnitedHealth Group (UNH) on Tuesday; American Express (AXP) on Wednesday; Travelers Companies (TRV), Verizon Communications (VZ) and Visa (V) on Thursday; and General Electric (GE) on Friday.
The week’s first economic reports will be the April Empire State manufacturing survey and the April housing market index, both of which will be released on Monday. Tuesday will feature March housing starts and building permits and March industrial production and capacity utilization. The periodic Beige Book will be released on Wednesday. Thursday will feature the Philadelphia Federal Reserve’s April business outlook survey. The April PMI composite flash and March existing home sales will be released on Friday.
Four Federal Reserve officials will make public appearances: Kansas City president Esther George on Tuesday, Boston president Eric Rosengren on Wednesday, governor Jerome Powell on Thursday and Minneapolis president Neel Kashkari on Friday.
The Treasury Department will auction $16 billion of five-year Treasury inflation-protected securities on Thursday.
- Managing Cash Flow in Retirement
- 18 Recommendations for Minimizing Inheritance Conflict
- How Interest Rate Changes Affect the Price of Bonds
The percentage of individual investors expecting stocks to rise in price is below 30% for a second consecutive week. The latest AAII Sentiment Survey also shows a rise in neutral sentiment and a decline in pessimism.
Bullish sentiment, expectations that stock prices will rise over the next six months, is modestly higher (0.7 percentage points) at 29.0%. Prior to this month, optimism had not been below 30% since last November’s election. This week is also the 12th out of the last 13 with optimism below its historical average of 38.5%.
Neutral sentiment, expectations that stock prices will stay essentially unchanged over the next six months, rose 1.6 percentage points to 33.6%. The rise keeps neutral sentiment above its historical average of 31% for the fourth consecutive week.
Bearish sentiment, expectations that stock prices will fall over the next six months, pulled back by 2.2 percentage points to 37.4%. Even with the decline, pessimism remains at or above its historical average of 30.5% for the ninth consecutive week and the 12th out of the last 13 weeks.
The current streak of consecutive weeks with bearish sentiment at or above its historical average is the longest such streak in nearly five years. Pessimism stayed above its historical average for 15 consecutive weeks between August 30 and December 6, 2012.
The potential impact that President Trump could have on the domestic and global economy continues to cause uncertainty and/or concern among some individual investors, while encouraging others. At the same time, prevailing valuations and the lack of downside volatility have increased concern about the potential for a forthcoming drop in stock prices.
This week’s special question asked AAII members how, if at all, they have adjusted their stock investing strategies recently. Responses were very mixed. The largest group, 22% of all respondents, said that they have not made any change. Approximately 21% said that they’ve sold stocks and boosted their cash positions. Some of these respondents expressed concerns about the potential for a drop in stock prices or geopolitical turmoil. Nearly 11% are seeking yield, either via dividend-paying stocks or real estate investment trusts (REITs). Almost 9% favor value, while 6% expressed a preference for large-cap stocks.
Here’s a sampling of the responses:
- “No change. I don’t try to time the markets.”
- “I’m focusing more on yield. It’s the proverbial ‘bird in the hand.’”
- “Freeing up cash in anticipation of a pullback.”
- “Large cap to be more conservative.”
- “Value. It’s always a smart play.”

Bullish: 29.0%, up 0.7 points
Neutral: 33.6%, up 1.6 points
Bearish: 37.4%, down 2.2 points
Bullish: 38.5%
Neutral: 31.0%
Bearish: 30.5%
Local Chapter Meetings

April 6, 2017 A Rules-Based Approach to Managing a Portfolio
March 30, 2017 The Small-Cap Premium Still Lives on the Value Side
March 23, 2017 Helpful Steps My Late Father-in-Law Took
March 16, 2017 Rate Hikes, Inflation and What You Earn

