

Special note: Our offices will be closed on Monday and Tuesday both next week (December 24 and December 25) and the week after (December 31 and January 1). On behalf of everyone at AAII, we wish a merry Christmas to the many of you who will be celebrating the holiday and a happy, healthy and prosperous New Year to all of you.
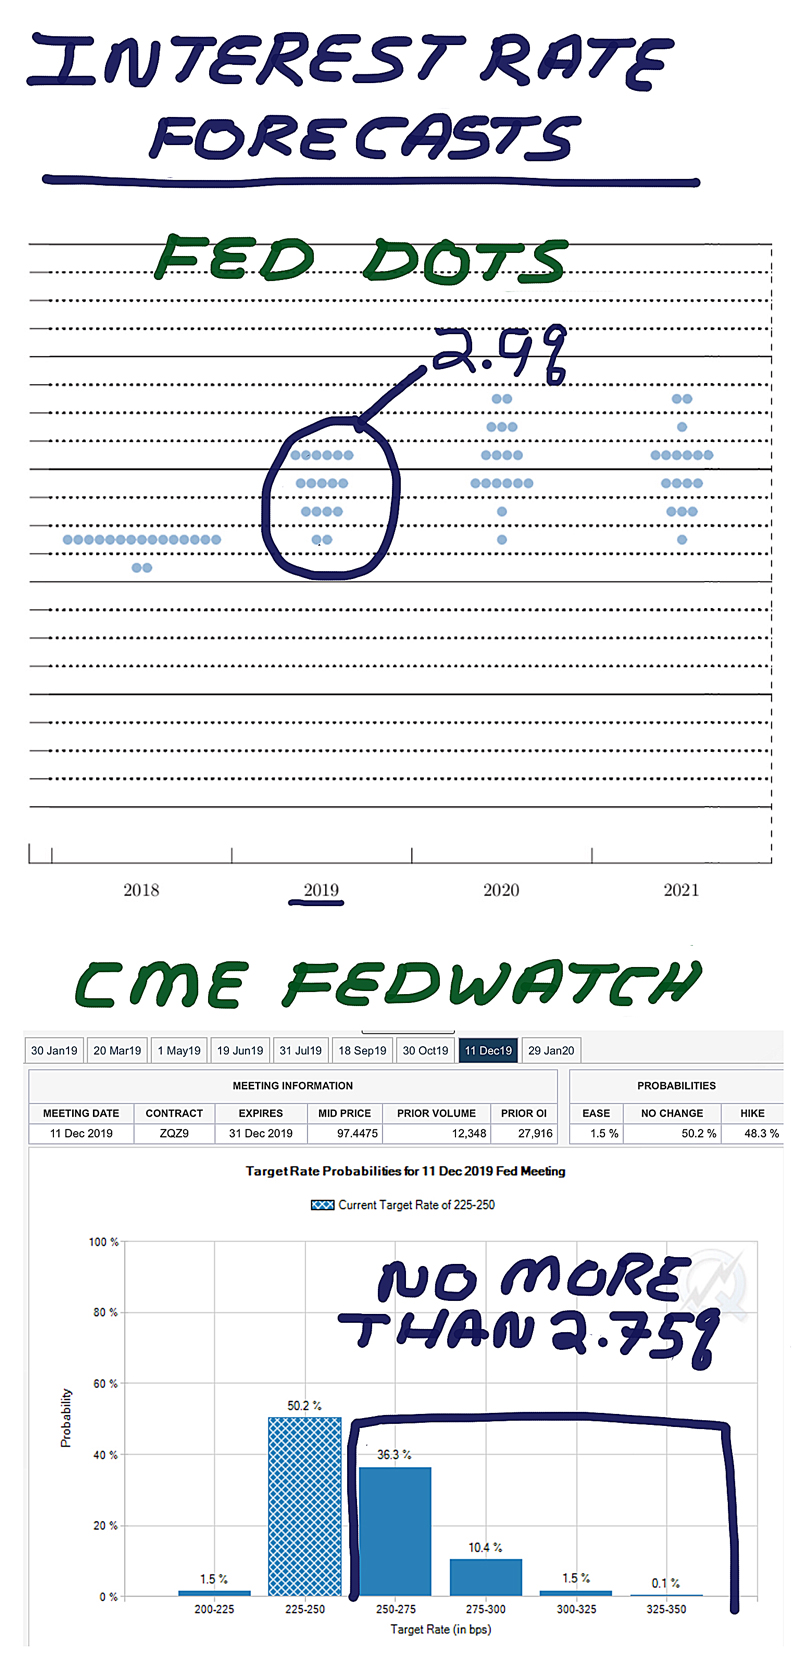
The Federal Reserve’s dots are back to being a subject of conversion following yesterday’s Federal Open Market Committee (FOMC) meeting. Each dot on the top chart displayed to the right (click to enlarge) represents a committee member’s forecast for future rate hikes. The higher the stack of dots is for a given year, the greater the disagreement between Fed officials about where rates will be. This chart is updated quarterly and can be found, along with other projection materials, on the Federal Reserve’s website. The median forecast following yesterday's meeting was for a fed funds target rate of 2.9%, equivalent to two hikes next year.
The dot plot is not the only interest rate forecast widely available to the public. You can also look at the Chicago Mercantile Exchange’s (CME) FedWatch Tool. This bar graph—the lower chart on the right—calculates the probabilities of what the FOMC’s fed funds rate will be following a scheduled meeting. The probabilities are based on the trading activity of fed fund futures. Whereas the dot plot shows the expectations of FOMC members, FedWatch shows what traders think will happen. The odds of a second rate hike occurring were 12% as of this morning.
Like all forecasts, both change over time. Just because forecasts currently suggest we’ll see one (FedWatch) or two (dot plot) rate hikes in 2019, doesn’t mean we will. Both are just probabilities based on current information and expectations. Any strengthening or weakening in both inflation and the pace of economic expansion will alter both forecasts. Anyone who projects how many rate hikes will occur with a high level of conviction has chosen to ignore how cloudy their crystal ball is.
What we can take away from the forecasts are probabilities. Barring an acceleration of economic growth, the odds of having as many rate hikes next year as this year are low.
Getting more nuanced, or even going against the consensus, requires making assumptions. For more than two hikes to occur, there would likely need to be a resolution to the trade war with China and potentially some type of not-too-painful resolution to Brexit. Wage increases are a wildcard. Corporations have yet to ratchet up wages in response to low levels of unemployment; the year-over-year change in hourly earnings is still largely below what we saw in 2007 and during several months of 2008. Of course, it’s possible for the Federal Reserve to overshoot, but I think they would need to see data to justify such a move—even in the absence of any remarks from the White House.
On the other side, there would need to be a slowdown in economic growth to justify no hikes. A messy separation by Great Britain from the European Union and an escalation in the trade war between the U.S. and China are certainly the most identifiable risks. Global economic malaise is also within the realm of possibilities given current data. There’s always the possibility of some type of shock, either not identifiable now or whose possibility has been downplayed too much. Shocks, of course, are a risk every year—if we could identify such events and their timing in advance, we’d use a different word to describe them.
There is always guidance on what to do following a rate hike and the release of new data. The insights shared on TV, via newsletters, on social media or in any other medium are based on information that is already available. The only thing that differs by commentator is opinion and interpretation. While pundits get paid to make such calls, individual investors get rewarded by not reacting to every headline. We can use our own observations to establish expectations, but we should tread carefully before making big portfolio changes based on them.

- The Traits and Processes That Lead to Better Forecasts – To be good at forecasting, a person must be both open-minded and possess the ability to distinguish between many degrees of uncertainty.
- Follow the Fed, but Be Smart About It – Periods of tightening monetary policy have historically been accompanied by lower returns for large- and small-cap stocks.
- The SEC Wants to Hear From Individual Investors – The agency has created a “Tell Us” page to get feedback about specific topics and initiatives.
- The Individual Investor’s Guide to Personal Tax Planning 2018 – Our annual tax and financial planning guide has been updated to help you understand how the new law will impact your 2018 and 2019 taxes.
The quarterly review of our Model Shadow Stock Portfolio resulted in the removal of two stocks and the purchase of a third. AutoWeb Inc. (AUTO) and SigmaTron International (SGMA) were removed because both had trailing 12-month losses for two consecutive quarters. The proceeds from the sale of both stocks were used to add VSE Corp. (VSEC). The buy rules for the portfolio suggest AAII members pay no more than 10% above the stock’s price-to-book ratio of 1.0, which equates to a maximum of $32.37 based on VSE Corp.’s price as of November 30, 2018.
The Model Shadow Stock Portfolio was down 15.5% year to date as of the end of November. This compares to a year-to-date gain of 5.0% for the Vanguard S&P 500 Index (VFINX). Since its inception in 1993, the Model Shadow Stock Portfolio has returned 14.6% annually versus 9.4% for VFINX.
The U.S. financial markets will close early on Monday: 1:00 p.m. Eastern Time for the stock exchanges and 2:00 p.m. Eastern Time for the bond markets. The U.S. financial markets and banks will be closed on Tuesday in observance of Christmas.
The deadline for taking required minimum distributions (RMDs) is coming up soon, December 31, 2018 (a week from Monday). Many brokers will allow you to automatically deposit your RMDs into a bank account, which can you help you avoid missing the deadline.
Due to the holidays, no members of the S&P 500 will report earnings next week.
The week’s first economic report will be the October S&P Corelogic Case-Shiller home price index, which will be released on Wednesday. Thursday will feature November new home sales and the Conference Board’s December Consumer Confidence Index. November international trade and November pending home sales will be released on Friday.
The Treasury Department will auction $40 billion of two-year notes on Monday, $18 billion of two-year floating rate notes and $41 billion five-year notes on Wednesday and $32 billion in seven-year notes on Thursday.
- Do the Top ETFs Continue to Outperform?
- The Individual Investor’s Guide to Personal Tax Planning 2018
- The Top Mutual Funds Over Five Years: Tech Takeover
Though pessimism declined and optimism among individual investors rebounded in the latest AAII Sentiment Survey, they remain unusually high and low, respectively.
Bullish sentiment, expectations that stock prices will rise over the next six months, rebounded by 4.0 percentage points to 24.9%. Optimism remains below its historical average of 38.5% for the 13th time in 15 weeks.
Neutral sentiment, expectations that stock prices will stay essentially unchanged over the next six months, fell by 2.4 percentage points to 27.8%. Neutral sentiment is below its historical average of 31.0% for the seventh time in eight weeks.
Bearish sentiment, expectations that stock prices will fall over the next six months, pulled back by 1.6 percentage points to 47.3%. The decline follows the 5½-year high set last week. Pessimism is above its historical average of 30.5% for the 11th consecutive week and the 14th out of the last 15 weeks.
As noted above, both optimism and pessimism are outside of their typical ranges. Bullish sentiment readings below 28.1% imply an unusually low level of optimism. Bearish sentiment readings above 39.8% imply an unusually high level of pessimism. Historically, both have been followed by higher-than-median six- and 12-month returns for the S&P 500 index, particularly unusually low optimism.
The survey period runs from Thursday through Wednesday. Reminders to take the survey are emailed to a rotating group of AAII members every Monday. Slightly less than 40% of this week’s votes were placed on Monday and about 80% were cast between Thursday and Monday.
This has been a tough year for investors. In a separate survey we conducted last week, 73% of respondents said their investments performed worse than they expected. Many AAII members follow long-term strategies and do not alter their strategies in response to the ongoing volatility. However, this is not universally the case, as cash allocations reached a 33-month high last month according to our November Asset Allocation Survey.
Beyond market volatility and worse-than-anticipated returns, influencing individual investors’ outlooks are Washington politics (including President Donald Trump and the change in House leadership), tariffs (particularly the ongoing trade war with China), corporate earnings, the Federal Reserve, valuations and concerns about the pace of economic growth.
This week’s special question asked AAII members how oil prices are impacting their outlook for the overall stock market. Slightly over half of all respondents (53%) say oil prices are not influencing their outlook. Approximately 15% of respondents think the decline in prices is bad for stocks, with an additional 3% saying the low prices are specifically bad for energy stocks. Conversely, 14% of respondents view low oil prices as being good for stocks and the economy.
Here is a sampling of the responses:
- “Oil prices are not affecting my market outlook, except for the petroleum sector.”
- “Oil prices will have little impact, being too small of a factor compared to other market forces.”
- “Rule of thumb is down oil, down market. Less oil consumption translates to lower economic activity.”
- “Lower prices are a symptom of a slowing global economy.”
- “Lower oil prices mean more money for consumers.”

Bullish: 24.9%, up 4.0 points
Neutral: 27.8%, down 2.4 points
Bearish: 47.3%, down 1.6 points
Bullish: 38.5%
Neutral: 31.0%
Bearish: 30.5%
Local Chapter Meetings

December 13, 2018 An Updated Look at the Yield Curve and Stock Market Volatility
December 6, 2018 The Taxes You May Be Paying on Your Investments
November 29, 2018 What to Do When Gains Are Hard to Come By
November 22, 2018 Reasons for Individual Investors to Be Grateful

