



Related

Portfolio Strategies
Avoid the value trap with screens that isolate reasonably priced stocks exhibiting earnings growth and price appreciation.

Growth strategies have done well recently, but long-term studies still point to successful investing results by following a disciplined contrarian, value-driven strategy. There are many popular metrics investors use to find mispriced stocks, but concerns over getting caught in a “value trap” loom. This occurs when a stock appears to be attractive based on valuation multiples, but the price remains depressed. The trap is that the stock’s seemingly low price is actually appropriate. A value trap can also occur when a stock is undervalued, but other investors fail to catch on to the mispricing.
A good way to avoid this problem is to look for stocks with characteristics besides a low valuation that justify a higher price. AAII’s fundamental stock screening and research program, Stock Investor Pro, has two screens that isolate reasonably priced stocks exhibiting earnings growth and price appreciation. All members can access screens on AAII.com. Both combine the price-earnings-to-earnings-growth (PEG) ratio with other criteria to capture value stocks on an upward trajectory. The featured strategies are the Value on the Move PEG With Estimated Growth screen and the Value on the Move PEG With Historical Growth screen.
The PEG ratio is a companion calculation to the price-earnings (P/E) ratio in that it accounts for growth in earnings. This ratio attempts to examine whether a stock’s price is out of line with earnings and the earnings growth rate. It compares a stock’s price-earnings ratio to its growth rate in earnings. You can use the current or future price-earnings ratio with a historical earnings growth rate or a future, estimated earnings growth rate.
The PEG With Historical Growth screen uses the trailing 12-month price-earnings ratio (price divided by the sum of earnings for the most recent four quarters) and the historical five-year annual growth rate in diluted continuing earnings per share. A PEG ratio constructed with historical earnings growth should highlight firms that are reasonably priced given their record of accomplishment. It should also highlight a broad range of companies. The weakness with solely relying on historical earnings and its growth rate is that markets are forward-looking, and strong historical growth does not assure strong growth in the future.
The PEG With Estimated Growth screen uses a forward price-earnings ratio (price divided by the consensus earnings per share estimate for the current fiscal year) and the consensus estimated three- to five-year earnings per share growth rate. A forward PEG ratio should help to highlight firms with reasonable price-earnings ratios given their expected growth rates. One cost of relying on consensus long-term growth rates is that they are only available for larger firms with the widest analyst coverage—approximately 1,000 companies as of this writing.
Studies have revealed that stocks with lower PEG ratios have performed better as a group than high PEG ratio stocks, with an interesting exception. Stocks with extremely low PEG ratios underperformed going forward, as their low PEG ratios were likely formulated using extreme price-earnings ratios and/or growth rates. That is why the screens we have constructed exclude stocks with PEG ratios below 0.20. As a rough rule of thumb, a PEG ratio below 1.00 may point to underpricing relative to expected earnings.
Value screens such as low price-earnings filters are good at identifying neglected firms, but secondary screens for positive and growing earnings are helpful in identifying stocks either poised for or participating in an upturn. As a basic screen, we require positive earnings per share from continuing operations for the most recent 12 months and each of the last five years.
The screen also requires positive quarterly earnings growth. Quarterly earnings may indicate a change in the trend of earnings more quickly than just examining annual earnings figures. Quarterly earnings are closely examined by the market and deviations from the expected norm are quickly rewarded or punished.
When studying quarterly earnings, you typically cannot compare one quarter to the previous quarter in a meaningful manner. It is more useful to look at year-over-year, or comparable quarter, earnings changes—where one quarter is compared to the same quarter from the previous year. Many firms have annual seasonal cycles in either sales or production and the stronger the pattern, the more important it is to make year-over-year comparisons of quarterly earnings.
Price momentum is often used as a signal that the market has recognized the stock price is reacting to either proven performance or an increase in expectations. Price momentum is normally measured by comparing the stock price change to that of a market index or against a segment of stocks. Investors look for stock price performance better than that of other stocks with the belief that the rising price will attract other investors, who will drive up the price even more going forward.
There are many tools used to measure price momentum. Our PEG screens rely on the relative price strength rank, which indicates how a company’s stock price has performed relative to all other stocks. A rank of 50% indicates that the stock’s performance is better than 50% of all firms, while a rank of 90% indicates that a stock has outperformed 90% of all stocks. We specify a minimum relative strength rank of 70% over the last 26 weeks for the screen. Looking at performance over the last half year helps to identify stocks that have had recent strong price performance.
See below for a full listing of the criteria used in these two screens.
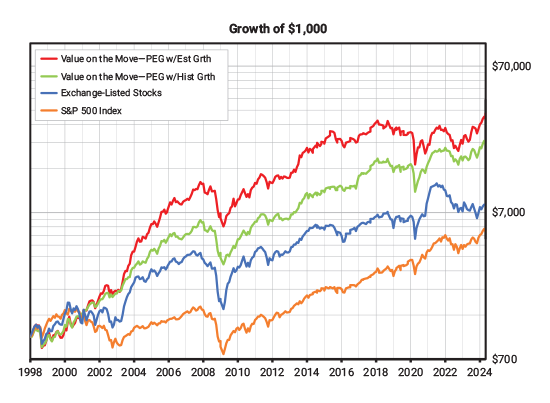
The long-term performance of both screens, assuming monthly rebalancing, has been strong. As shown in Figure 1, the PEG With Estimated Growth screen has an annual price return of 13.4% since 1998 while the PEG With Historical Growth screen has generated an annual price return of 11.9%. The PEG With Estimated Growth screen has been the more volatile of the two. It has a risk index of 1.39, indicating that it has been 39% more volatile than the S&P 500 index. In contrast, the PEG With Historical Growth screen has a risk index of 1.10.
The volatility reduces the risk-adjusted return to 12.2% for the PEG With Estimated Growth screen and to 11.6% for the PEG With Historical Growth screen, yet both remain above the 6.7% risk-adjusted return for the S&P 500.
Like most approaches, the strategies have not outperformed in all stages of the market cycle. An examination of the year-by-year returns reveals how strongly the performance can vary over time.
Forty-two stocks currently pass the PEG With Historical Growth screen, while only four pass the PEG With Estimated Growth screen. We have seen a decrease in the number of analysts providing long-term earnings growth estimates over the years, greatly reducing the number of passing stocks for the screen constructed with the PEG ratio based on estimated growth. The stocks passing the PEG With Estimated Growth screen are much larger in market capitalization than the typical stock.
To help provide a greater cross section of companies to examine for this article, we extended the normal 1.00 maximum estimated growth PEG ratio value for the PEG With Estimated Growth screen so that 20 stocks are displayed in Table 1. The table also lists the 20 stocks passing the PEG With Historical Growth screen that have the lowest historical PEG ratios.
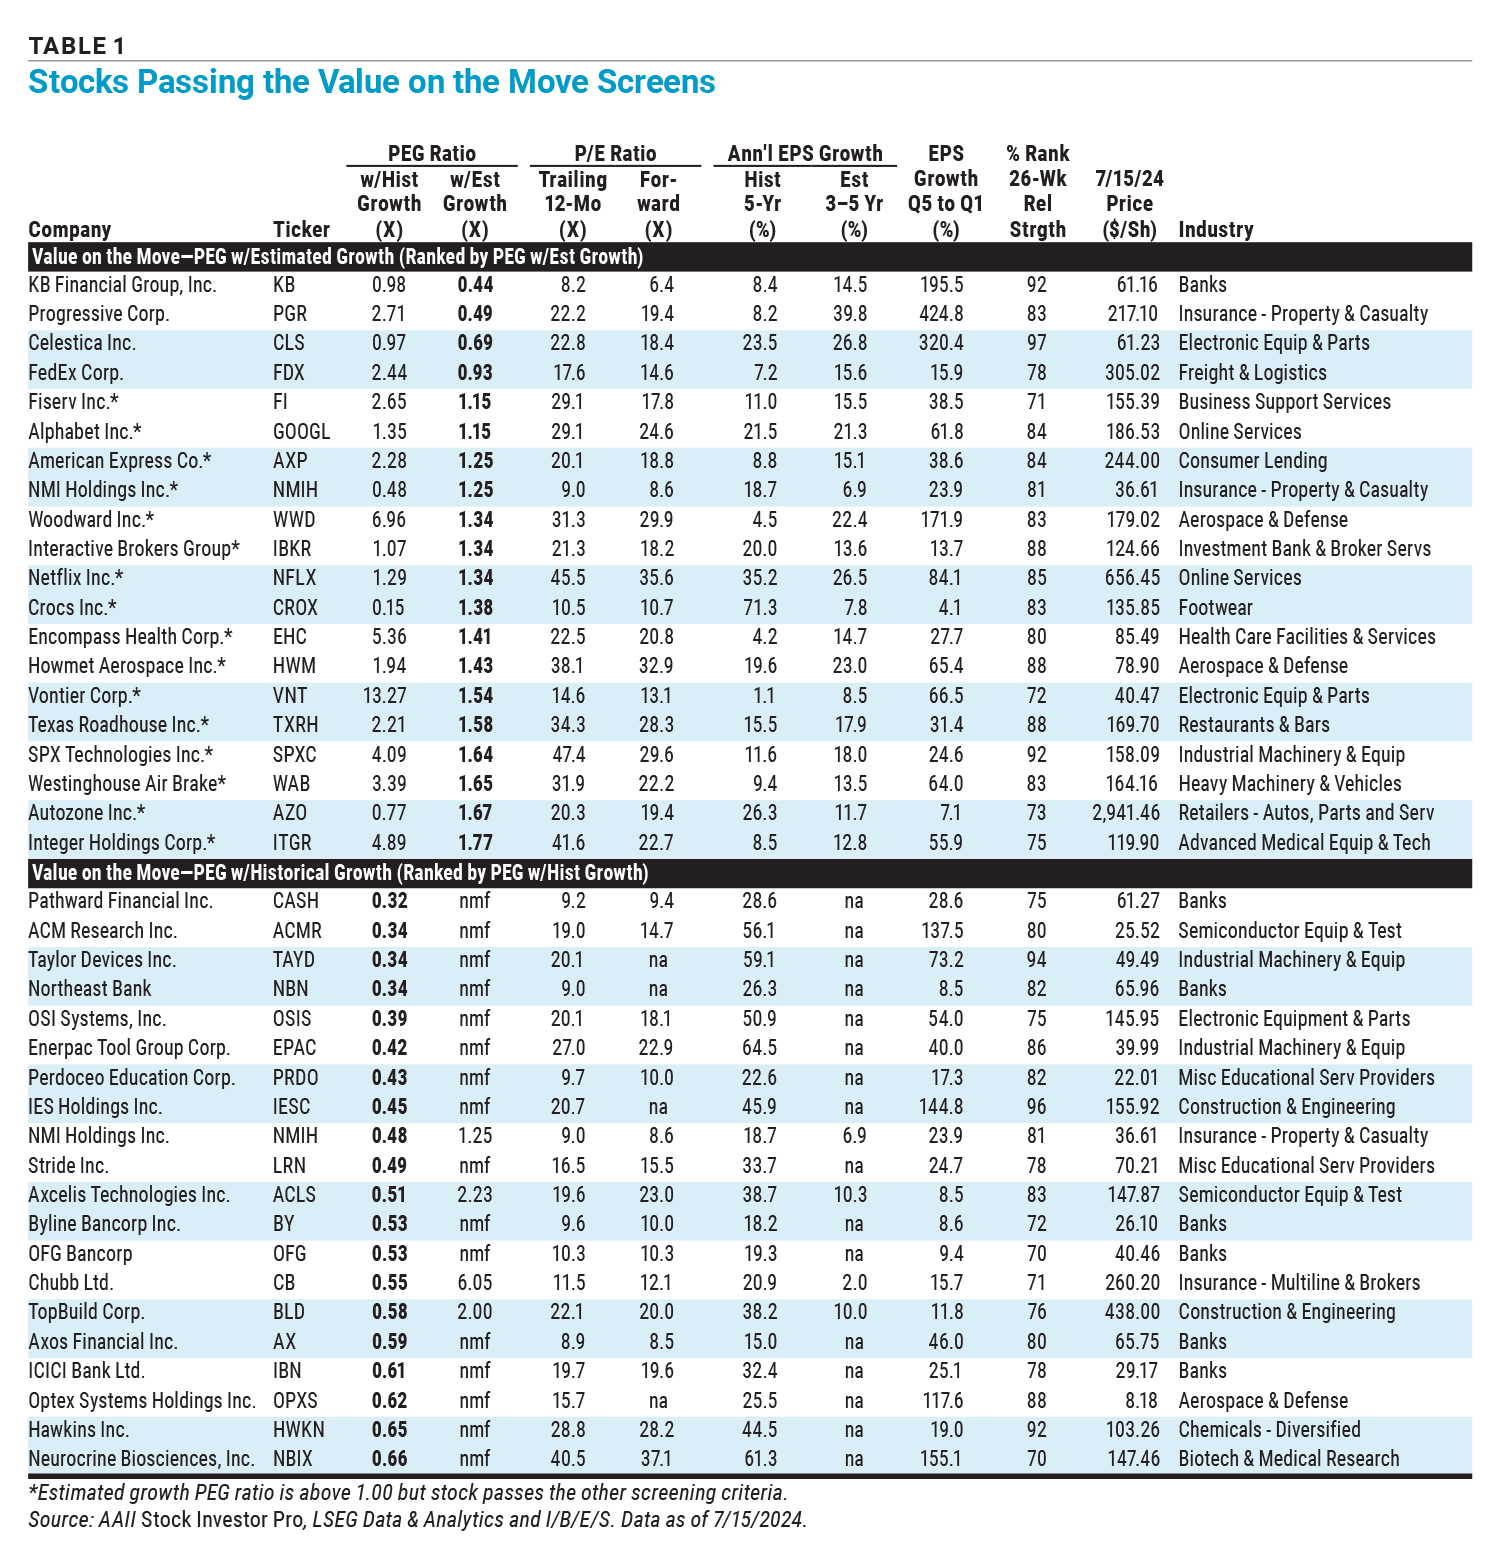
From the list in Table 1, banks have the lowest PEG ratios. KB Financial Group Inc.  (KB) has the lowest estimated PEG ratio of 0.44, while Pathward Financial Inc. (CASH) has the lowest historical PEG ratio of 0.32.
Only four of the 20 companies passing the PEG With Historical Growth screen listed in Table 1 have a three- to five-year estimated growth rate in earnings. This confirms that the companies passing the PEG With Historical Growth screen have less of an analyst following than those passing the PEG With Estimated Growth screen.
The characteristics of all the stocks passing the two Value on the Move screens are presented in Table 2.
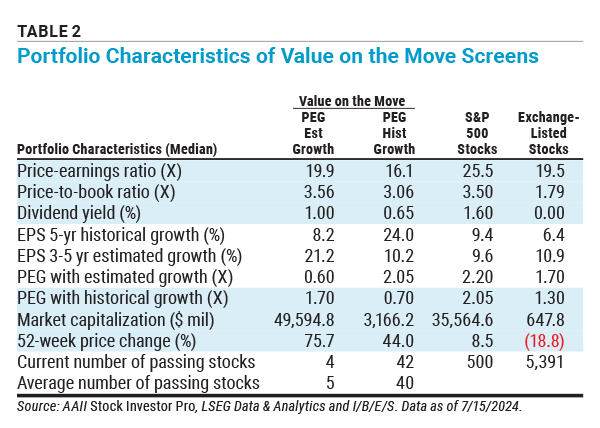
It was surprising to see that the stocks currently passing the Value on the Move screens do not have dramatically lower price-earnings or price-to-book-value (P/B) ratios compared to all exchange-listed stocks. Instead, they have low PEG ratios because of their strong earnings growth.
We see that the PEG With Historical Growth passing companies as a whole have a higher median historical earnings growth rate (24.0%) than that of the PEG With Estimated Growth passing companies (8.2%). The reverse is true regarding the estimated growth rate and the two screens.
Table 2 also shows that the current passing companies have outperformed the market before passing the screen. The PEG With Historical Growth passing companies are up 44.0% over the last 52 weeks and the Estimated Growth PEG companies are up 75.7%. In contrast, exchange-listed stocks are down 18.8% while the median price change for the stocks in the S&P 500 is 8.5% over the same period.
Value screens attempt to identify undervalued stocks. However, patience is required while waiting for the market to recognize the value of a stock. Combining value with price and earnings momentum screens should help to identify reasonably priced stocks on the move. But always keep in mind that the purpose of these screens is to illustrate with real firms a potential useful combination of value and momentum analysis. The screens are a mere first step in the stock-selection process.
PEG With Historical Growth:
PEG With Estimated Growth:
Portfolio Strategies

AAII How-To

Financial Statements

FRANK B from IL posted over 2 years ago:
John B from IL posted over 2 years ago:
You need to log in as a registered AAII user before commenting.
Log InCreate an account