


Related

Portfolio Strategies
A look at historical performance sheds light on whether favoring growth or value stocks makes a difference.

Choosing between value and growth is important when considering how to invest in mutual funds and exchange-traded funds (ETFs).
A growth tilt has been advantageous in recent years for large- and mid-cap stocks. It took until 2023 for the five-year small-cap value premium to end its drought against small-cap growth. Small-cap growth had delivered better five-year annualized returns between 2016 and 2022. (My use of the term “premium” in this article simply means superior performance.)
The term value suggests that the investor is buying relatively less expensive stocks as opposed to relatively more expensive stocks. Stocks classified as value typically have lower price-earnings (P/E) ratios. This simply means that these stocks currently have a lower price per share relative to their earnings than other stocks.
Think of the comparison as investing in a home that needs repair versus putting more money down for the glitzy house on the hill. Very simply, value stocks are those that are currently priced more attractively.
Growth stocks are just the opposite. They have higher price-earnings ratios. Thus, an investor who purchases a growth stock is paying a higher price per share because they believe the stock price might go even higher.
Value and growth are relative measures. Evaluating a stock’s price in value versus growth terms is much like trying to determine whether a home you are interested in buying is priced “right.” Rather than wax philosophical, let’s dive into the results for actual value and growth U.S. stock market indexes and mutual fund category averages.
The 34-year average annualized return of two mid-cap value measures (the Russell Midcap Value index and the Morningstar mid-cap value category average) was 10.64%, as shown in Table 1. This was slightly lower than the 10.77% average annualized return of the combined mid-cap growth measures (the Russell Midcap Growth index and Morningstar mid-cap growth category average). On a risk-adjusted basis, mid-cap value has been superior to mid-cap growth because it has produced a similar return but with 23% less volatility.
The 34-year average annualized return for growth-oriented U.S. large-cap stocks was 10.66%. (This return represents the average of the Russell 1000 Growth index and the Morningstar large growth category average for actual mutual funds.) Value-oriented U.S. large-cap stocks—represented in this study by the Russell 1000 Value index and the Morningstar large value category average—had a 34-year average annualized return of 9.49% from 1990 through 2023. Over the entire 34-year period, there was a premium for growth over large-cap value. However, U.S. large-cap value stocks’ average return occurred with 28% less volatility relative to large-cap growth stocks (as measured by standard deviation).
Over the entire 34-year period, small-cap value demonstrated an advantage relative to small-cap growth U.S. stocks. The 34-year return for small-cap value was 10.41%, compared to a return of 9.44% for small-cap growth.
For comparison purposes, Table 1 also includes the performance of the S&P 500 index (U.S. large-cap stocks), 90-day Treasury bills (cash) and the Bloomberg U.S. Aggregate Bond index (bonds).
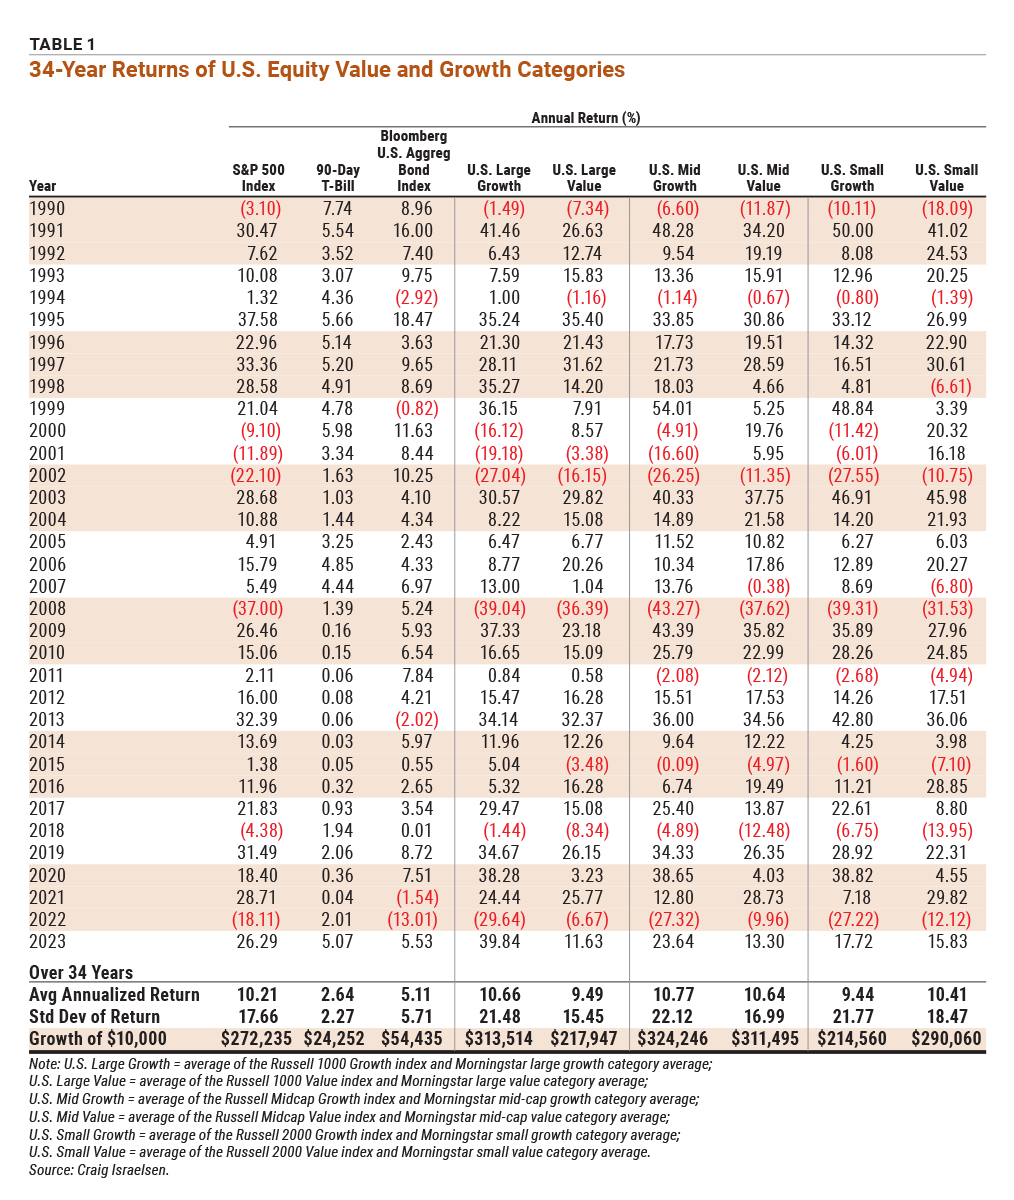
The annual returns in Table 1 reflect performance from one point in time (January 1, 1990) to another point in time (December 31, 2023) 34 years later. Many investors do not hold the same investments for that length of time, so it’s useful to examine performance in shorter time frames. Table 2 shows the performance (return) premium for value and growth over rolling five-year periods from 1990 through 2023.
The premium—whether growth or value—for each five-year period is shown in basis points (bps). As a reminder, there are 100 bps in each 1% of return. Said differently, a return of 10% is 100 bps higher than a return of 9%.
Over the five-year period from 1992 to 1996, U.S. large-cap value stocks demonstrated a premium of 260 bps over U.S. large-cap growth stocks. Among mid-cap stocks, there was a value premium of 238 bps during the same period. Among small-cap stocks, the five-year value premium was 515 bps.
As shown at the bottom of Table 2, large-cap value has demonstrated a performance premium just 40% of the time relative to large growth—suggesting that a growth tilt makes more sense when investing in U.S. large-cap stocks (at least over the past 34 years).
The average five-year large-cap value premium was 384 bps during those five-year periods in which value outperformed. Conversely, large-cap growth outperformed large-cap value 60% of the time by an average of 423 bps over rolling five-year periods. In the five-year period from 2017 to 2021, the large-cap growth premium was 1,266 bps. Then, in the next five-year period (2018–2022), the large growth premium shrunk dramatically to 297 bps. In the most recent five-year period from 2019 to 2023, the large-cap growth premium increased to 664 bps—largely driven by the performance of a handful of mega-cap stocks, such as Apple Inc.  (AAPL), Microsoft Corp. (MSFT) and Nvidia Corp. (NVDA).
Among U.S. mid-cap stocks, value outperformed growth 40% of the time by an average of 404 bps over five-year periods. When mid-cap growth outperformed mid-cap value (60% of the time), the margin of victory averaged 304 bps.
Among U.S. small-cap stocks, value beat growth 53% of the time by an average of 435 bps (again, over five-year periods). However, when small-cap growth outperformed (47% of the time), the difference has been large. For example, during the five-year period of 1995 to 1999, small-cap growth beat small-cap value by 808 bps. Overall, however, the average margin of victory has been 328 bps when small-cap growth has outperformed small-cap value over the rolling five-year periods analyzed.
Among small-cap stocks, we observe a value premium in both frequency and magnitude (magnitude measured in basis points). The opposite is true among large-cap stocks, where we see frequency and magnitude in the growth premium. Among U.S. mid-cap stocks, there has been a growth premium over rolling five-year periods over the past three-plus decades in terms of frequency, but not magnitude.
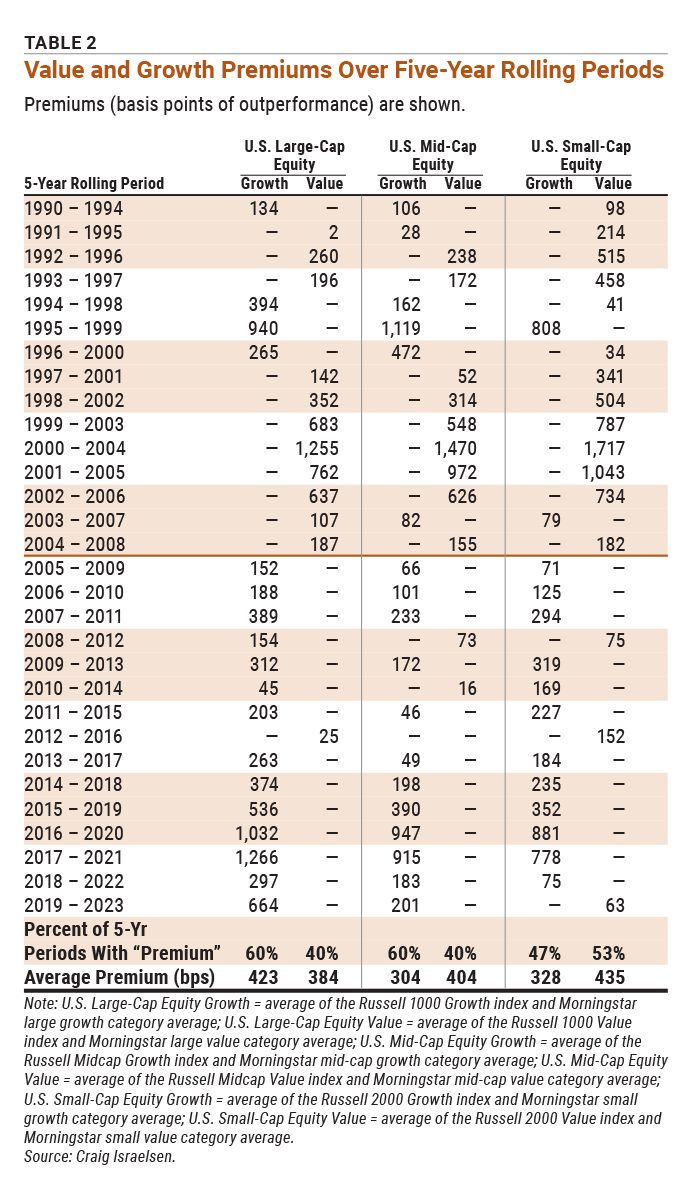
Historically, there have clearly been seasons when growth was the winner and seasons when value dominated. The late 1990s into the mid-2000s was a season in which value was clearly superior (at least when measured over five-year rolling periods). The five-year period from 2005 through 2009 was the beginning of a season in which a growth tilt gained favor. We might call it the growth-oriented “post-2008” recovery. This is most evident among large-cap stocks and, to a lesser extent, among mid- and small-cap stocks. In the most recent five-year period, small-cap value stocks produced a premium of 63 bps relative to small-cap growth stocks.
It is not possible to accurately predict when growth will outperform value, or vice versa. Thus, it makes sense to have exposure to both growth and value in the large- and mid-cap equity portions of your portfolio. When it comes to small-cap stocks, a modest and persistent value tilt has historically been advantageous.
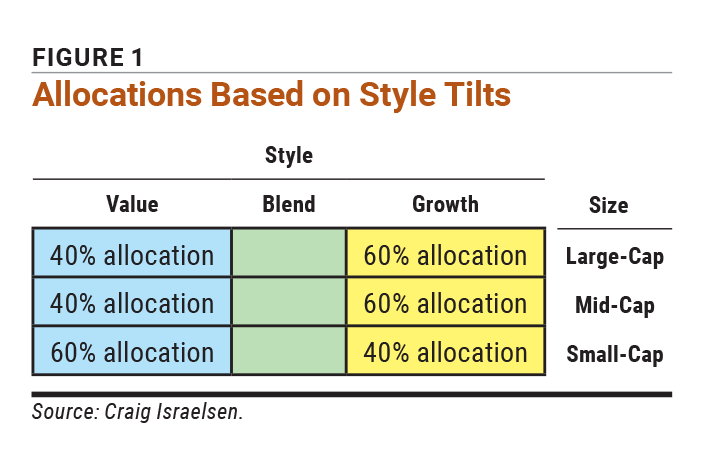
Those familiar with the Morningstar Style Box might consider “tilting” the U.S. stocks portion of their portfolio based on the analysis of growth versus value performance since 1990, as shown in Figure 1. Accomplishing the asset allocation shown in the figure would require six separate mutual funds or ETFs. If a person were investing a total of $100 in U.S large-cap stocks, they would invest $40 in a large-cap value fund and $60 in a large-cap growth fund—likewise in mid-cap funds. In small-cap funds, the amounts would be reversed, with $60 going into the small-cap value fund and $40 into a small-cap growth fund.
Alternatively, an investor may look at Table 2 and conclude that it’s time for value to make a comeback—similar to the results in the top half of the table. A distinct value tilt would be in order with that perspective. But it would be based on the notion that the pendulum—favoring growth since 2009—is due to swing back in favor of value stocks.
In either case, the course of action will be similar: Have exposure to both growth and value stocks!
Portfolio Strategies

Portfolio Strategies

AAII How-To

JOHN L from NJ posted over 2 years ago:
ROBERT A from NC posted over 2 years ago:
BARRY J from TX posted over 2 years ago:
BARRY J from TX posted over 2 years ago:
You need to log in as a registered AAII user before commenting.
Log InCreate an account