



The AAII Asset Allocation Models provide individual investors with guidance on reasonable asset allocations that take into account their time horizon and ability to withstand short-term market volatility. The models incorporate three key building blocks to a successful allocation strategy: stocks, bonds and cash.
We use seven Vanguard index mutual funds to illustrate the overall portfolio return and volatility in different market environments across the three models—aggressive, moderate and conservative. The Vanguard funds used within the allocation models are widely available, have low expenses, don’t have sales loads and have generally low investment minimums. Index funds were purposely chosen as a starting point for the analysis to minimize expenses and limit the impact made by active managers. Index funds are an effective way to construct a low-cost diversified portfolio that requires very little oversight, beyond a periodic check to ensure that the allocation is still within your desired range.
Of course, you can always treat the Vanguard funds as a starting point and seek out substitutes that match up with your income preferences or investment style. In this article, we present index mutual funds and exchange-traded funds (ETFs) that move outside of the neutral blended style by focusing on growth or value.
Market-Cap Weighting
Weighting by market-capitalization is the most common way to construct indexes. In a market-cap-weighted index such as the S&P 500 index, the proportional weight of each company is determined according to the total market value of its outstanding shares. Market cap is simply the number of shares outstanding times the share price. The index is rebalanced quarterly and by its nature the price performance of its largest holdings has a greater impact on the index.
The smallest company in the S&P 500 has a market cap of $3.950 billion, while the largest has a market cap of $2.295 trillion. The average market cap is $71.399 billion.
The largest company—Apple Inc.  (AAPL)—makes up 6.3% of the index. Apple, Microsoft Corp. (MSFT), Amazon.com Inc. (AMZN), Alphabet Inc. Class A (GOOGL), Berkshire Hathaway Inc. Class B (BRK.B), Alphabet Inc. Class C (GOOG), Nvidia Corp. (NVDA), ExxonMobil Corp. (XOM), UnitedHealth Group Inc. (UNH) and Tesla Inc. (TSLA) are the top 10 constituents and account for 24.9% of the index. With a cap-weighted index, popular stocks can become an overweighted segment of the index, leaving the less popular and potentially underpriced stocks underweighted. By design, smaller companies compose a smaller percentage of cap-weighted indexes.
There is nothing inherently wrong with market-cap-weighted indexes, but you need to understand the repercussions and limitations of employing them in your portfolio. For example, the Dow Jones U.S. Total Stock Market index is designed to measure the performance of all U.S. stocks with readily available prices. It includes 4,252 companies, with market caps as small as $1.16 million as of January 31, 2023. But the index is still market-cap weighted and the top 10 constituents of the S&P 500 are also the top 10 constituents of this total market index and account for 21.0% of the index.
If you are truly seeking to gain meaningful exposure outside of the largest handful of companies, you are better off selecting separate large-, mid- and small-cap funds. And if you are looking to tilt your portfolio toward growth or value investing styles, there are many options available even within the low-cost passively managed index fund and ETF arena.
How We Selected the Growth and Value Index Funds and ETFs
In the November 2022 issue of the AAII Journal, we presented some options other than the Vanguard choices for index mutual funds and ETFs that also follow blended, market-cap-weighted indexes.
For this article, we present index fund options for mutual fund and ETF investors that fit into the large-, mid- and small-cap segments, but that are also focused on value or growth. We intended to include foreign equity index funds and ETFs that had a value or growth focus, but only two options came up: the foreign large growth Vanguard International Dividend Appreciation Admiral index fund (VIAAX) and the foreign large value Vanguard International High Dividend Yield Admiral fund (VIHAX).
Our base fund screen focused on index funds with at least a five-year history and a minimum of $250 million in total assets. We excluded funds with an expense ratio in the highest 20% of funds in the same category (an expense ratio grade of F). For mutual funds, we looked for funds classified as no-load that are not geared toward institutional investors or only available to investors in retirement or advisory accounts. For ETFs, we required an average daily trading volume above 10,000 shares.
We present the passing index mutual funds and ETFs in three separate tables: Table 1 focuses on growth, Table 2 has value funds and Table 3 contains dividend-focused funds. The results are grouped by size. Mutual funds and ETFs are segmented as well. The funds and ETFs within each size grouping are sorted by the index they track to allow you to compare the options for each specific index.
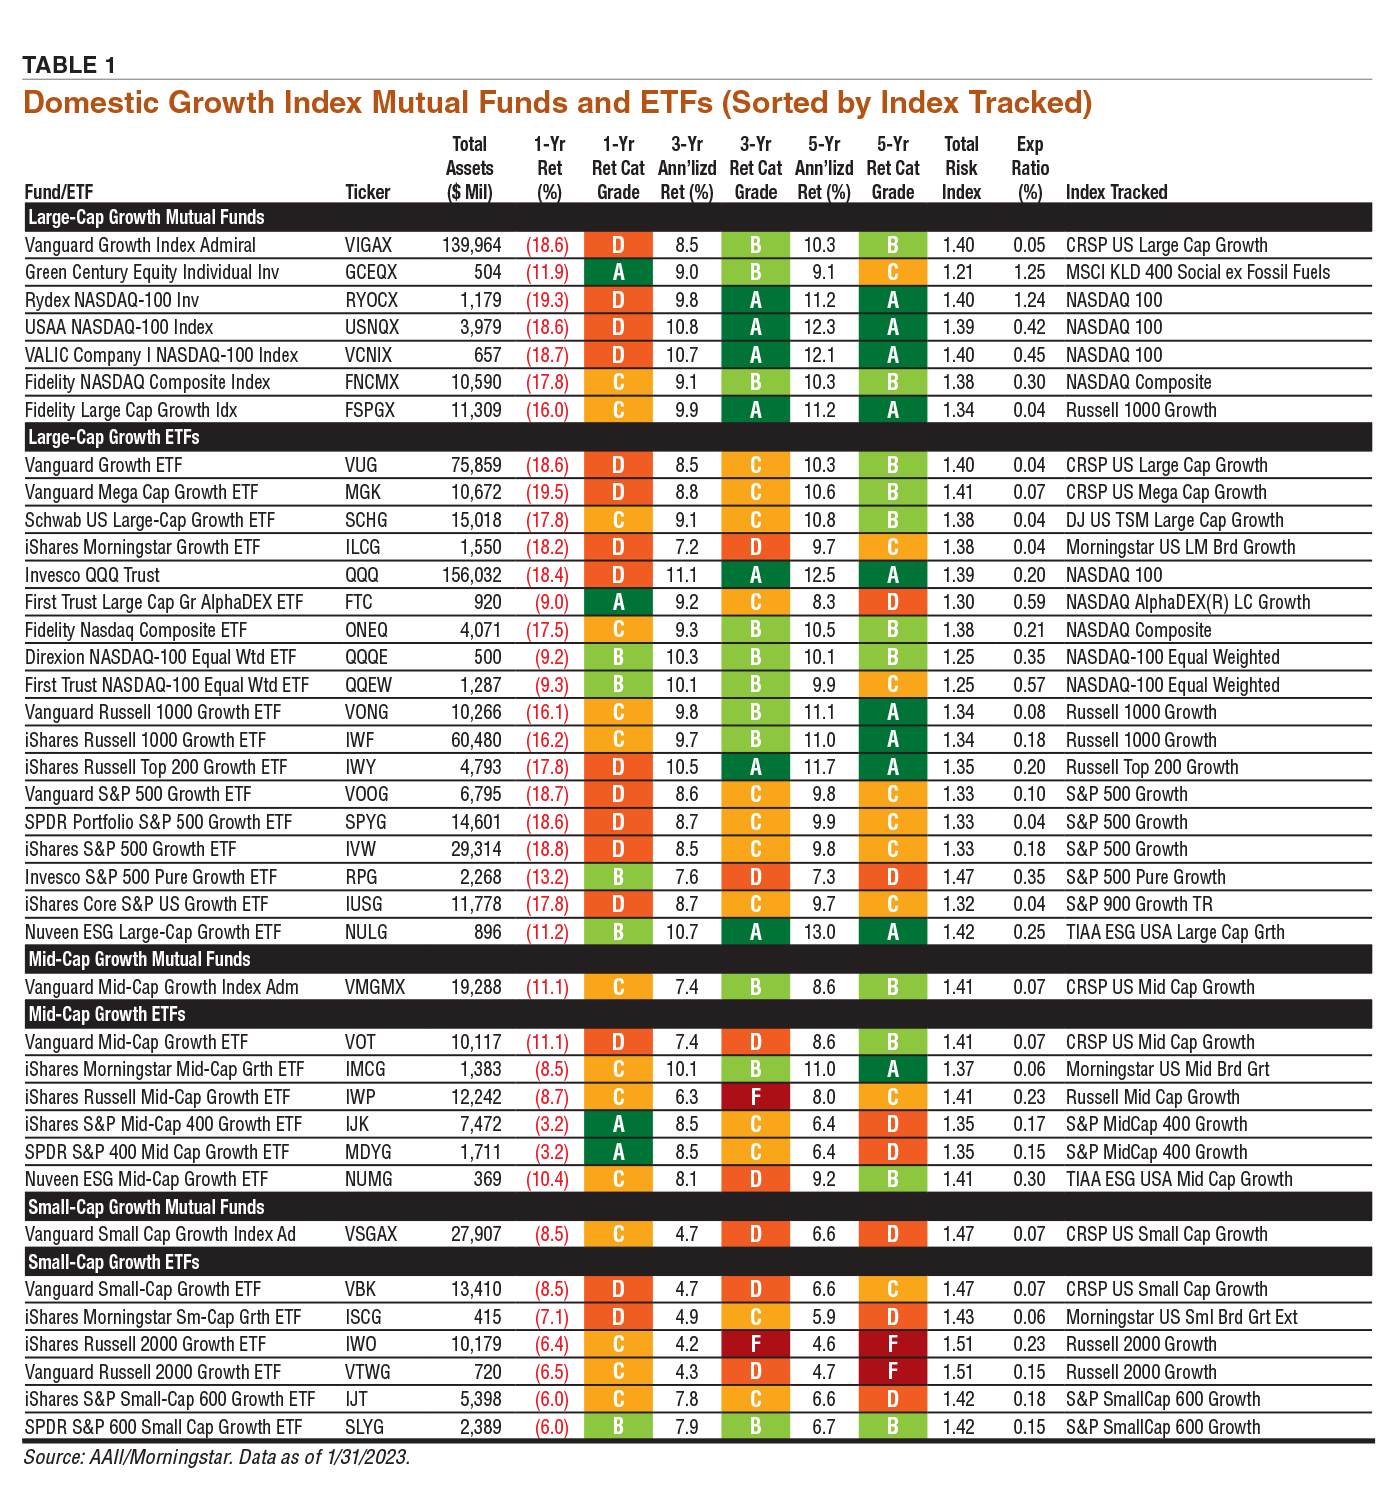
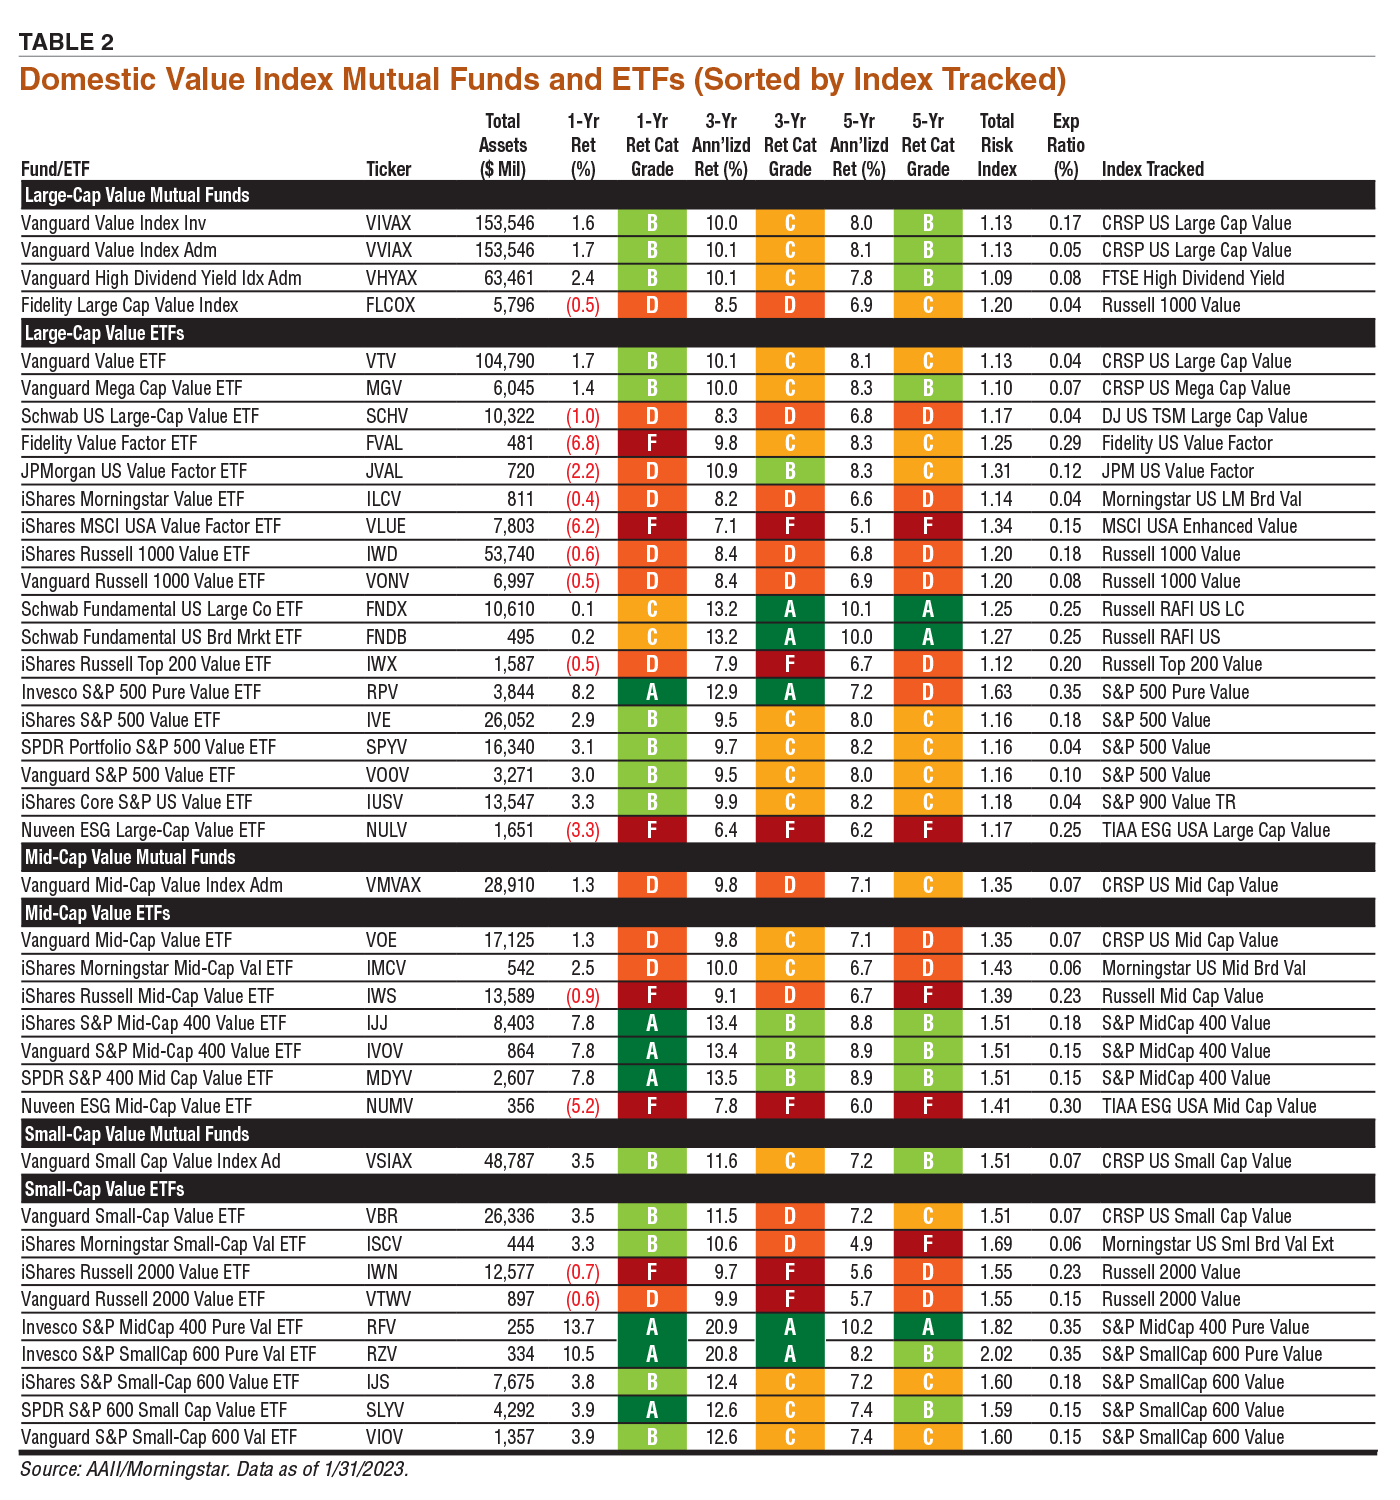
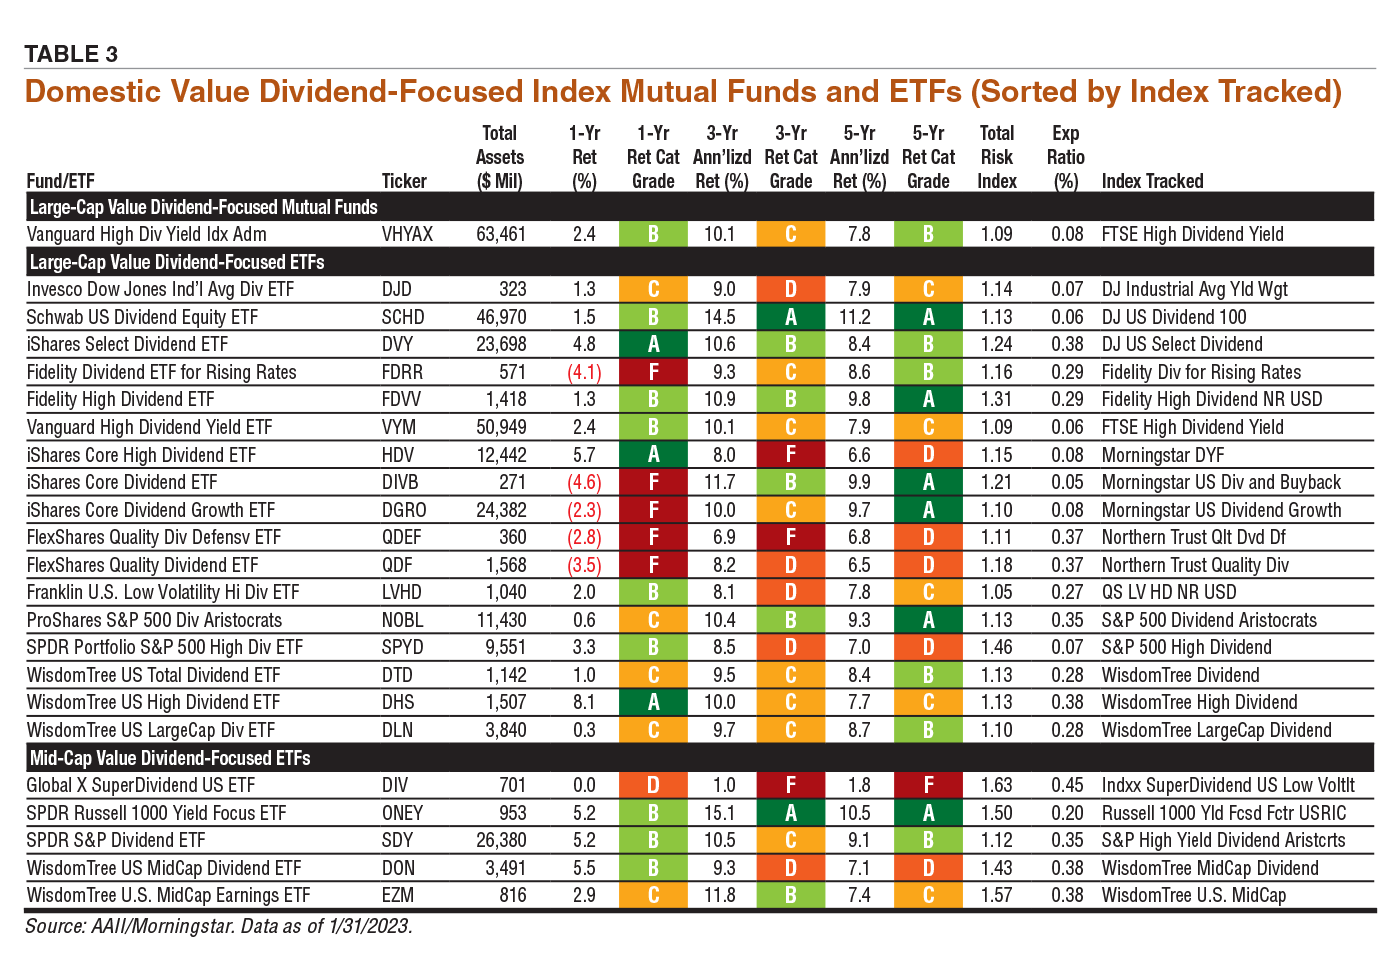
The total assets column lists the total assets under management and provides an indication of the funds’ popularity. Funds with greater assets under management should have lower expense ratios. We present total returns over the last year, three years and five years. Generally speaking, growth approaches have outperformed value approaches over the past several years, but value approaches shone on a relative basis last year. The return grades help to highlight performance within a fund’s or ETF’s category. A grade of B for funds in the large-cap growth category should not be compared to a grade in a different category such as large-cap value or small-cap growth. Note that we use Morningstar’s fund category designations, and all of the dividend-focused funds are within the value category of their market-cap group. You can therefore compare the return grades of the dividend-focused funds with value funds of the same size category.
For risk, we present the total risk index, which compares a fund’s volatility to that of the average fund in the entire fund or ETF universe. This should provide a better picture of how a fund’s volatility relates to another fund, even in a different category.
The expense ratios vary quite a bit across the funds and ETFs presented in these tables. Since they are all index funds, you would expect to see below-average expense ratios. When no limitations on choice exist (e.g., fund availability, transaction cost considerations, etc.), opting for the mutual fund or ETF with the lowest expense ratio is a good rule to follow. This said, a difference of just a few basis points (e.g., an expense ratio of 0.03% versus 0.05%) will have a minimal impact on your wealth. The impact of the high 1.24% expense ratio of the large-cap growth Rydex Nasdaq-100 Investor fund (RYOCX) can be readily seen compared to the other funds and ETFs tracking the Nasdaq 100 index with annual expense ratios as low as 0.20%.
The last column notes the benchmark that the index fund tracks. When considering any index fund, pay attention to the index followed. Differences in the index tracked can lead to differences in the returns realized by two funds with similar names.
When in doubt about how an index is constructed or what it is designed to do, search online for the fund’s underlying index or indexes along with the words “fact sheet” or “methodology.” As the popularity of index funds has grown, so have the fees collected by firms that create and calculate the indexes and in turn license the use of their indexes. A handful of giants dominate the index benchmarking business: It is estimated that S&P Global, MSCI and FTSE Russell control 70% of the index market.
Growth Index Funds
Growth funds seek out stocks of companies that are projected to grow faster than typical stocks of similar size. The index methodology will play a key role in how companies are specifically selected for inclusion in the index. Growth can be defined based upon high growth rates for earnings, sales, book value and/or and cash flow. Growth can also encompass high valuations, in which the growth universe excludes companies with low price multiples [e.g., the price-earnings (P/E) ratio] and high dividend yields.
For example, the Center for Research in Security Prices (CRSP) classifies growth securities using the following factors: future long-term earnings growth, future short-term earnings growth, three-year historical earnings growth, three-year historical sales growth, current investment-to-assets ratio and return on assets (ROA). (CRSP classifies value securities using the following factors: book value relative to price, forward earnings relative to price, historical earnings relative to price, dividend relative to price and sales relative to price.)
In contrast, FTSE Russell looks for companies with relatively higher price-to-book-value (P/B) ratios, higher I/B/E/S forecast medium-term (two-year) earnings growth and higher historical sales growth (five years).
We excluded price momentum-focused index funds and ETFs but kept in the technology-focused funds that invest in companies listed on the Nasdaq stock exchange. Eight mutual funds and ETFs in Table 1 have indexes tied to the tech-oriented Nasdaq composite or the more concentrated Nasdaq 100.
Value and Dividend-Focused Funds
As we were segmenting the value-oriented funds, we noticed that over one-third of value index funds had a dividend focus. In some ways, just as the tech-focused Nasdaq index funds fall into the growth camp, dividend-oriented funds tend to fall into the value camp. With 23 dividend-oriented index funds and ETFs passing our value screen, we separated them into their own table. Typically, mature companies past their rapid growth phase start to generate excess cash flow that does not need to be reinvested in the business and can be paid out to shareholders as cash dividends. As a rule, larger companies normally have higher dividend yields than smaller companies; all of the dividend-focused value funds fall into the large- or mid-cap segments.
Summary
A good part of the difference between the performance of growth and value indexes can be explained by sector moves and weights. Growth indexes tend to be dominated by the technology and consumer discretionary sectors, while value indexes are often concentrated in financial, industrial and utility sectors.
Market leadership historically has rotated so that no single method of investing consistently outperforms. It is important to take a long-term view and maintain diversification in your investment approach. Successful investing is challenging enough without trying to chase the leading investing style.

Related

Portfolio Strategies
Index Fund Options for AAII's Asset Allocation Models
Related

AAII How-To
Comparing Funds That Track the Same Index
Discussion
FREE REPORT

Get your free copy of our special
report analyzing the tech stocks
most likely to outperform the
market.
JOHN L from NJ posted over 3 years ago:
SUSAN F from OR posted over 3 years ago:
JEAN H from IL posted over 3 years ago:
VIVEK S from IL posted over 3 years ago:
BARRY J from TX posted over 2 years ago:
BARRY J from TX posted over 2 years ago:
You need to log in as a registered AAII user before commenting.
Log InCreate an account