


Related

AAII How-To
Screening based on finding out-of-favor companies that are beginning to show signs of awakening.

Value investing consists of buying unappreciated or ignored stocks at attractive prices. Value investors seek stocks that are attractively priced relative to some measure of intrinsic worth—for instance, they look for stocks selling at temporarily low multiples of price relative to book value, cash flow, earnings or sales. The idea is that, while these stocks may be beaten down, eventually the market will realize the worth in these firms and prices will rise. While value investing has historically outperformed the more glamorous growth investing approach, the approach can also fall out of favor at times.
In the book “Investment Titans” (McGraw-Hill, 2001), Jonathan Burton talks with a value investor who made a name for himself, first in the realm of academia and then in the investment management arena: Josef Lakonishok. This professor-turned-money manager is one of the founding principals at LSV Asset Management. Other firm-founding principals include fellow academicians Andrei Shleifer and Robert Vishny. The firm’s philosophy is to buy out-of-favor companies that are beginning to show signs of awakening.
Over the long run, according to Lakonishok, value outperforms growth because investors don’t expect much from it. When a value stock does better than expected, investors are pleasantly surprised and are more apt to reward the company by bidding up the stock.
In contrast, Lakonishok believes investors expect too much from growth stocks. It is unrealistic to believe strong growth lasts forever. Eventually, the company will miss an earnings target or lower its earnings guidance, and the market will punish the stock price.
We developed the AAII Lakonishok screen in AAII’s fundamental stock screening and research program Stock Investor Pro. Our screen is an interpretation of Lakonishok’s methodology, as outlined in “Investment Titans.” AAII members can also access the screen and its passing companies on AAII.com.
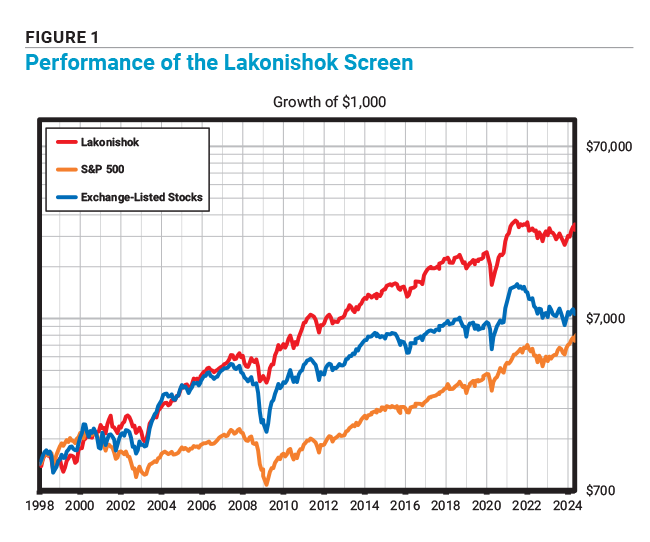
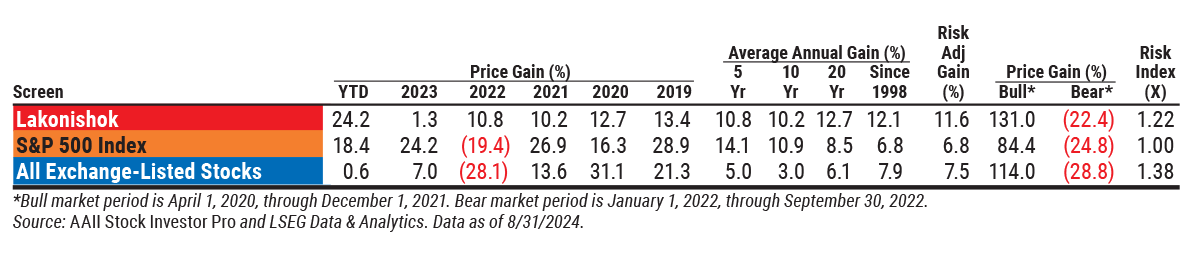
The long-term price performance of the Lakonishok screen, assuming monthly rebalancing, has been strong. As shown in Figure 1, the screen has an average annual gain of 12.1% since 1998, compared to 6.8% for the S&P 500 index and 7.9% for all exchange-listed stocks. The Lakonishok screen has a risk index of 1.22, indicating that it has been 22% more volatile than the S&P 500, but the risk-adjusted gain of the hypothetical model portfolio remains above that of the market.
Value strategies have underperformed growth strategies recently, and that shows up in both the five- and 10-year return periods, during which the Lakonishok screen underperformed the S&P 500. An examination of the annual returns is also a great way to reveal how strongly the performance can vary over time and if the relative performance is consistent or related to just a few periods.
Seventy-six stocks currently pass the Lakonishok screen, above the long-term average of 20. Table 1 lists the 25 passing companies as of September 16 with the highest relative price strength over the last 13 weeks. (Go to AAII Guru Screens for an updated list of stocks passing this screen.)
In order to qualify as potentially undervalued, a company’s price-to-book-value (P/B), price-to-cash-flow (P/CF), price-earnings (P/E) or price-to-sales (P/S) ratio needs to be below the respective industry median. But companies that meet one of these criteria may not meet your own personal definition of “undervalued.”
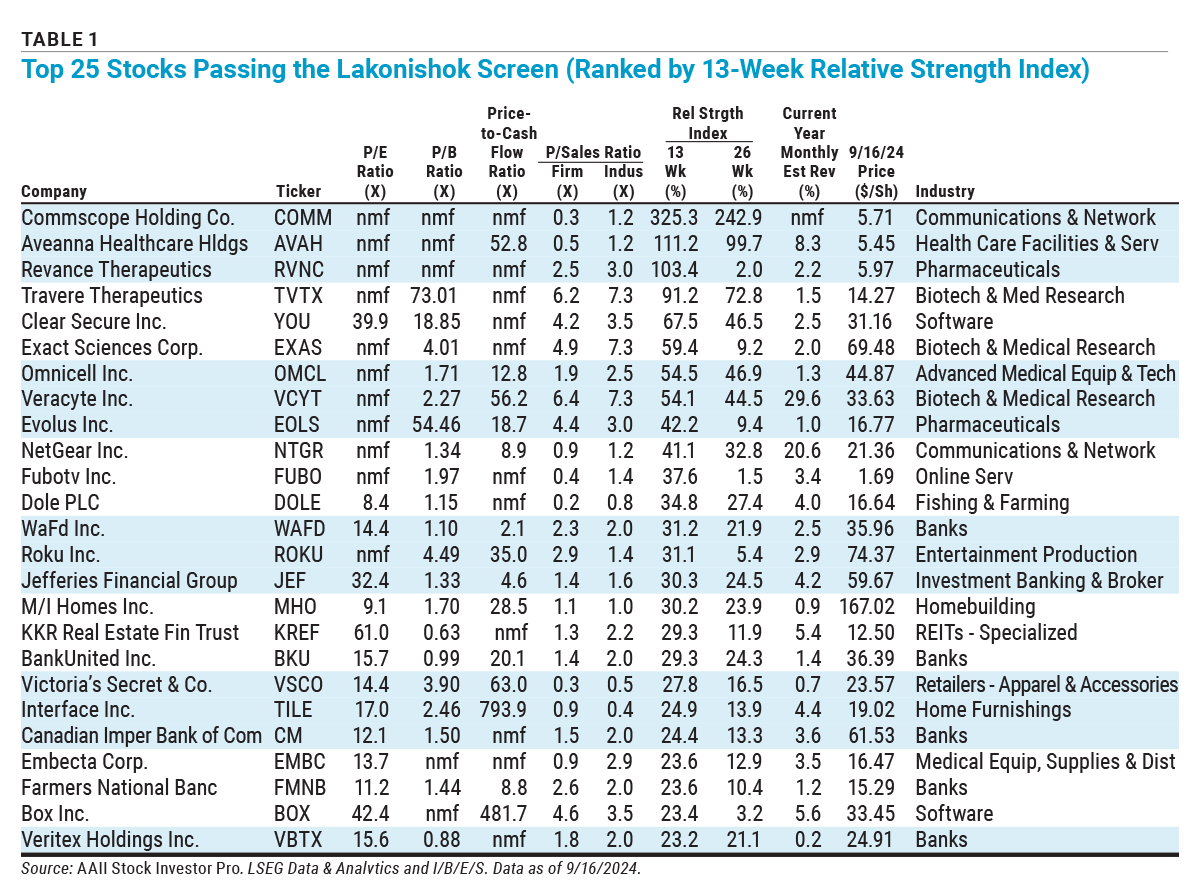
Take, for example, Roku Inc.  (ROKU). The primary valuation reason the company passed the AAII Lakonishok screen is because its current price-to-cash-flow ratio of 35.0 is below its industry median of 49.8. The company does not currently have a meaningful price-earnings ratio and its price-to-book and price-to-sales ratios are above the respective industry medians.
The AAII Lakonishok screen requires a stock to have outperformed the S&P 500 over the last 26 weeks and have a 13-week relative strength index that is greater than or equal to its 26-week relative strength index. The relative strength index measures how a stock has performed in relation to the S&P 500 in percentage terms. Company performance that is equal to that of the S&P 500 is represented by a relative strength index of 0%; companies outperforming the S&P 500 have positive relative strength figures, while those underperforming the S&P 500 have negative relative strength values. Over the last 13 weeks, Commscope Holding Co. Inc. (COMM) is the top-performing stock passing the Lakonishok screen relative to the S&P 500, with a 13-week relative strength index of 325.3% due to its 342.6% price change. The stock has a 52-week price range of $0.86 to $5.73 per share.
Another way Lakonishok gauges whether a company’s prospects are improving is by examining analyst sentiment, as measured by consensus earnings estimate revisions.
In order to pass the AAII Lakonishok screen, a company cannot have any downward revisions to its current fiscal-year earnings estimate over the last month and must have at least one upward revision over the same period. Furthermore, the screen requires that the company’s consensus estimate for the current fiscal year has increased over the last month. Intuitively, you may expect that if there has been at least one upward revision and no downward revisions, the consensus estimate would automatically increase. However, this is not always the case, as analysts may drop coverage, which could lower the consensus estimate without an actual downward revision.
The characteristics of the stocks currently matching the Lakonishok criteria are presented in Table 2.
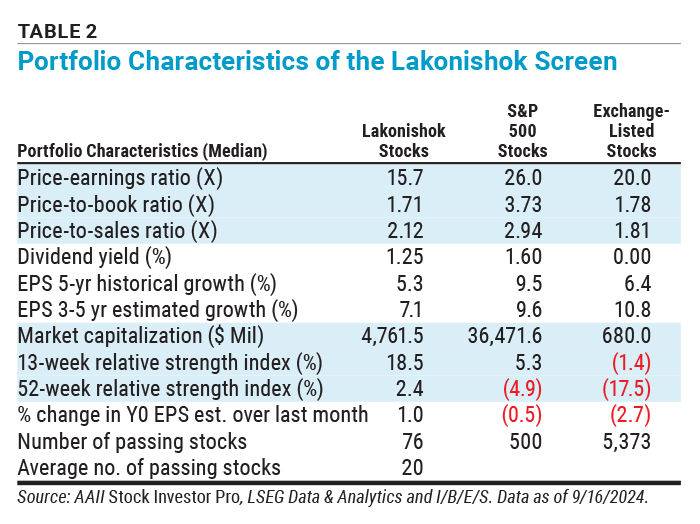
Given that Lakonishok seeks value companies, it is not surprising to find that the median price-earnings ratio of 15.7 for those companies currently passing the AAII Lakonishok screen is below the exchange-listed stocks median of 20.0 and below the S&P 500 constituents median of 26.0.
This relationship also holds true with the price-to-book ratio, as the median for the Lakonishok stocks is 1.71, while the median value is 3.73 for the S&P 500 constituents and 1.78 for all exchange-listed stocks. However, the current Lakonishok passing stocks have a price-to-sales ratio of 2.12, lower than the median for the S&P 500, but above the 1.81 median for exchange-listed companies. Price-to-sales ratios are difficult to compare across companies in different industries since companies and industries with higher profit margins normally trade with higher price-to-sales ratios. A company that converts each dollar of sales into a higher level of earnings deserves to trade with a higher price-to-sales ratio. The strength of the Lakonishok approach is that it relates each valuation metric to the industry norm.
There are no elements of growth in the AAII Lakonishok screen, and companies currently passing the screen have a lower median historical earnings growth rate (5.3%) than that of the typical exchange-listed stock (6.4%) and much lower than the median for the S&P 500 constituents (9.5%). This relationship holds true for the median consensus estimated earnings growth rate of these stocks, which is 7.1% compared to 10.8% for all exchange-listed stocks.
The median market capitalization of the Lakonishok stocks is $4.8 billion, compared to only $680.0 million for all exchange-listed stocks. Larger stocks tend to be more mature, and older, more mature firms tend to have fewer growth opportunities going forward.
As mentioned, the AAII Lakonishok screen requires a stock to have outperformed the S&P 500 over the last 26 weeks and at least maintained that price strength over the last 13 weeks. The companies currently passing the AAII Lakonishok screen have outperformed the S&P 500 by a median value of 18.5% over the last 13 weeks and 2.4% over the last 52 weeks. Meanwhile, the typical exchange-listed stock has underperformed the S&P 500 by 1.4% over the last 13 weeks and 17.5% over the last 52 weeks. Note that Table 2 presents the median values of the current constituents of the S&P 500, so, as a group, the S&P 500 companies have outperformed the market-cap-weighted index value by 5.3% over the last 13 weeks but underperformed the index value by 4.9% over the last 52 weeks.
Lastly, Lakonishok looks for stocks with rising earnings estimates. Over the last month, the Lakonishok companies’ median consensus earnings estimate for the current fiscal year has increased 1.0%, while it has declined 0.5% for the S&P 500 stocks and 2.7% for all exchanged-listed stocks.
Value investing has great appeal for the bargain shopper. When checking for confirmation that a company deserves a closer look, it can be helpful to go beyond a single valuation metric and examine relative price strength and upward earnings estimate revisions. By finding undervalued companies that are beginning to stir, you may be able to get in on the “ground floor” if and when the rest of the market catches on.
As always, however, stock screening is only a first step. You will want to do your homework to see why these companies are at their current levels. Only then will you gain insight into those that will continue to languish and those that may eventually flourish.
AAII How-To

First Cut Stocks

Portfolio Strategies

LEN M from PA posted over 2 years ago:
BARRY J from TX posted over 2 years ago:
You need to log in as a registered AAII user before commenting.
Log InCreate an account