


Related

First Cut Stocks
Unlike cyclical stocks, secular growers can sustain high growth rates for surprisingly long periods.

Wayne Thorp leads a class in AAII's new Essential Investing Video Course. Go to https://www.aaii.com/ves for more information and to subscribe.
In every generation, a small number of businesses don’t just grow—they transform the world around them.
These aren’t companies chasing the latest trend or riding the tailwind of a strong economy. They are the trend. Their products shift habits. Their platforms reshape industries. Their growth isn’t a moment, it’s a movement.
While most investors fixate on quarterly results, economic cycles or the latest Federal Reserve meeting, a different class of investor takes a longer view—one that spans decades, not months. These investors seek out the perpetual growers, the businesses powered by deep structural change. They aren’t playing earnings roulette. They’re building wealth patiently by aligning with history’s most significant tailwinds.
This is the essence of secular growth investing, a strategy that’s as much about mindset as it is about metrics.
Secular growth refers to long-term, structural expansion in specific industries or business models that persists across economic cycles. These are not short bursts tied to market booms, fads or temporary demand shifts, but rather profound transformations fueled by innovation, demographic shifts, technology adoption, regulatory reform or lifestyle evolution.
Examples include:
Secular growth stocks tend to ride these mega-trends for five, 10 or even 20 years or more. They often benefit from compounding effects—such as network expansion, economies of scale and brand entrenchment—that reinforce their dominance and increase returns over time.
While secular growth represents long-term structural expansion, what truly separates enduring secular trends from temporary disruptions?
True secular growth trends share a common trait: Once adopted, there’s no going back. Consider how cloud computing transformed enterprise software. Companies don’t return to on-premise servers after experiencing the flexibility and cost savings of the cloud. This irreversibility creates a one-way adoption curve that compounds over decades.
Ask yourself: “Can I imagine society reverting to the pre-trend state?” If the answer is no, you’ve likely identified a secular trend.
Secular growth rarely follows a straight line. Instead, it typically traces an S-curve:
Understanding where a trend sits on this curve is crucial. The sweet spot for investors often lies in the early acceleration phase, after proof of concept but before mainstream saturation.
What sets secular growth apart from cyclical growth?
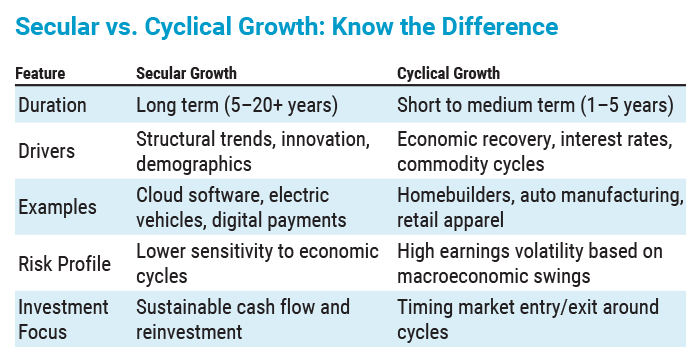
The core difference lies in what drives demand.
With secular growth, demand is created by structural change. People didn’t know they needed smartphones until they existed. The trend creates its own demand independent of economic conditions.
With cyclical growth, demand already exists but fluctuates in response to economic conditions. People always need houses, cars and clothing—they just buy more when times are good and defer purchases when times are tough.
Cyclical businesses face elastic demand—that is, small changes in economic conditions resulting in significant fluctuations in volume. When unemployment rises 2%, auto sales might drop 20%.
Secular growers often enjoy inelastic demand because they’re solving new problems or creating new capabilities. During the Great Recession, iPhone sales actually accelerated because the value proposition transcended economic cycles.
Cyclical earnings follow a predictable boom-bust pattern.
Peak earnings for cyclicals are unsustainable. That 30x price-earnings (P/E) ratio on peak earnings might represent terrible value.
Secular growth earnings show different characteristics, creating a compound machine.
Unlike cyclicals, secular growers can sustain high growth rates for surprisingly long periods because they’re expanding their addressable markets, not just capturing shares of existing demand.
In cyclical industries, market share tends to remain stable throughout cycles. Ford Motor Co.  (F), General Motors Co. (GM) and Stellantis N.V. (STLA) have been competing for the same market share for decades. During booms, everyone grows. During busts, everyone shrinks. The relative positions rarely change dramatically.
Secular trends often produce dominant winners that capture disproportionate value. Alphabet Inc.’s (GOOGL) Google didn’t just take search market share, it expanded what search could do. Netflix Inc. (NFLX) didn’t split the video rental market with Blockbuster Inc., it created an entirely new consumption model.
This concentration happens because secular trends often involve:
Cyclical businesses typically require heavy capital investment to maintain a competitive position. Steel mills, auto plants and semiconductor fabrication plants require ongoing upgrades just to remain competitive. This capital intensity amplifies cyclical swings—high fixed costs mean operating leverage cuts both ways.
Secular growth businesses often become less capital intensive as they scale. Software, platforms and networks show increasing returns to scale. This creates a virtuous cycle where growth actually improves returns on capital over time.
Leadership behavior reflects the growth type. Cyclical management focuses on:
On the other hand, secular growth management emphasizes:
Secular growth investors gain more than just economic exposure. They gain a behavioral edge.
Cyclical stocks often experience volatile investor sentiment, as booms lead to overenthusiasm and busts to despair. Secular growers, by contrast, reward long-term holders who stay the course and disregard short-term fluctuations.
The behavioral edge comes from understanding:
One of the biggest challenges for secular growth investors is the valuation dilemma. These companies frequently trade at premium multiples, which makes value investors uncomfortable. Why does this happen?
Secular growth companies often show modest reported earnings because they’re reinvesting aggressively to capture their massive opportunity. Amazon.com Inc. (AMZN) famously operated at near-zero margins for years while building its logistics network. Traditional price-earnings ratios miss this dynamic entirely.
Instead, focus on:
High-multiple secular growers carry interest rate sensitivity due to their long-duration cash flows. However, they often prove more resilient than cyclicals during downturns because their growth drivers persist regardless of economic conditions. During the Great Recession, cloud adoption accelerated as companies sought cost savings—a counterintuitive outcome that rewarded secular growth investors.
Even the best secular growers experience gut-wrenching declines. Amazon fell 95% during the dot-com crash. Netflix dropped 75% in 2011. These weren’t business failures—they were Mr. Market having a mood swing.
High-multiple stocks face amplified volatility for structural reasons. When the market’s risk appetite shifts, expensive stocks are hit hardest, regardless of their fundamentals. A stock trading at 50x earnings might see its multiple compress to 30x, even if the business continues to execute perfectly—that’s a 40% decline from multiple compression alone.
Volatility is the price of admission for secular growth investing. Those patience-fraying drops are precisely why these stocks offer superior long-term returns. If everyone could handle the volatility, the opportunity wouldn’t exist.
After years of rapid change, investors often assume innovation will slow. This “innovation fatigue” causes many to prematurely exit secular winners. Remember: Secular trends frequently last longer than anyone expects. The shift to e-commerce began in the 1990s and remains a significant trend in many categories and geographies.
Given that secular growth stocks often trade at elevated multiples, how do you separate tomorrow’s compounders from today’s overpriced story stocks? This challenge becomes even more complex when you consider a third category beyond secular and cyclical: glamour growth.
Glamour growth stocks represent the most dangerous category for investors. These companies:
They’re often last cycle’s winners, one-hit wonders or companies riding temporary trends that investors mistake for secular shifts. Think of the meal kit delivery companies of 2017 or the coronavirus pandemic darlings that soared in 2020—many showed explosive growth, attracting premium valuations. Still, few possessed the fundamentals to justify those multiples in the long term.
This is where AAII’s Growth Investing approach and model portfolio provide a solution.
AAII’s Growth Investing strategy combines academic research with real-world backtesting through two complementary tools: the A+ Growth Grade and Mohanram’s G-Score.
The A+ Growth Grade
This proprietary AAII metric captures the consistency and sustainability of business expansion by analyzing:
This approach brilliantly avoids both extremes—the stagnant value traps and the unsustainable rockets—focusing instead on repeatable, economically grounded growth that characterizes actual secular trends.
Mohanram’s G-Score
The G-Score is an eight-point academic framework developed by University of Toronto professor Partha Mohanram, specifically designed to evaluate high-growth companies. Each criterion is binary (1 point if met, 0 if not).
Profitability Signals:
Stability Signals:
Investment Intensity Signals:
AAII’s Growth Investing methodology requires companies to score 7 or 8 points—an exceptionally high bar. Based on Mohanram’s research, this elite tier outperformed low scorers (0–1 points) by over 21% annually.
Growth Investing is a premium AAII newsletter and 20-stock model portfolio. Started in October 2022, the long-term approach identifies stocks with consistent growth potential. For more information, go to the Growth Investing website.
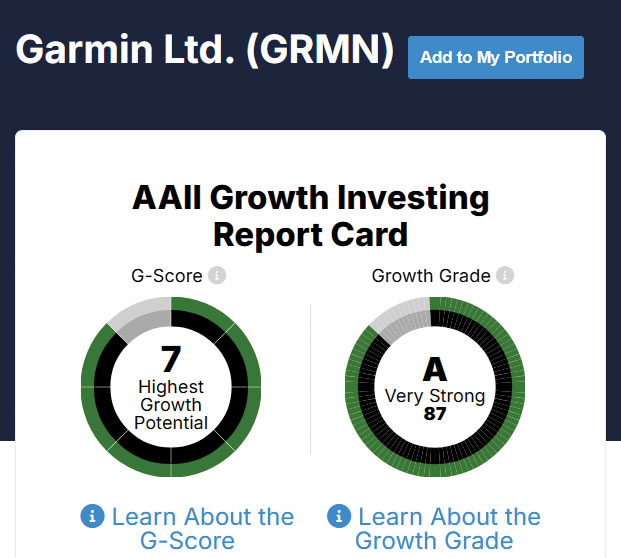
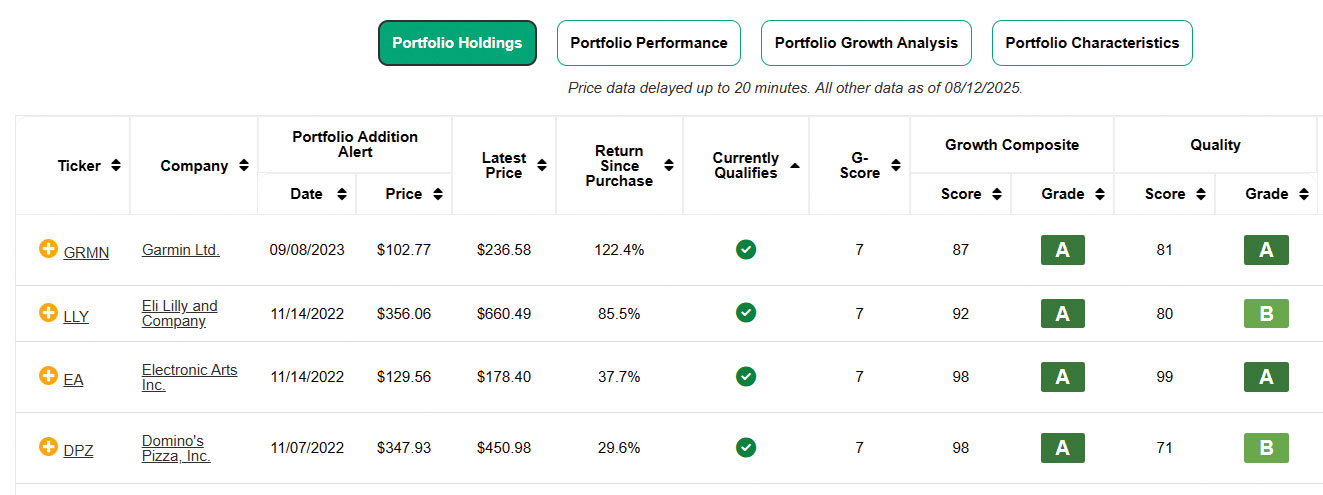
Combining the A+ Growth Grade with Mohanram’s G-Score addresses the valuation paradox directly. Many stocks in AAII’s Growth Investing model portfolio DO carry high valuations—that’s the reality of secular growth investing. The key is determining which expensive stocks deserve their premiums.
The G-Score acts as a quality filter for high-valuation growth stocks by:
When a stock scores well on both the A+ Growth Grade (for consistent growth) and the G-Score (for quality fundamentals), its high valuation often reflects justified optimism about sustainable secular trends, not just market hype.
The A+ Growth Grade automatically filters for moderate but consistent growth, exactly what characterizes sustainable secular trends versus glamour stocks showing unsustainable spikes.
The Growth Investing methodology’s high G-Score bar of 7 or 8 points ensures portfolios contain only the highest-quality growth stocks.
Once AAII’s screens identify a genuine secular grower, patience becomes your greatest asset. Let the secular tailwinds and compounding work their magic.
This framework helps you own the expensive stocks that deserve their premiums while avoiding the glamour traps that destroy capital.
First Cut Stocks



BARRY J from TX posted about 1 year ago:
You need to log in as a registered AAII user before commenting.
Log InCreate an account