


Related

AAII + BetterInvesting
The relative dividend yield serves as a valuation measure that helps indicate whether a company may be trading at a discount compared to its historical range.
by John Bajkowski | April 2026

Dividend-paying stocks attract many investors because they provide both income and the potential for long-term capital appreciation. But beyond generating income, dividends can also serve as a valuable tool for identifying potentially undervalued stocks. One of the most widely used measures for this purpose is the dividend yield.
The dividend yield is calculated by dividing the indicated dividend—the expected dividend payment over the next year—by the current share price. When a stock’s price rises faster than its dividend, the yield falls, suggesting that the price may have been bid up too high and could be vulnerable to a pullback. Conversely, when the dividend yield rises to a relatively high level, the stock may be undervalued and poised for a potential price increase—provided the dividend can be sustained.
Like the price-earnings (P/E) ratio, the dividend yield can help highlight stocks that may be temporarily out of favor. Contrarian techniques such as this are based on the premise that markets often overreact to good or bad news, pushing a stock’s price away from its intrinsic value. Investors attempt to identify these mispriced opportunities using a set of rules known as a valuation model. Valuation models provide a framework for analyzing a stock and asking the right questions—a process that helps keep emotions from driving investment decisions.
Many investors also seek out dividend-paying stocks because they offer a combination of regular income, financial stability and long-term return potential. Unlike companies that rely solely on price appreciation to reward shareholders, dividend-paying firms return a portion of their profits directly to investors, typically through quarterly cash payments. These payments can provide a dependable income stream, help cushion portfolios during periods of market volatility and, when reinvested, contribute significantly to long-term returns. Because it is primarily mature firms that pay significant dividends, dividend analysis is geared toward established firms that are past their explosive growth and cash-consuming stage.
Stock screens provide a disciplined way to identify groups of stocks that warrant further analysis. When screening for dividend-paying stocks, investors typically use either absolute or relative dividend yield levels.
An absolute screen requires a minimum yield before a stock qualifies for consideration—for example, a dividend yield of at least 3%. This approach can sometimes lead to passive market timing. During periods when valuations are elevated and few stocks meet the minimum requirement, investors may naturally hold higher cash balances. However, screens based solely on absolute levels can also be limiting because they tend to highlight companies from industries that traditionally have higher dividend yields, such as utilities or real estate investment trusts (REITs).
Relative dividend yield screens take a different approach by comparing a stock’s yield to that of a benchmark that adjusts over time, such as the S&P 500 index. Rather than requiring a fixed minimum yield, the investor looks for stocks whose yield is attractive relative to the benchmark. Common comparisons include the overall market, industry averages, historical norms or even interest rate benchmarks. In this strategy, the stock’s historical average dividend yield is often used as the benchmark to help identify potentially undervalued opportunities.
AAII tracks a high-yield screening strategy that looks for companies with the following characteristics:
A history of rising dividends suggests that management has consistently emphasized returning income to shareholders.
The relative dividend yield serves as a valuation measure. It helps indicate whether a company may be trading at a discount compared to its historical range. Higher yields can signal a more attractive valuation, although they may also reflect concerns about a company’s business conditions or financial health. For this reason, careful analysis is essential before investing.
Above-industry-average earnings growth suggests that a company’s profitability may support higher dividends in the future. While this does not guarantee dividend increases, it improves the likelihood that the company will have the financial capacity to raise its payout. A relatively low dividend payout ratio (dividends per share divided by earnings per share) provides additional flexibility, leaving more room for dividend growth.
Lower levels of debt can also support dividend stability and growth because less cash is required to service interest and principal payments. Comparing the ratio of liabilities to assets to the median for the industry allows the strategy to account for differences in capital requirements across industries.
AAII publishes a list of companies that pass the High Relative Dividend Yield screen for members on the new Investor Hub, along with the performance of the strategy based on a hypothetical portfolio.
The AAII High Relative Dividend Yield screen has outperformed the S&P 500 on a cumulative basis since inception. From January 1998 through February 27, 2026, the strategy achieved a compound annual growth rate of 8.7% (Figure 1). By comparison, the S&P 500 returned 7.2% annually over the same period. These figures exclude dividend payments; returns would have been higher if dividend payments were included in the calculations.
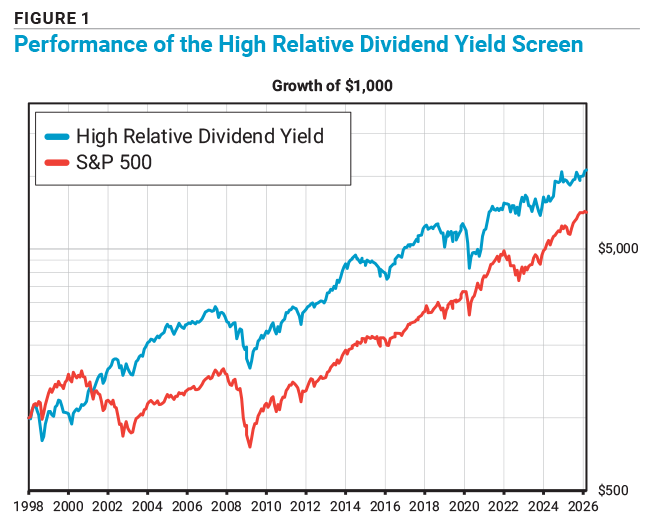

The High Relative Dividend Yield screen has a risk index of 1.09, indicating that it has been about 9% more volatile than the S&P 500. Despite the higher volatility, the risk-adjusted return of the hypothetical model portfolio remains above that of the market.
An examination of the year-by-year returns illustrates how performance can vary over time and whether the long-term results reflect consistent returns or are driven by a small number of strong periods. The income stream provided by dividends can help cushion portfolios during turbulent market conditions. As a result, the High Relative Dividend Yield screen has tended to decline less than the broader market during bear markets. However, because many dividend-paying companies are mature businesses that grow more slowly, the strategy has also tended to lag the market during strong bull market periods when higher-growth stocks lead.
Financial companies make up the largest share of passing companies, representing 48.1% of the 52 stocks currently meeting the screen’s criteria. Utilities companies rank second, accounting for 13.5%.
Although the screen looks for companies with dividend yields that are high relative to their own historical averages, dividend-oriented strategies often still favor sectors such as financials and utilities, where dividend payments tend to be more common and yields are typically higher.
Examining the financial and valuation characteristics of the companies currently passing the screen provides additional insight into how the strategy identifies potential opportunities.
Table 1 presents the characteristics of the companies currently passing the High Relative Dividend Yield screen. Generally, these companies trade at more attractive price-earnings and price-to-book-value (P/B) multiples than the S&P 500 and the typical exchange-traded stock, although their price-to-sales (P/S) ratios tend to be higher. Price-to-sales ratios are strongly influenced by industry profit margins and are thus more difficult to compare independently.
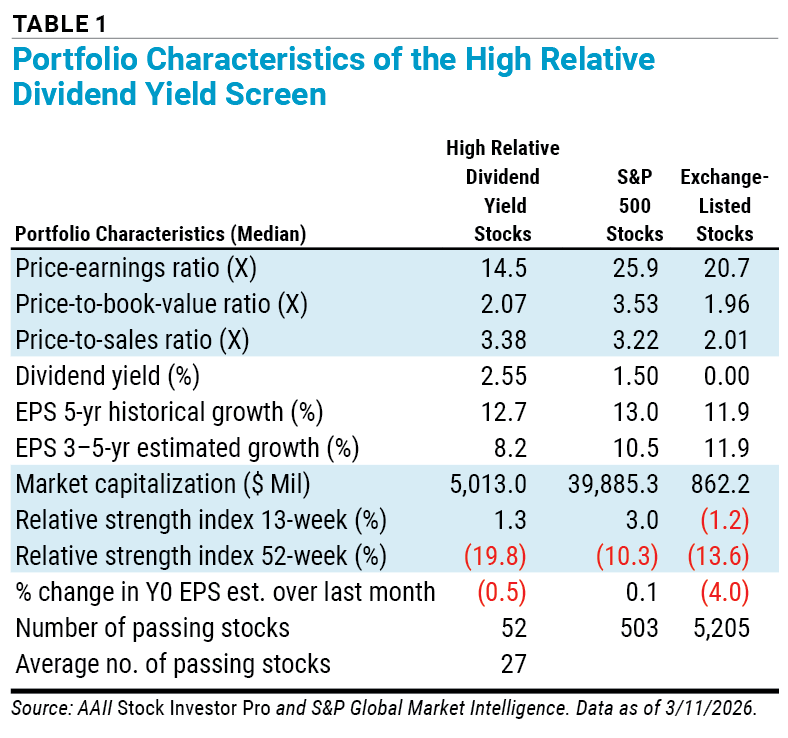
The historical earnings growth rates of the passing companies are roughly in line with other stocks. However, expected growth rates are slightly lower, reflecting the more mature nature of companies that emphasize steady dividend growth.
The stocks passing the screen are mid-cap in size and have underperformed the S&P 500 over the last year but have exhibited stronger performance more recently.
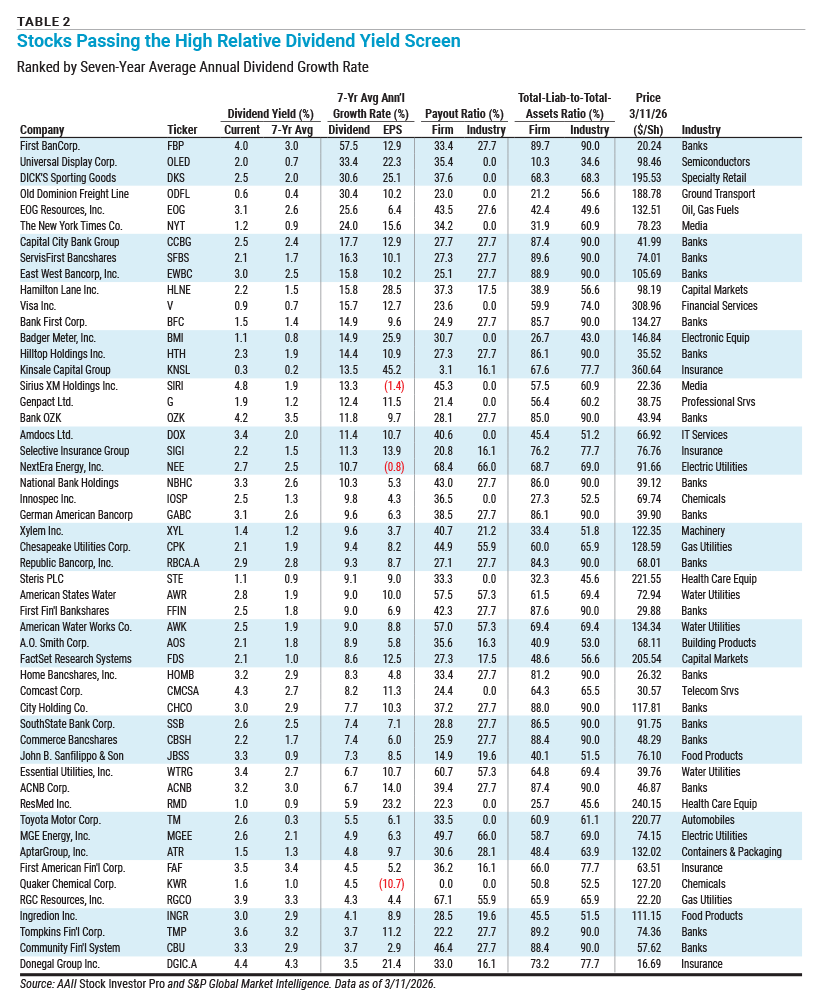
Fifty-two stocks currently pass the High Relative Dividend Yield screen, well above the average of 27. Table 2 lists the 52 companies that passed the screen using data as of March 11, 2026, ranked by their historical dividend growth rate.
Go to All Screens for an updated list of stocks passing this screen.
All 52 companies have increased their annual dividend payout over the last six years, but First BanCorp.  (FBP) has the highest historical annualized dividend growth rate of 57.5%, well above its 12.9% earnings growth rate.
The High Relative Dividend Yield screen does not require a minimum dividend yield to pass the filter. Instead, it focuses on the relationship of the current yield to the historical average yield. Old Dominion Freight Line Inc.’s (ODFL) current yield of 0.6% is above its historical average of 0.4%, supported by its strong 30.4% annual dividend growth rate.
Dividend payout ratio norms can vary by industry. Gas utility company Chesapeake Utilities Corp. (CPK) has a payout ratio of 44.9%, below the industry median of 55.9%. Debt levels also tend to vary by industry. Capital intensive industries with relatively stable cash flow can manage to carry higher financial leverage on their balance sheet. Chesapeake Utilities’ total-liabilities-to-assets ratio of 60.0% is comfortably below the industry median of 65.9%. The semiconductor industry is notorious for wide cyclical swings, making it risky to carry high levels of debt that require consistent interest payments. Universal Display Corp.’s (OLED) total-liabilities-to-assets ratio is only 10.3%, well below the semiconductor industry median of 34.6%.
The High Relative Dividend Yield screen identifies companies with strong dividend credentials that are trading at high yields relative to their own historical norms. By combining dividend history, valuation measures and financial strength indicators, the strategy seeks to highlight established companies that may be temporarily undervalued but still have the financial capacity to sustain and potentially grow their dividend payments.
Dividend-oriented strategies such as this can provide investors with a combination of income and value discipline. Because dividend-paying companies are often mature businesses with stable cash flows, they can help provide portfolio stability during periods of market volatility. At the same time, focusing on companies whose yields are elevated relative to their historical ranges helps investors identify situations where market pessimism may have pushed prices below their long-term valuation norms.
Keep in mind that stock screens such as this high-yield approach only represent the starting point in the investing process. Screening helps isolate companies with similar, quantifiable characteristics, but additional research is always necessary. Investors should review a company’s business model, financial health and long-term prospects to determine whether it fits their investing goals, time horizon and risk tolerance.
AAII + BetterInvesting

Stock Strategies

AAII How-To

You need to log in as a registered AAII user before commenting.
Log InCreate an account