


Related

First Cut Stocks
Dangerous dividends are ones that attract income-seeking investors with high but unsustainable returns. Warning signs to watch out for.

Derek Hageman leads a class in AAII's new Essential Investing Video Course. Go to https://www.aaii.com/ves for more information and to subscribe.
Solely looking for high yield as a means of selecting dividend stocks is not enough; you must also analyze the sustainability of the dividend payment and the growth of the firm. Investors must pay attention when dangerous dividends flash their warning signs. Dangerous dividends are ones that attract income-seeking investors with high but unsustainable returns.
What signs can you look for that indicate the safety of a company’s dividend payment stream?
Investors in dividend-paying stocks typically seek stocks that are paying steadily increasing levels of dividend income and have the cash flow and financial resources to continue paying the dividends.
There are red flags to watch out for in dividend-paying stocks to avoid the danger of losing both the dividend and capital. Those warning signs include:
A number of financial ratios and indicators on individual stocks are available at AAII.com. Key statistics are presented at the Stock Evaluator on the main Snapshot tab. These include the dividend yield, trailing 12-month earnings per share, net cash flow and profitability ratios such as return on equity (ROE) and return on assets (ROA). Dividend yield and earnings per share are also conveniently shown in My Portfolio for stocks you are following. For looking at trends over time, A+ Investor subscribers have access to several years of financial data, valuations and ratios at a stock’s Evaluator page.
Additional warning signs are summarized in the next sections. Overall, if the dividend yield and the payout ratios are both very high, tread carefully. There is an appeal to yields of 5% or greater. However, there is a reason why those yields are as high as they are and, in general, it isn’t a positive one.
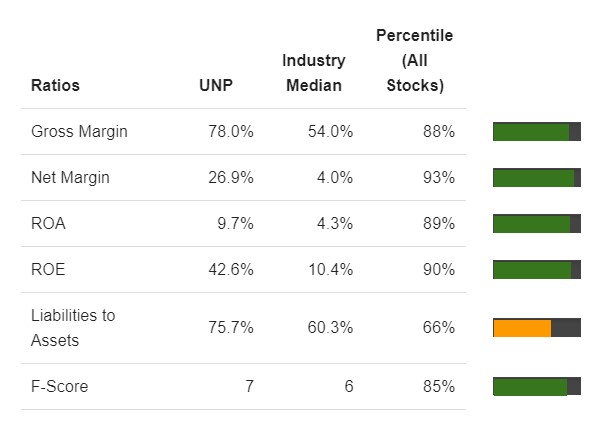
AAII’s Dividend Investing (DI) is a model portfolio service that focuses on finding stocks with sustainable and growing dividends. It includes two tools to help users identify high-quality dividend-paying stocks, the Dividend Screener and the Dividend Grader. Stocks are graded on the “dividend pillars”: valuation, dividend growth and financial strength. The images here show dividend data at AAII.com for Union Pacific Corp.  (UNP), a stock removed from the DI model portfolio in June 2024 due to not raising its dividend since May 2022 (it subsequently announced a dividend increase in July 2024).
Dividend-seeking investors need to evaluate the dividend payments themselves, how steady they have been and how much you are paying for them. Some of the characteristics that AAII’s DI strategy evaluates are dividend yield and annual dividend payments.
Dividend yields that are significantly above average for the company historically, or that are above average for the industry, may indicate higher risk. The history of annual dividend payments provides a good indication of management’s commitment to paying dividends. When dividends are paid with no interruptions over a significant time period, the company is more likely to keep the payments going even during tough years; dividend increases during prosperous years (with no subsequent decreases) are an even more positive sign.
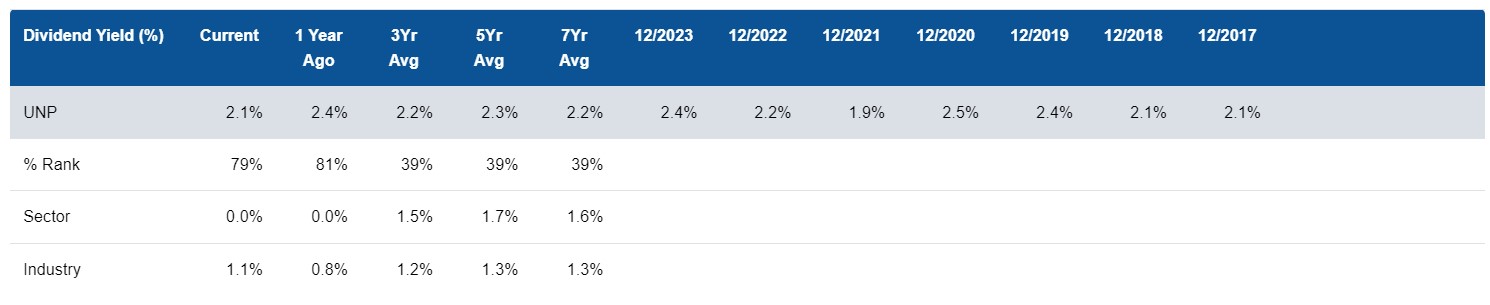
For A+ Investor subscribers, the Valuation tab of the Stock Evaluator presents seven years of dividend yields along with annual average yields for three, five and seven years.
Dividends higher than reported annual earnings are a warning sign since this level of payment cannot be sustained over long time periods. Some of the characteristics AAII’s DI strategy evaluates are the earnings payout ratio, free-cash-flow payout ratio and dividend coverage ratio.
The earnings payout ratio is calculated by dividing dividends per share by earnings per share. It is a measure of how much profit the company is paying out to shareholders in dividends. The free-cash-flow payout ratio is the percentage of free cash flow per share paid out as dividends. Free cash flow is cash flow from operating activities less capital expenditures (capex). It is a measure of a company’s ability to both pay dividends and increase its cash balance. A company’s dividend coverage ratio is a measure of how secure the dividend is based on the company’s cash flow.
Heavier debt loads saddle a company with required cash outflows to bondholders, who must be paid before dividends can be paid to shareholders. However, leverage allows a company to grow faster and so may enhance the return on invested capital (ROIC), even while increasing risk.
Since too much leverage strains the company’s ability to pay the debt back, creditors and dividend investors prefer companies with moderate debt levels. More assets relative to debt cushions a company during negative cash flow periods and should allow the company to maintain its dividend payment even during tough times. Some of the characteristics evaluated by AAII’s DI strategy are debt, liquidity and interest coverage ratios. The A+ Investor Ratios tab of the Stock Evaluator compares seven years of payout ratios and liabilities-to-assets ratios to a stock’s industry medians.
Trends can help you understand if a company’s position is improving or deteriorating.
You can spot trends by examining all the ratios and indicators covered above—as well as earnings, cash flow and revenues—on a year-by-year basis over the last five or 10 years, looking for positive values or values that are at least within acceptable ranges. Deteriorating values are a warning sign. A+ Investors can check the Financials tab of the Stock Evaluator for seven years of financial statement data.
Two growth figures that can also help you identify positive trends are the dividend growth rate and earnings growth rate. These figures are readily available to all AAII members on the Stock Evaluator Snapshot tab, while A+ Investor subscribers can see seven years of growth rates at the Growth tab.
—Adapted from Dividend Investing commentary by Derek J. Hageman
We think you’d like this related webinar! Dangerous Dividend Warning Signs
First Cut Stocks



ROBERT A from NC posted over 2 years ago:
TOM M from WI posted over 1 year ago:
JEAN H from IL posted over 1 year ago:
You need to log in as a registered AAII user before commenting.
Log InCreate an account