

Related

First Cut Stocks
A screen built on the premise that comparing current dividend yields to historical norms for blue-chip companies can allow investors to take advantage of a stock’s cycle of overvaluation and undervaluation.
by Jack Gilleland | July 2022

Famed investment adviser Geraldine Weiss passed away at age 96 in April 2022. Weiss was crowned “the grande dame of dividends” and had been regarded as the “dividend detective.”
Weiss’ approach, as outlined in an AAII stock screen here, can be attributed to her book “Dividends Don’t Lie” (Longman Publishing, 1988), co-authored with Janet Lowe. The methodology outlined in the book served as a game plan for the Investment Quality Trends investment advisory newsletter, which she started and ran for close to 4o years before selling it to Kelley Wright when she retired.
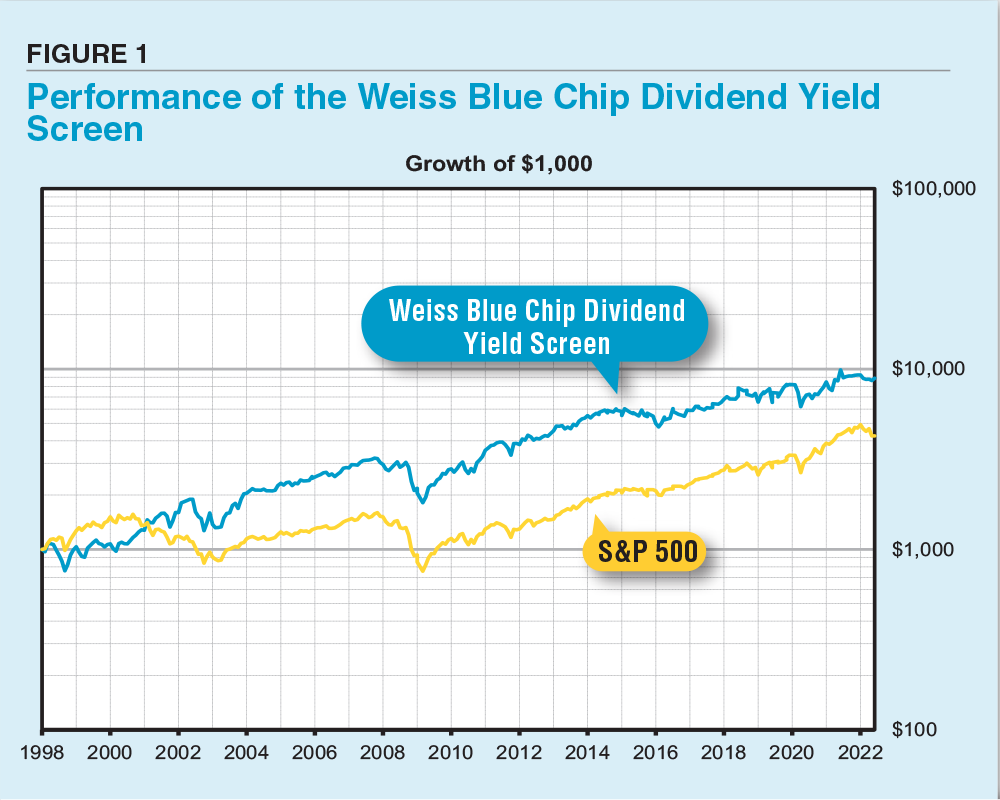
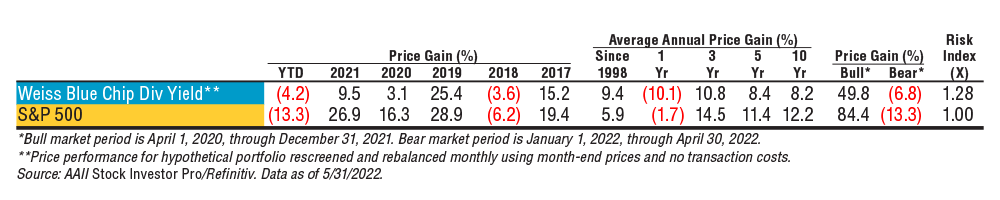
We first presented Weiss’ approach to investing in blue-chip stocks in the November 1996 issue of AAII Journal. We created a stock filter based upon her approach that AAII members can follow at the Screening section of AAII.com. Our Weiss screen has shown solid long-term performance, with an average annual price gain of 9.4% since 1998. The S&P 500 index has gained 5.9% over the same period. As shown in Figure 1, the approach has lagged the S&P 500 during bull markets, but has outperformed the index during bear market periods.
Weiss was a value investor with a focus on blue chips, which are defined as large, well-known companies with a history of growth and dividend paying and that offer quality management, products and services. Weiss primarily looked toward the dividend yield (current annual indicated dividend payment divided by share price) to identify when stocks are undervalued or overvalued. Weiss felt that, over time, stocks repeatedly fluctuate between high and low values best indicated by dividend yield. A careful study of a stock will reveal these extremes, thereby providing guidance on future stock turning points.
Dividends help to separate the speculators from the investors in the marketplace. Investors are only willing to risk their capital in a company when they can be reasonably assured of getting an attractive return on their investment. The dividend payment serves as a direct source of profit for the investor and also acts as a valuable tool to measure the relative attractiveness of a company compared to its own historical pattern. The dividend yield becomes a useful measure when you can be assured that the company is committed to its dividend and has the financial strength for its dividend payments.
Weiss limited her analysis to blue-chip companies because her research showed that there was just as much profit potential in high-quality stocks as in low-quality stocks. However, high-quality stocks often carry less risk, making them a more attractive option.
Weiss felt that blue-chip companies have a reputation for dependability as well as offering the best potential for increasing shareholder value through dividend growth and capital gains.
The Weiss blue-chip universe has these characteristics:
A reliable way to recognize good management is by its long-term track record. Therefore, the first criterion specifies that dividends must have increased a minimum of five times in the past 12 years. A substantial upward trend of increased dividends is made possible through a company’s ability to have successful revenue growth and earnings growth.
Most screening systems available to individual investors do not have a deep enough historical record to look for updates in five out of the last 12 years. We are using AAII’s Stock Investor Pro fundamental stock screening and research database to implement the Weiss screen. The database provides seven fiscal years of income statement data. Since the Weiss approach looks for increases 42% of the time, we specified three increases out of the last seven years.
Earnings growth helps to fuel dividend growth, so Weiss specified that corporate earnings should have increased in at least seven of the last 12 years. It’s another indication of a well-managed company, signaling that a company can survive the tough years and prosper in the good ones. Weiss noted that she also looked for sales increases as well as profit margins that are under control.
Since Weiss looked for earnings increases 58% of the time, we specified four increases out of the last seven years. The screen also requires that trailing earnings per share over the last 12 months be greater than or equal to earnings per share for the last fiscal year.
Weiss required blue-chip companies to have a minimum of 20 to 25 years of uninterrupted cash dividends to help ensure that companies used for relative yield analysis have a high resistance to cutting dividends. Our screen looks for stocks that have paid a dividend for each of the last seven years and that have not decreased their dividend in the last seven years.
It is important to be able to have a sufficient number of outstanding shares to help ensure that investors can purchase and sell shares at appropriate times. Share prices can react more severely to buying or selling pressure if only a limited number of shares are outstanding. Therefore, sufficient liquidity helps to guard against manipulation of share price. Weiss specified that the initial universe of stocks should have at least five million outstanding shares, which we incorporated into our screen.
Weiss pointed out that almost all the trading volume in the stock market involves institutional investors. Institutional investors consist of mutual funds, hedge funds, banks, insurance companies, pensions and retirement funds, and by necessity they tend to gravitate toward high-quality companies. It is therefore important that a company have sufficient interest from the powerful institutional market to prevent the stock price from languishing. Weiss’ recommendation, which we follow, is to require at least 80 institutional shareholders.
From her universe of blue-chip stocks, Weiss applied an analysis of relative dividend yield levels to company historical norms to determine levels of undervaluation and overvaluation. Weiss observed that companies repeatedly fluctuate between levels of high and low values. For example, one stock may typically top out when its yield drops to 2% and rebound strongly when its yield increases to 5%. While a stock may continue to increase in price once its yield drops below 2%, the potential benefit of ownership is not equal to the risk of decline. Its price can only be supported by increasing its dividend, which has the effect of increasing its dividend yield, assuming that the price stays constant.
Weiss’ rule of thumb notes that stocks tend to be undervalued or overvalued when they are within the 10% range of their historical levels of high or low dividend yield average. When a stock’s dividend yield is at or above its historical average high, it’s time to buy. When a stock’s dividend yield is equal to or below its historical average low, it’s time to sell.
The Weiss screen looks for stocks trading at current yields that are within 10% of their seven-year average high dividend yield. The comparison of current yield to the firm’s own past record of dividend yields allows firms with low absolute dividend yields to pass the screen. It is best to study the pattern of movement between high and low dividend yield over a number of cycles. Stock Investor Pro is currently limited to a comparison over the last seven fiscal years.
A high relative current yield by itself does not indicate that a stock is undervalued. It may indicate that the dividend is in jeopardy. For a high relative yield to be considered a sign of an undervalued stock, the company must be expected to continue to pay and expand the dividend over time. While the blue-chip screen helps to reveal strong firms, Weiss also relied on many traditional ratios as indications of the safety of the dividend and the attractiveness of the yield.
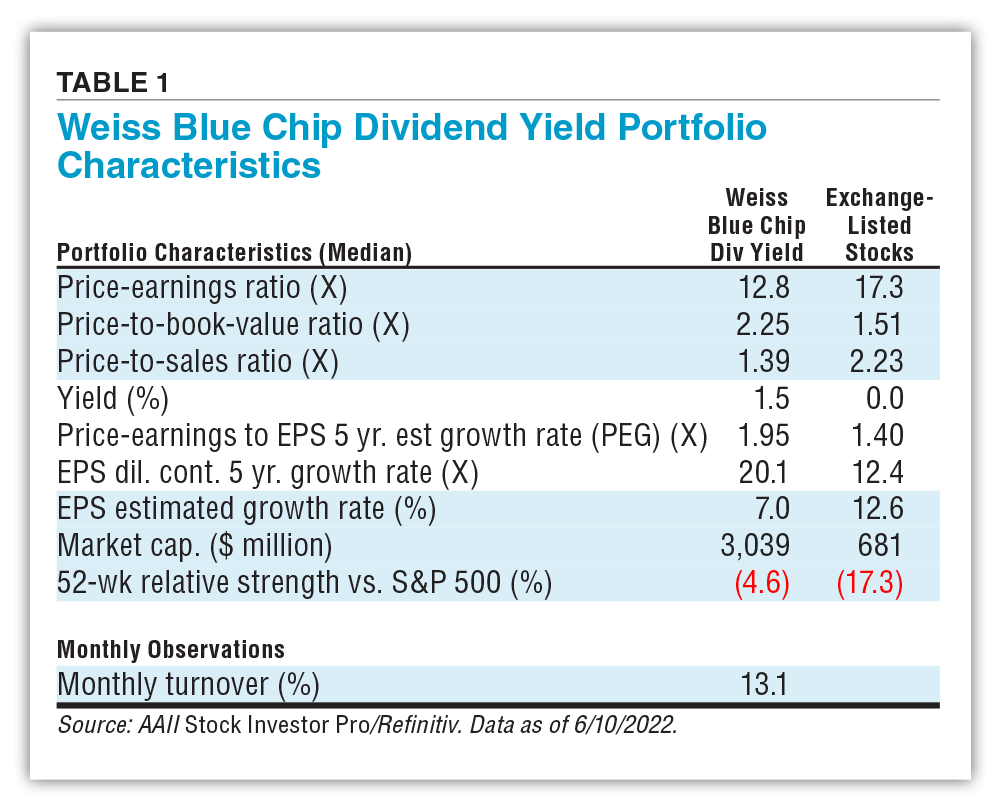
The stocks passing the Weiss screen tend to have a lower price-earnings ratio than the typical exchange-listed stocks, as seen in Table 1. As expected, the yield is higher than the norm. It is interesting that the stocks passing the screen have higher historical earnings growth, but a lower forward consensus earnings growth rate than the typical exchange-listed company. The stocks passing the filter have a median market capitalization (share price times shares outstanding) of just over $3 billion. The typical exchange-listed company is trading with a market cap of $681 million. While the stocks currently passing the screen have underperformed the S&P 500 by 4.6% over the last 52 weeks, the typical exchange-listed stock has underperformed the S&P 500 by 17.3% over the same period.
Turnover with the Weiss screen tends to be lower than most screening approaches followed by AAII, but at times the number of passing companies can be low. From 1998 through 2019, about 11 companies typically passed the Weiss screen. Lately the number of passing companies has been even lower.
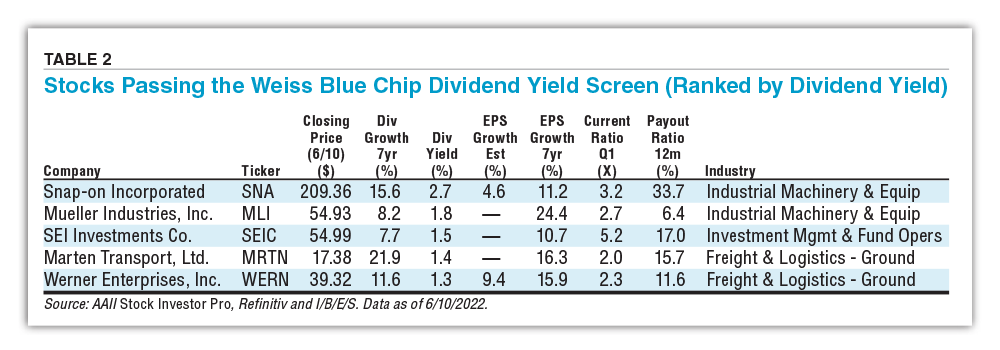
The five companies that met the Weiss Blue Chip Dividend Yield screen criteria as of June 10, 2022, are listed in Table 2 ranked by dividend yield. (For a current list of stocks passing this screen, click here.)
Weiss maintained that all stocks go through cycles of undervaluation and overvaluation. She felt that investors could take advantage of these cycles—buying stocks when they are undervalued and subsequently selling them when they are overvalued—by comparing current dividend yields to historical norms for blue-chip companies.
In Weiss’ view, dividends offer the best indication of both quality and value, while providing a steady source of return. The Weiss screen just touches upon the primary aspects of applying a dividend yield approach to investing. It doesn’t represent a buy list. Any investment approach requires careful study and analysis of individual companies prior to making a decision.
First Cut Stocks



ROBERT A from NC posted over 4 years ago:
CONRAD L from TX posted over 4 years ago:
HAROLD F from CA posted over 4 years ago:
BARRY J from TX posted over 4 years ago:
You need to log in as a registered AAII user before commenting.
Log InCreate an account