



- Explains how past winning stock traits help identify potential future outperformers
- Shows a value-focused strategy that focuses on quarterly earnings momentum
- Emphasizes stock screens as starting tools with further research necessary before making decisions
What does it take to become a winner? Several stock market strategists have explored this question, operating on the premise that identifying the traits of past winners can help uncover future ones.
One of the most widely known studies was conducted by William O’Neil, who analyzed the common characteristics of 500 of the biggest stock market winners dating back to 1953. His findings formed the foundation of the CAN SLIM screening methodology. Given its strong performance, AAII began testing the approach in 1998, along with variations based on O’Neil’s later work. Today, screens based on the CAN SLIM approach remain among the most popular with AAII members. However, it is not the only methodology we track that focuses on identifying the characteristics of winning stocks.
In September 1989, the AAII Journal published an article by finance professor Marc Reinganum titled “Investment Characteristics of Stock Market Winners.” Reinganum’s article examined stocks identified as winners prior to their rise to “super-stock” status and highlighted the traits they shared. Studies like this are valuable when they reveal financial relationships that are likely to persist over time.
Reinganum developed nine trading rules to identify these winners and found that applying these criteria produced returns significantly higher than those of the market. While the resulting portfolio exhibited slightly higher risk, that risk alone did not explain the magnitude of the excess returns. The rules establish parameters for maximum purchase price, minimum levels of profitability and growth, and price momentum targets.
A slightly modified version of Reinganum’s rules is programmed into AAII’s Stock Investor Pro—our fundamental stock screening and research database—and is also available as a screen on AAII.com in the Investor Hub. At the Investor Hub, all members can see the companies passing the screen each day, along with monthly performance for a simple hypothetical portfolio.
The criteria used for our version of the screen are listed in the box at the end of this article.
Screen Performance
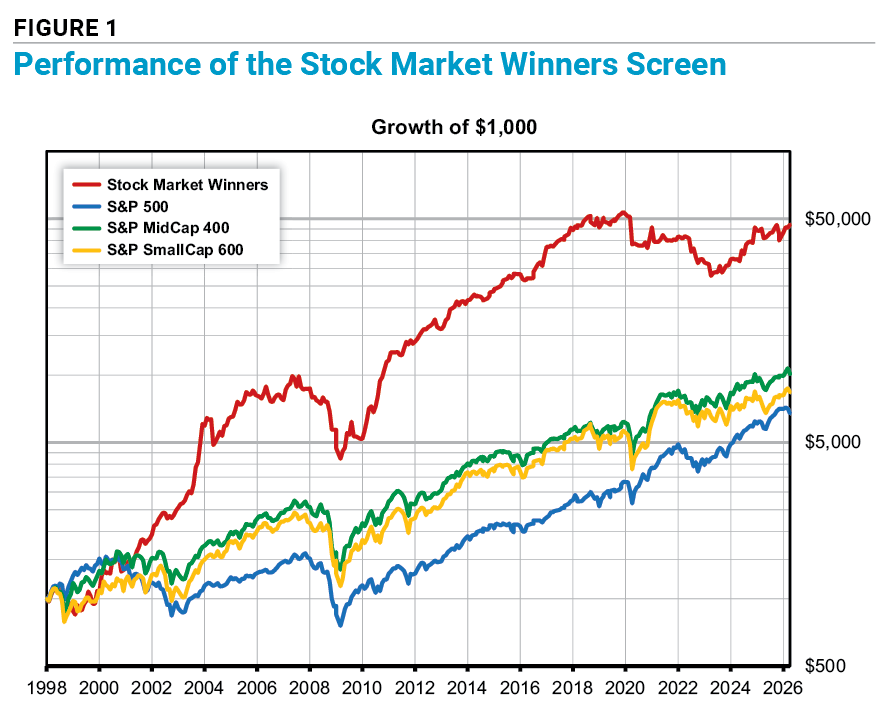
The Stock Market Winners screen has delivered performance that exceeds both small- and large-cap benchmarks over the study period. From January 1998 through March 31, 2026, the strategy generated a compound annual growth rate of 14.6% (Figure 1). By comparison, the S&P 500 index returned 7.0% annually over the same period, while the S&P MidCap 400 index gained 8.5% and the S&P SmallCap 600 index rose 7.8%. These figures exclude dividends; total returns would have been higher if dividend payments were included.
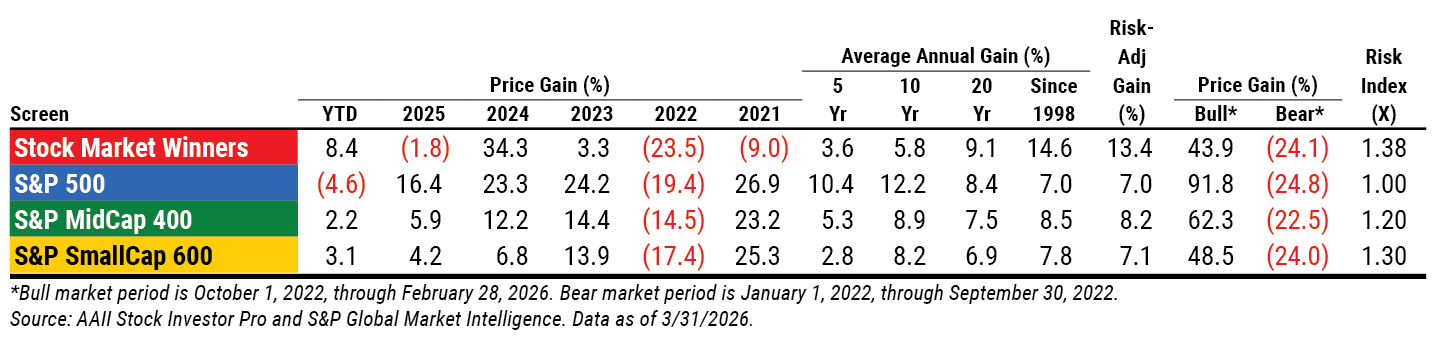
The strategy carries a risk index of 1.38, indicating that it has been about 38% more volatile than the S&P 500. Despite this higher volatility, the risk-adjusted return of the hypothetical model portfolio remains above that of the S&P 500. For context, the risk index is 1.20 for the S&P MidCap 400 and 1.30 for the S&P SmallCap 600.
A review of calendar-year results highlights how performance has varied over time and whether long-term returns stem from consistency or a handful of strong periods. The Stock Market Winners screen has posted positive returns in 69% of years since its inception and outperformed the S&P 500 in 61% of years. The S&P 500, by comparison, recorded positive returns in 71% of years over the same span. In practice, the Stock Market Winners screen often behaves differently from the broader market and has exhibited more streaky performance.
Profile of Passing Companies
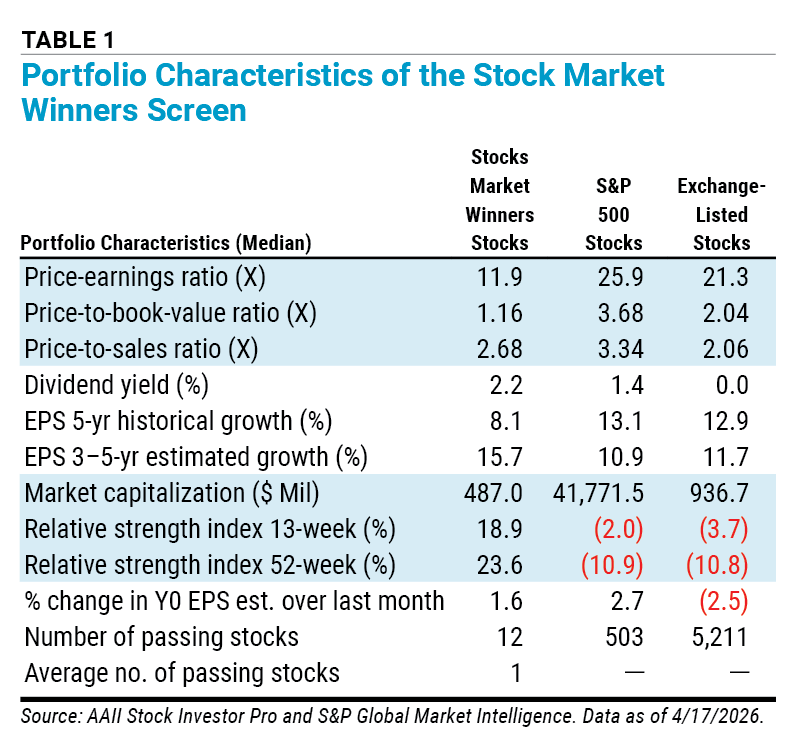
The characteristics of the 12 stocks passing the AAII Stock Market Winners strategy as of April 17, 2026, are shown in Table 1. Historically, an average of one company has met the criteria each month since 1998, although there have been only 10 months during which no companies passed the screen.
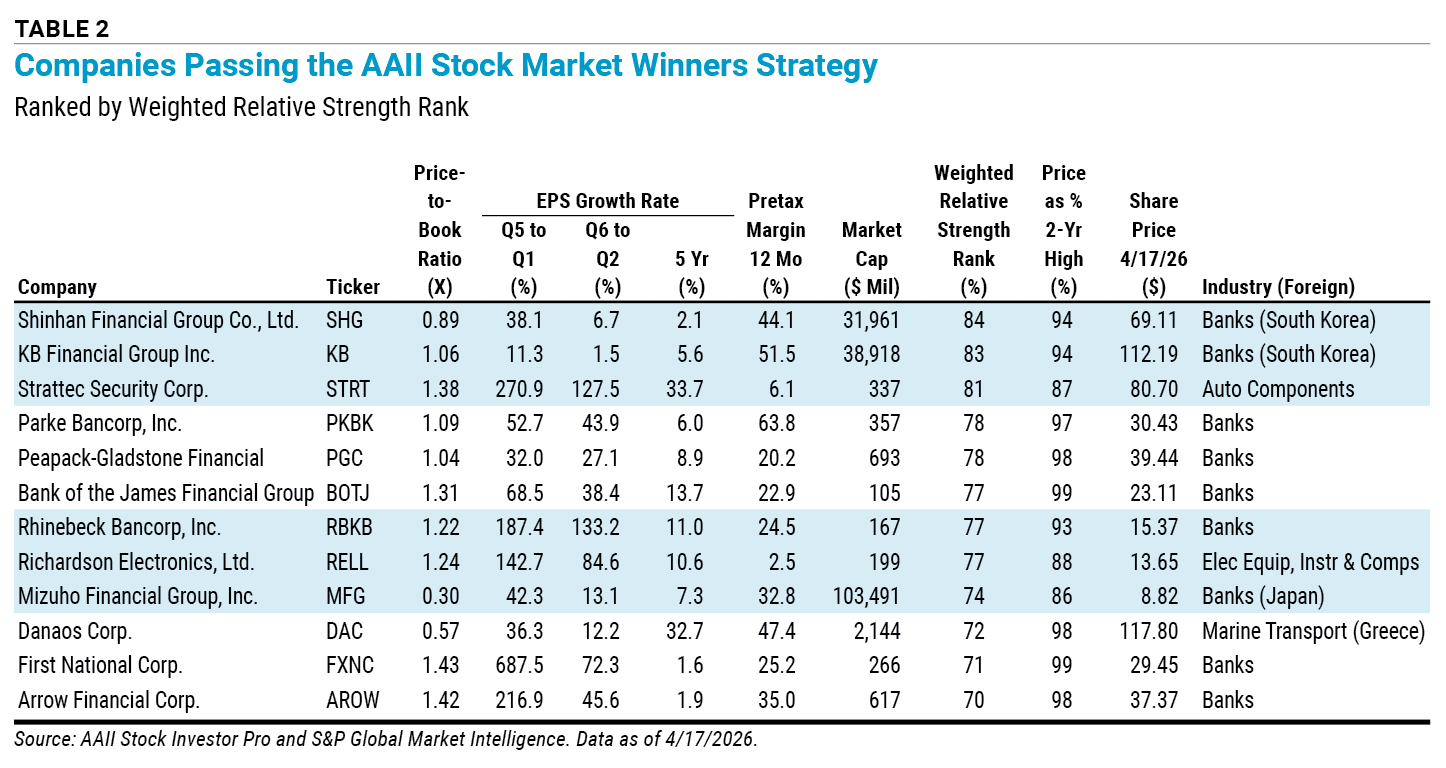
Unlike O’Neil’s CAN SLIM approach, which focuses on earnings and price momentum with no value elements, the cornerstone of the Stock Market Winners strategy is a price-to-book-value (P/B) ratio of no more than 1.50. Based on current market valuation, this limits the universe of eligible companies to the lowest 29% of U.S.-traded stocks. This is slightly higher than the maximum value used in Reinganum’s original study in order to allow for a larger pool of potential candidates. Japanese bank Mizuho Financial Group Inc.  (MFG) has the lowest price-to-book ratio among these companies at 0.30 (Table 2).
Go to All Screens for an updated list of stocks passing this screen.
Given this value-oriented constraint, it is not surprising that the group exhibits a lower median price-earnings (P/E) ratio (11.9) than both the typical exchange-listed stock (21.3) and the S&P 500 (25.9).
While low price-to-book screens often uncover neglected stocks, some deserve that status. As a result, additional filters are applied to help distinguish potential turnaround candidates from value traps.
Some of these conditioning filters in the Stock Market Winners methodology focus on quarterly earnings momentum. The first requires year-over-year growth in earnings per share for each of the last two fiscal quarters. Comparing one quarter to the same quarter one year prior eliminates the seasonality in earnings that many companies experience.
Automobile components manufacturer Strattec Security Corp.’s (STRT) earnings jumped 270.9% for the quarter ended December 28, 2025. (The company is expected to release results for the quarter ended March 31, 2026, on May 8—after our publication deadline for this issue.) Whenever such a large percentage increase is reported, it is a good idea to examine the scale of earnings. Upon further investigation, we found that earnings from continuing operations grew from $0.32 per share for the quarter ended December 28, 2024, to $1.20 per share for the quarter ended December 28, 2025. The company continues to rebound from an equity restructuring agreement executed in 2023 that impacted the bottom line.
The Stock Market Winners approach further requires that the year-over-year growth in earnings from continuing operations for the latest fiscal quarter be greater than the year-over-year earnings growth of the previous quarter.
This short-term earnings growth did not carry over to the longer term, as the current passing companies have a median five-year average earnings growth rate of 8.1%, compared to 12.9% for the typical exchange-listed stock and 13.1% for the stocks in the S&P 500. Among the passing companies, Strattec Security has the highest five-year average annual earnings growth rate at 33.7%. On the other end of the spectrum is the bank First National Corp. (FXNC), whose earnings have grown at an average rate of 1.6% over the last five years.
Price momentum is another key component. The strategy uses a weighted relative strength measure that emphasizes recent performance, assigning a 40% weight to the latest quarter and 20% to each of the prior three quarters. To qualify, a stock must rank above 70% of all stocks on this measure.
The stocks passing the screen as of April 17, 2026, have outperformed the S&P 500 by 23.6% over the last 52 weeks, while the typical exchange-listed stock lagged the S&P 500 by 10.8% over the same period. Notably, the typical constituent of the S&P 500 lagged the index value change by 10.9%, highlighting the exaggerated impact of the largest firms in the index.
The Stock Market Winners strategy also requires that the current stock price be within 15% of its two-year high. When the market is reaching new all-time highs, many companies will pass this filter, but it will be very restrictive in deep bear markets.
Lastly, the Reinganum study found that 90% of the firms studied had fewer than 20 million shares outstanding before their main price increase, and this is the limit used in the AAII Stock Market Winners screen. Limiting the number of shares outstanding leads this screen to isolate very small companies in terms of market capitalization (shares outstanding multiplied by price per share).
Currently, passing stocks have a median market cap of $487.0 million, compared to $936.7 million for the typical exchange-listed company.
Financials companies account for the largest share of the passing stocks, representing 75% of the 12 companies that currently meet the screen’s criteria. One company each from the consumer discretionary, information technology and industrials sectors also qualifies. Notably, four of the passing companies are headquartered outside of the U.S.; their countries of origin are identified in Table 2.
Conclusion
By creating a stock selection strategy based on characteristics that have worked well in the past, we are assuming that the factors will remain relevant going forward, which is by no means guaranteed.
No matter how strong a screening approach’s historical performance, it should be viewed as a starting point, not a final decision tool. After narrowing the universe to a manageable list, investors should conduct further due diligence to assess financial strength, risk tolerance and alignment with their investing horizon.
Analyzing the financial and valuation traits of currently passing companies offers additional insight into how the strategy identifies potential opportunities.
What It Takes: Stock Market Winners Screen Criteria
- The price-to-book-value (P/B) ratio (price per share divided by owner’s equity per share) is less than or equal to 1.50;
- Earnings per share from continuing operations for each of the last two fiscal quarters (Q1 and Q2) are greater than earnings per share from continuing operations for the same quarter one year prior (Q5 and Q6);
- Same-quarter growth in earnings per share from continuing operations from Q5 to Q1 is greater than same-quarter growth in earnings per share from continuing operations from Q6 to Q2;
- The five-year growth rate in earnings per share from continuing operations is greater than zero;
- The pretax profit margin (pretax net income divided by sales) for the last 12 months is positive;
- The weighted relative strength for the last four quarters ranks in the top 70% of the entire database (percent rank greater than or equal to 70);
- The current stock price is within 15% of the highest price at which the stock has traded over the last two years; and
- The average number of shares outstanding for the latest fiscal quarter (Q1) is no greater than 20 million.

Related

AAII Stock Ideas
How to Buy and Sell Stocks Using AAII Stock Screens
Related

Discussion
FREE REPORT

Get your free copy of our special
report analyzing the tech stocks
most likely to outperform the
market.
BARRY J from TX posted 5 months ago:
JOHN L from NJ posted 5 months ago:
ROBERT A from NC posted 5 months ago:
ROBERT A from NC posted 5 months ago:
You need to log in as a registered AAII user before commenting.
Log InCreate an account