

Related

AAII Stock Ideas
The same criteria used by a screen to find attractive stocks can help you make disciplined decisions about when to sell stocks.

A successful long-term investing approach depends on having a clear and repeatable process. Investing without a plan is similar to starting a home renovation with no blueprint or budget. Enthusiasm gets you started, but discipline is what carries you to the finish line and saves you from numerous trips to the hardware store along the way.
Stock screens can help you uncover suitable candidates that deserve a place in your portfolio. Just as important in your plan is knowing what will trigger you to sell before making an investment. The same criteria used by a screen to find attractive stocks can help you make disciplined decisions about when to sell a stock.
I explain how you can incorporate stock screens into your investment discovery, buying and selling processes.
AAII has 55 stock screens that are designed to help individual investors apply discipline and structure to the stock selection process. They translate well-known investing philosophies or factors into rules-based screening models that investors can use to identify stocks that align with a specific strategy.
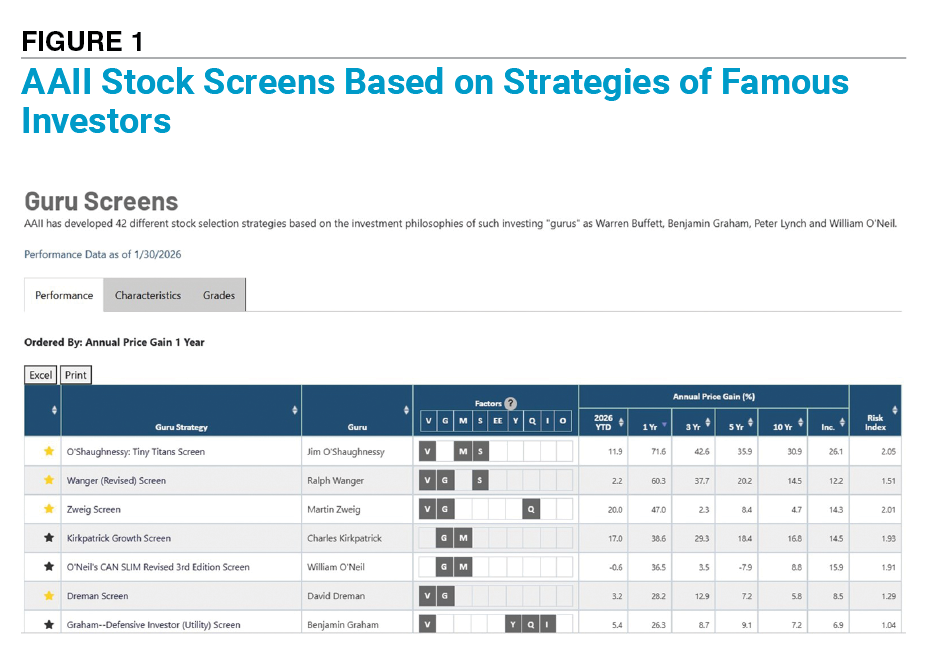
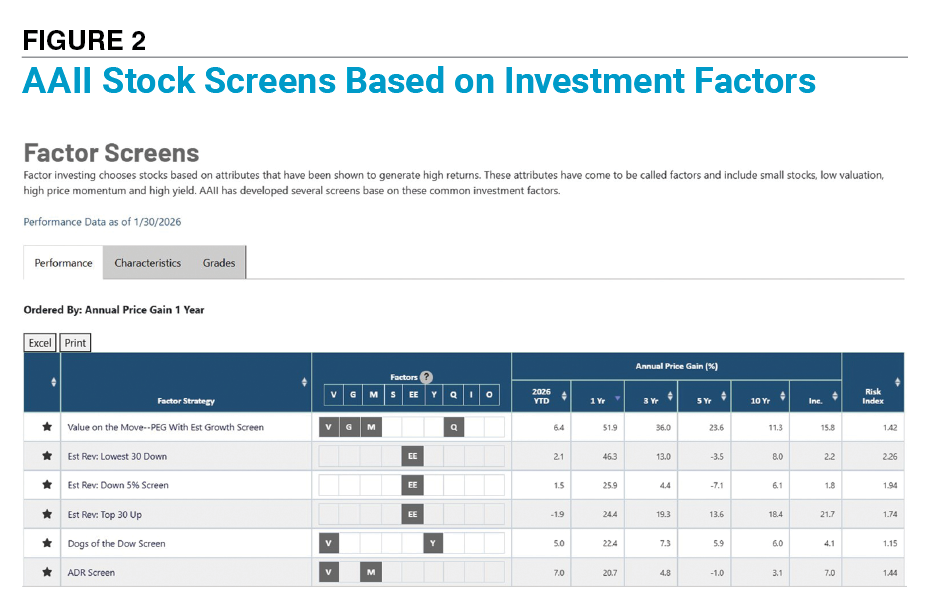
Guru stock selection strategies (Figure 1) are based on the philosophies of famous investors like Warren Buffett, Benjamin Graham, John Neff and James O’Shaughnessy. Factor screens (Figure 2) utilize attributes that have been shown to generate positive returns. These attributes, referred to as factors, include small size, low valuation, high price momentum and high yield.
AAII Stock Screens narrow a broad universe of securities into a manageable list that aligns with a specific strategy or set of criteria. Each screen highlights companies that currently meet defined characteristics. They cannot account for future market conditions, management decisions or unexpected events.
Guru and factor screens can be used to hone your considerations for purchasing stocks. You can also use them to establish sell rules that mirror the criteria you originally used to select stocks for your portfolio.
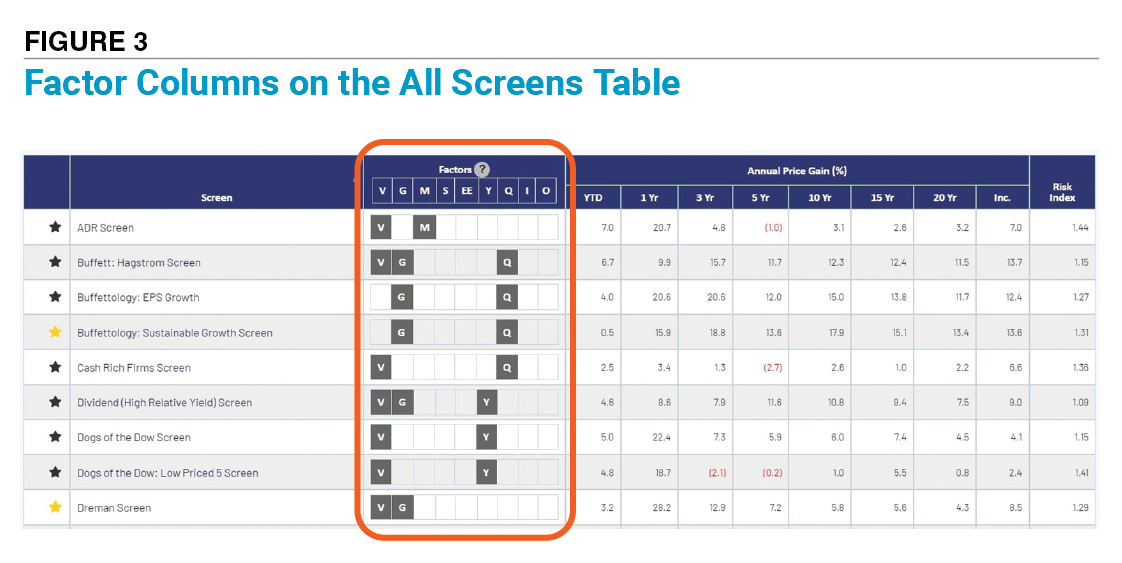
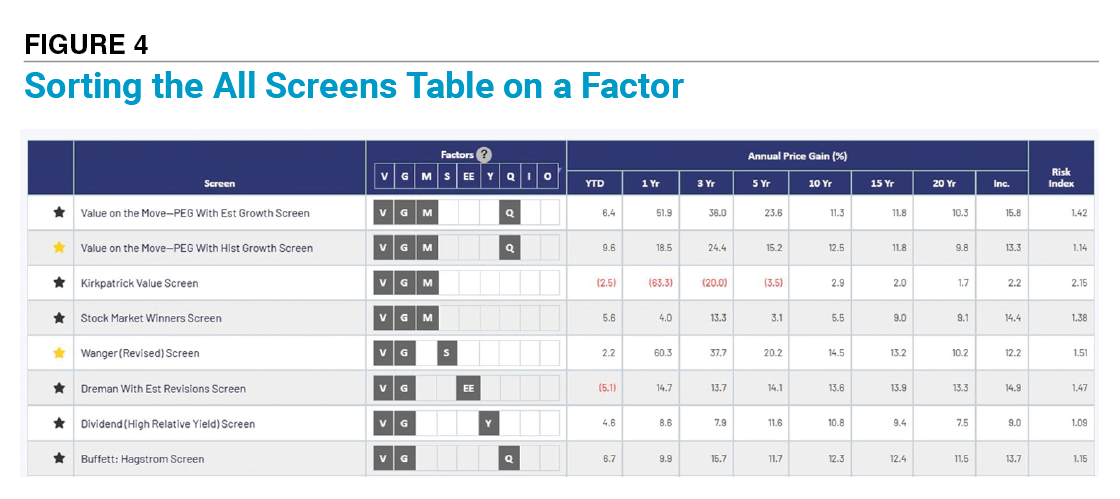
Investment factors are at the core of selecting stocks identified by AAII screeners. As shown in Figure 3, the All Screens table denotes which screens include criteria for value, growth, momentum, size, earnings estimate revisions/surprises, yield, quality, industry/sector rotation or other (a miscellaneous category that captures specialty screening strategies). Clicking on a factor’s initial in the column header makes it easy to identify the screens that utilize that particular factor (Figure 4). Click on the question mark next to the word Factors in the column heading to see what each initial stands for.
Many investors are drawn to contrarian strategies because they offer a disciplined framework for exploiting behavioral biases that can push prices away from underlying fundamentals. I use a popular contrarian screen as an example for setting buy and sell rules.
David Dreman attempts to avoid the behavioral traps of the market by following the principles of contrarian investing. Dreman finds the continuous overreaction of investors whose assessments of a firm’s earnings are wrong to be very predictable. It is upon that predictable variable that Dreman bases his investing approach of avoiding the stocks the crowd is pursuing and pursuing the ones the crowd is avoiding.
The AAII Dreman screen focuses on both value and growth criteria. Dreman recommends a low price-earnings (P/E) ratio strategy that is relatively simple and eliminates the need for complicated security analysis.
His approach includes tenets applicable to stock selection for individual investors. The first is to focus on a universe of mid- to large-cap companies, which tend to be more visible to investors and regulators, thus reducing the risk of accounting irregularities. These firms also typically have greater financial resilience and a lower likelihood of failure than smaller companies or start-ups.
The second tenet is to invest in stocks with low price-earnings ratios, specifically those ranking in the bottom 40% of all stocks by price-earnings ratio and trading below the S&P 500 index’s price-earnings ratio. Selecting from the bottom 40% of stocks ranked by price-earnings ratio creates a broad yet manageable universe of investment candidates.
Price relative to earnings is a valuation metric. As it increases, the stock is likely to become overvalued. Relative valuation metrics are helpful for setting buy and sell thresholds for value-based strategies.
Dreman also seeks stocks with a high and sustainable dividend yield. The screen considers stocks that provide a minimum dividend yield of 1.5%—high enough to be significant, yet low enough to not exclude many industries. A high dividend yield provides a measure of protection when prices drop and helps increase overall total return. Comparatively, the S&P 500’s median dividend yield is currently 1.4%.
Companies with low price-earnings ratios may have difficulty weathering unfavorable economic conditions. Addressing that, Dreman looks for companies with a strong financial position as measured by high ratios of current assets relative to current liabilities and low debt as a percentage of equity. High return on equity (ROE) and pretax profit margins help identify companies without structural flaws. The company should have delivered stronger earnings growth than the S&P 500 historically and should be expected to continue doing so over the next year. Precise estimates of future earnings are not needed, only a general sense of the direction of the firm’s earnings growth.
Mechanical approaches built on Dreman’s core low price-earnings philosophy prioritize long-term ownership and strive to reduce portfolio turnover. These are used to further whittle the list of stocks in the bottom 40% ranked by price-earnings ratio.
Investors can buy and hold stocks ranking in the lowest 20% based on their price-earnings ratio. You could also choose a large company paying good dividends that is priced at a discount of 20% or more from the S&P 500.
The strategy emphasizes buying low price-earnings stocks and weeding out holdings periodically as the ratio improves or if they fail to perform as well as the S&P 500 over a given period.
Purchase the lowest 20% price-earnings ratio stocks and rerun the screen annually. Dreman notes that this turnover may appear to be high at first glance, but he found that less than half of low price-earnings ratio stocks usually move up in less than one year.
Figure 5 shows the companies that passed the AAII Dreman screen as of February 6, 2026. Companies are ranked by price-earnings ratio, which is calculated using the current stock price divided by diluted earnings per share from continuing operations for the last four quarters (trailing 12 months). The rank of stocks is shown in the % Rank-PE column. The dividend yield and estimated earnings per share growth (EPS Growth Est) are also shown. Dividend yield is calculated by dividing the indicated dividend by the current stock price.
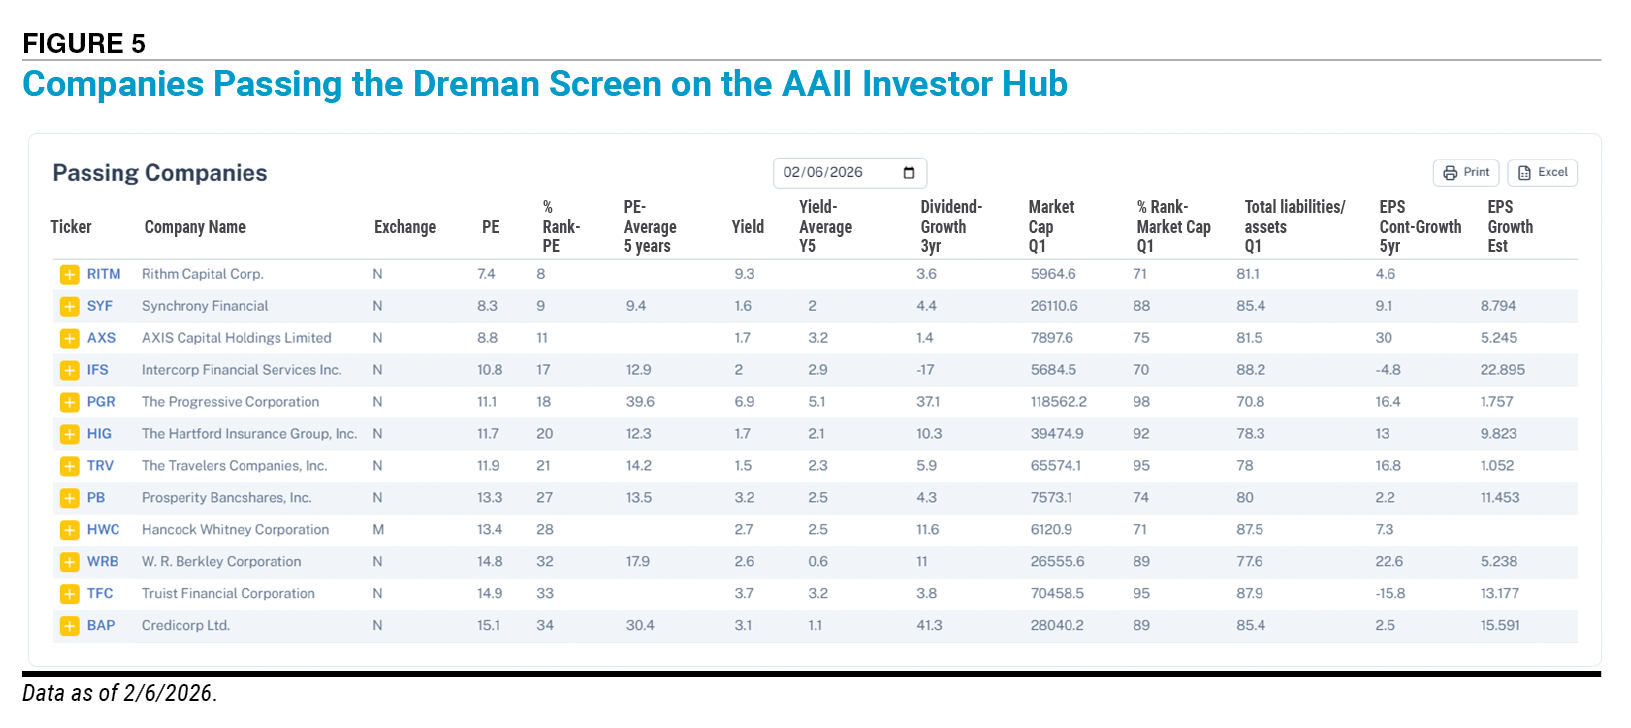
Growth can be considered on both a long-term past and forward-looking basis. The earnings per share growth estimate shown for companies currently passing the screen is the median (midpoint) of analysts’ expected five-year growth rate per the S&P Global consensus estimates. The column labeled EPS Cont-Growth 5yr shows the compound annual increase or decrease in earnings from continuing operations over the most recent five-year period.
Passing stocks exhibiting historical and expected growth rates above the S&P 500’s median levels may be strong candidates for inclusion in the portfolio. There is one thing to note about growth rates that include consensus estimates: The further out the time horizon, the fewer reliable estimates there are to calculate growth rates.
Stocks with low price-earnings ratios or high dividend yields are only attractive if they are expected to grow and prosper in the future. The Dreman strategy calls for selling stocks when their price-earnings ratios approach that of the overall market, regardless of how favorable prospects look. The stock should then be replaced by another stock with a low price-earnings ratio. On the other hand, a stock that attains a high price-earnings ratio solely because of an earnings decline should not be sold, since the price drop is likely an overreaction to the earnings decline.
Dividend yield could be considered as an additional sell trigger. There are many ways to use dividend yield as a determinant for when to sell. A minimum yield threshold such as 1.0% can be set; or, stocks may become sell candidates if their median dividend yield falls below that of the S&P 500. Comparing the stock’s historical yield norm to its current dividend yield and then setting a lower threshold is yet another way to utilize the dividend yield.
Industry growth rates change as economic conditions, consumer demand and technological innovation evolve over time. Shifts in regulation, competitive dynamics and input costs can also accelerate or slow growth across an industry. Industry life cycles—which range from early expansion to maturity or decline—play a key role in determining how quickly companies within a sector can grow. Growth expectations also hinge on industry assumptions, and with that, analyst coverage can change. Fewer analysts covering a stock can result in less meaningful growth estimates. The historical five-year earnings growth rate and the consensus earnings long-term growth estimate can both be reexamined to see how far they deviate from the S&P 500 median and from historical values for the stock’s industry.
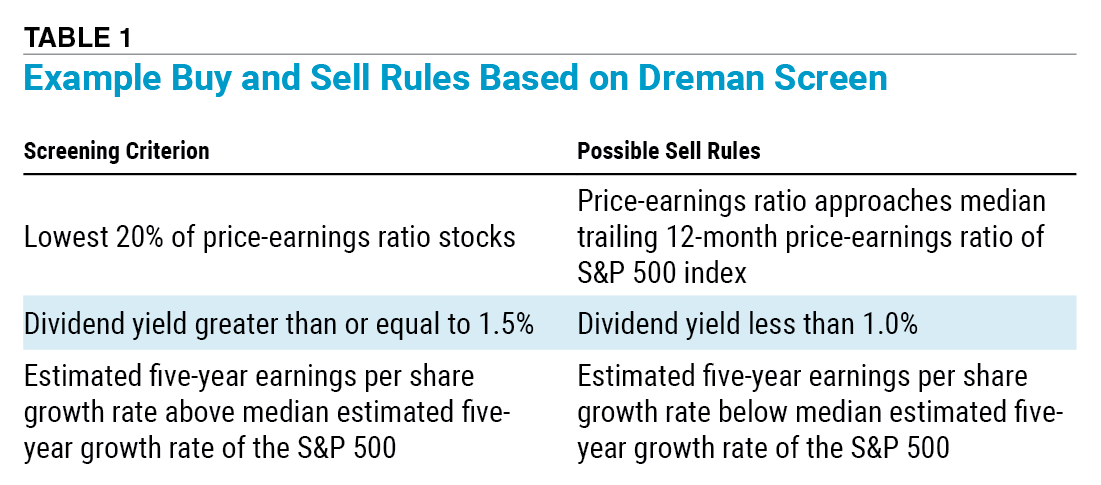
Table 1 compares the initial screening criteria for the Dreman screen to these possible threshold-based sell rules. This is just one example of how you might create sell rules based on a set of buy criteria.
Situations may arise that are not addressed by your original sell rules and require additional judgment. An example is when a company you own becomes the target of an acquisition. As these circumstances occur, incorporate them into your sell rules so you have clear guidelines to follow if similar situations arise in the future.
Buy and sell rules provide you with clarity and lend direction to your investing strategy. Investors who fail to incorporate them when using stock screens may find it more difficult to make informed portfolio decisions.
All AAII members have access to all 55 AAII Stock Screens, the stocks passing those screens and the criteria used for determining each screen. You can now access the screens directly in the AAII Investor Hub.
AAII Stock Ideas

AAII Stock Ideas


JOHN L from NJ posted 7 months ago:
BARRY J from TX posted 7 months ago:
JOHN L from NJ posted 7 months ago:
ROBERT A from NC posted 6 months ago:
BARRY J from TX posted 5 months ago:
MARK E from IA posted 5 months ago:
JEAN H from IL posted 2 months ago:
You need to log in as a registered AAII user before commenting.
Log InCreate an account